
Inspiration
As a data analyst by profession, I was drawn to this project as a unique challenge to apply my analytical skills in the high-stakes world of motorsport. The Toyota Gazoo Racing GR Cup presented an opportunity to transform raw telemetry data into actionable insights that could make the difference between winning and losing. The challenge wasn't just about crunching numbers—it was about understanding the story the data tells about driver performance, race strategy, and track dynamics.
What It Does
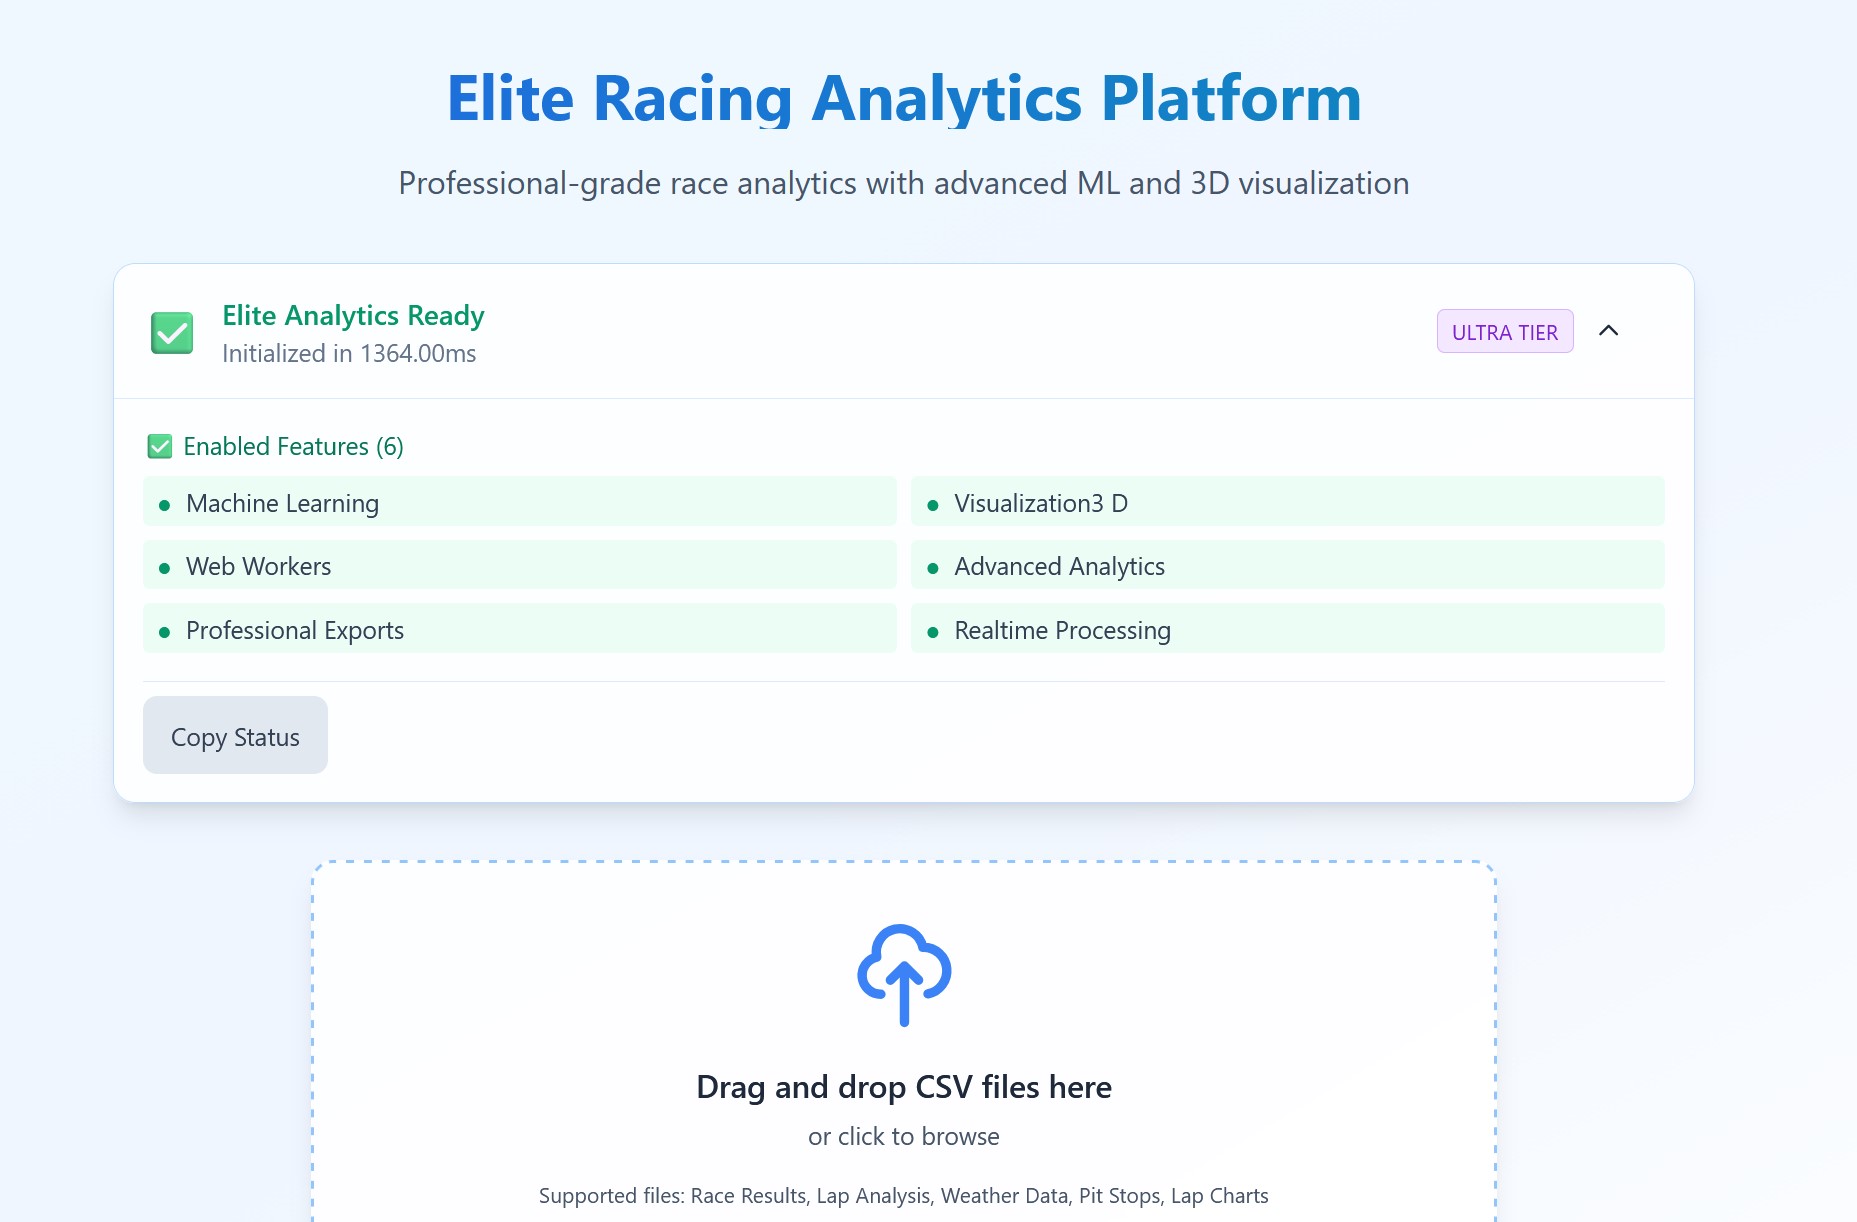
BluChips Racing is an intelligent race analytics platform that transforms complex motorsport telemetry into clear, actionable insights. The platform:
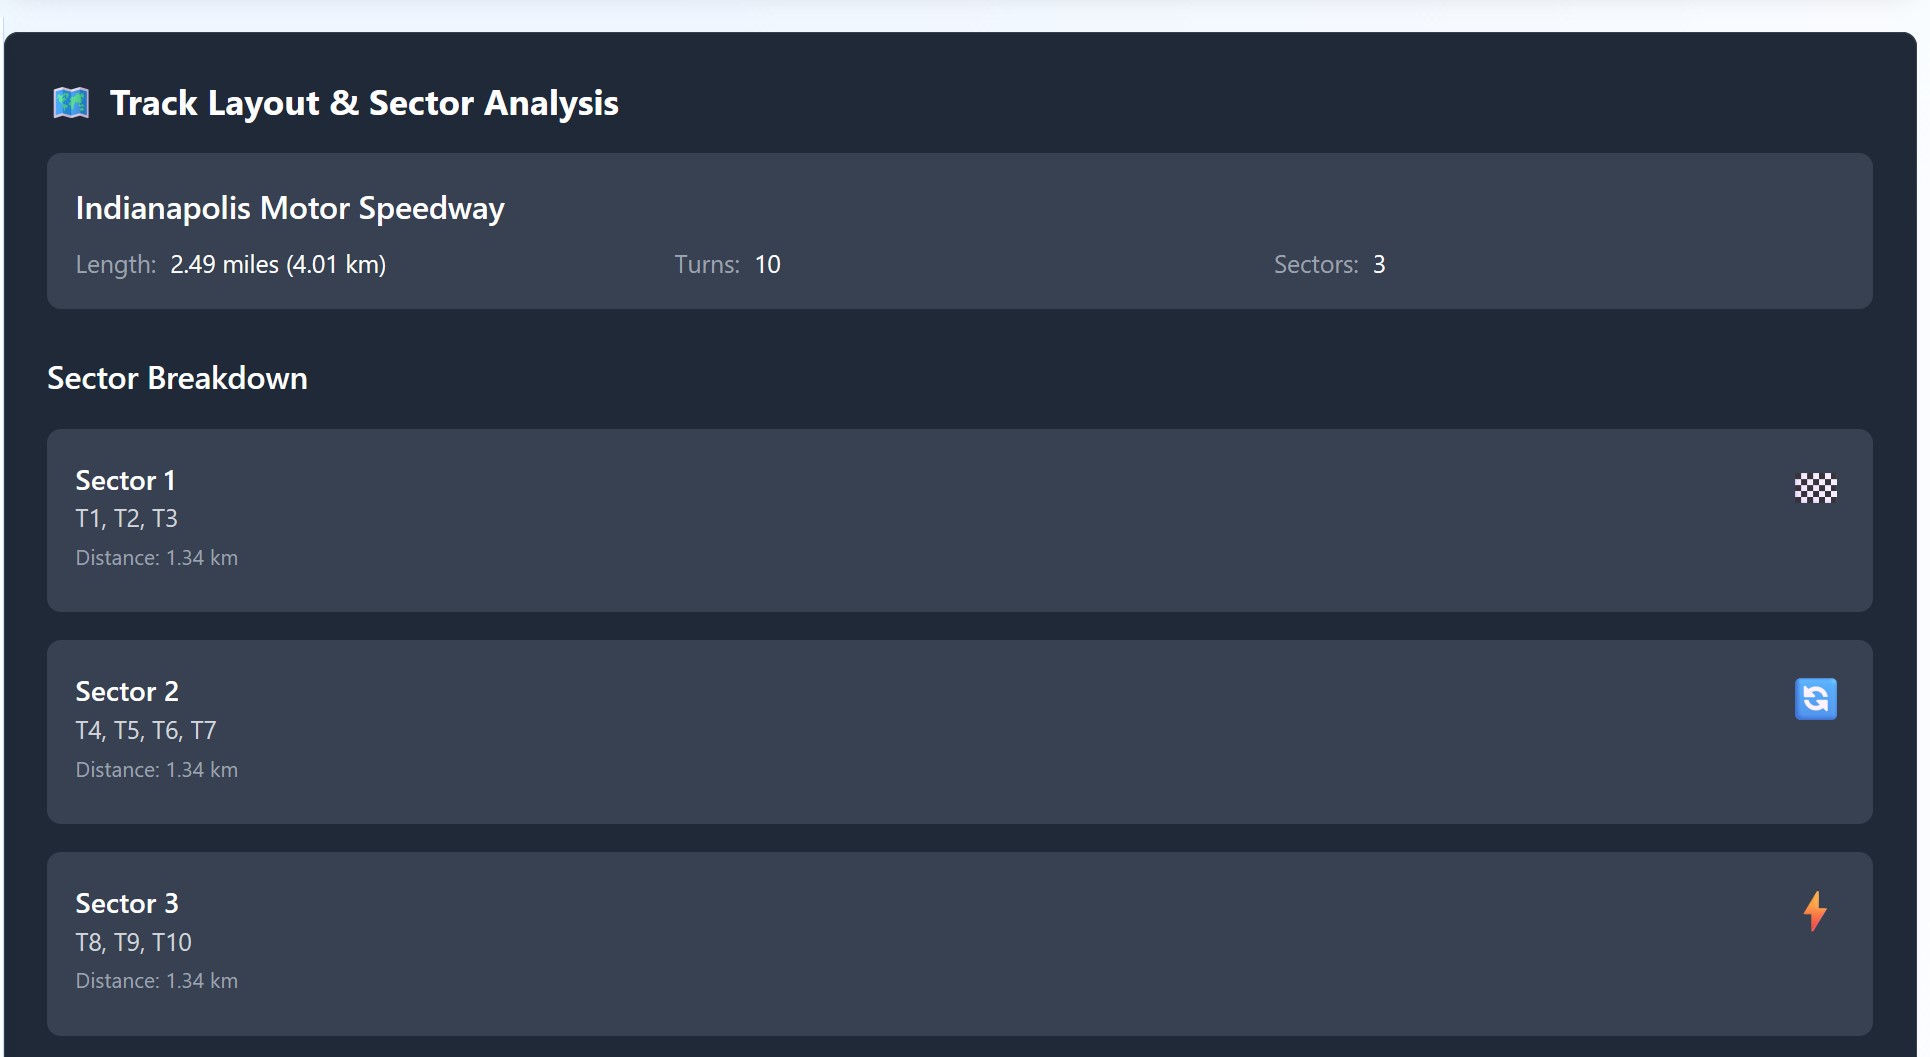
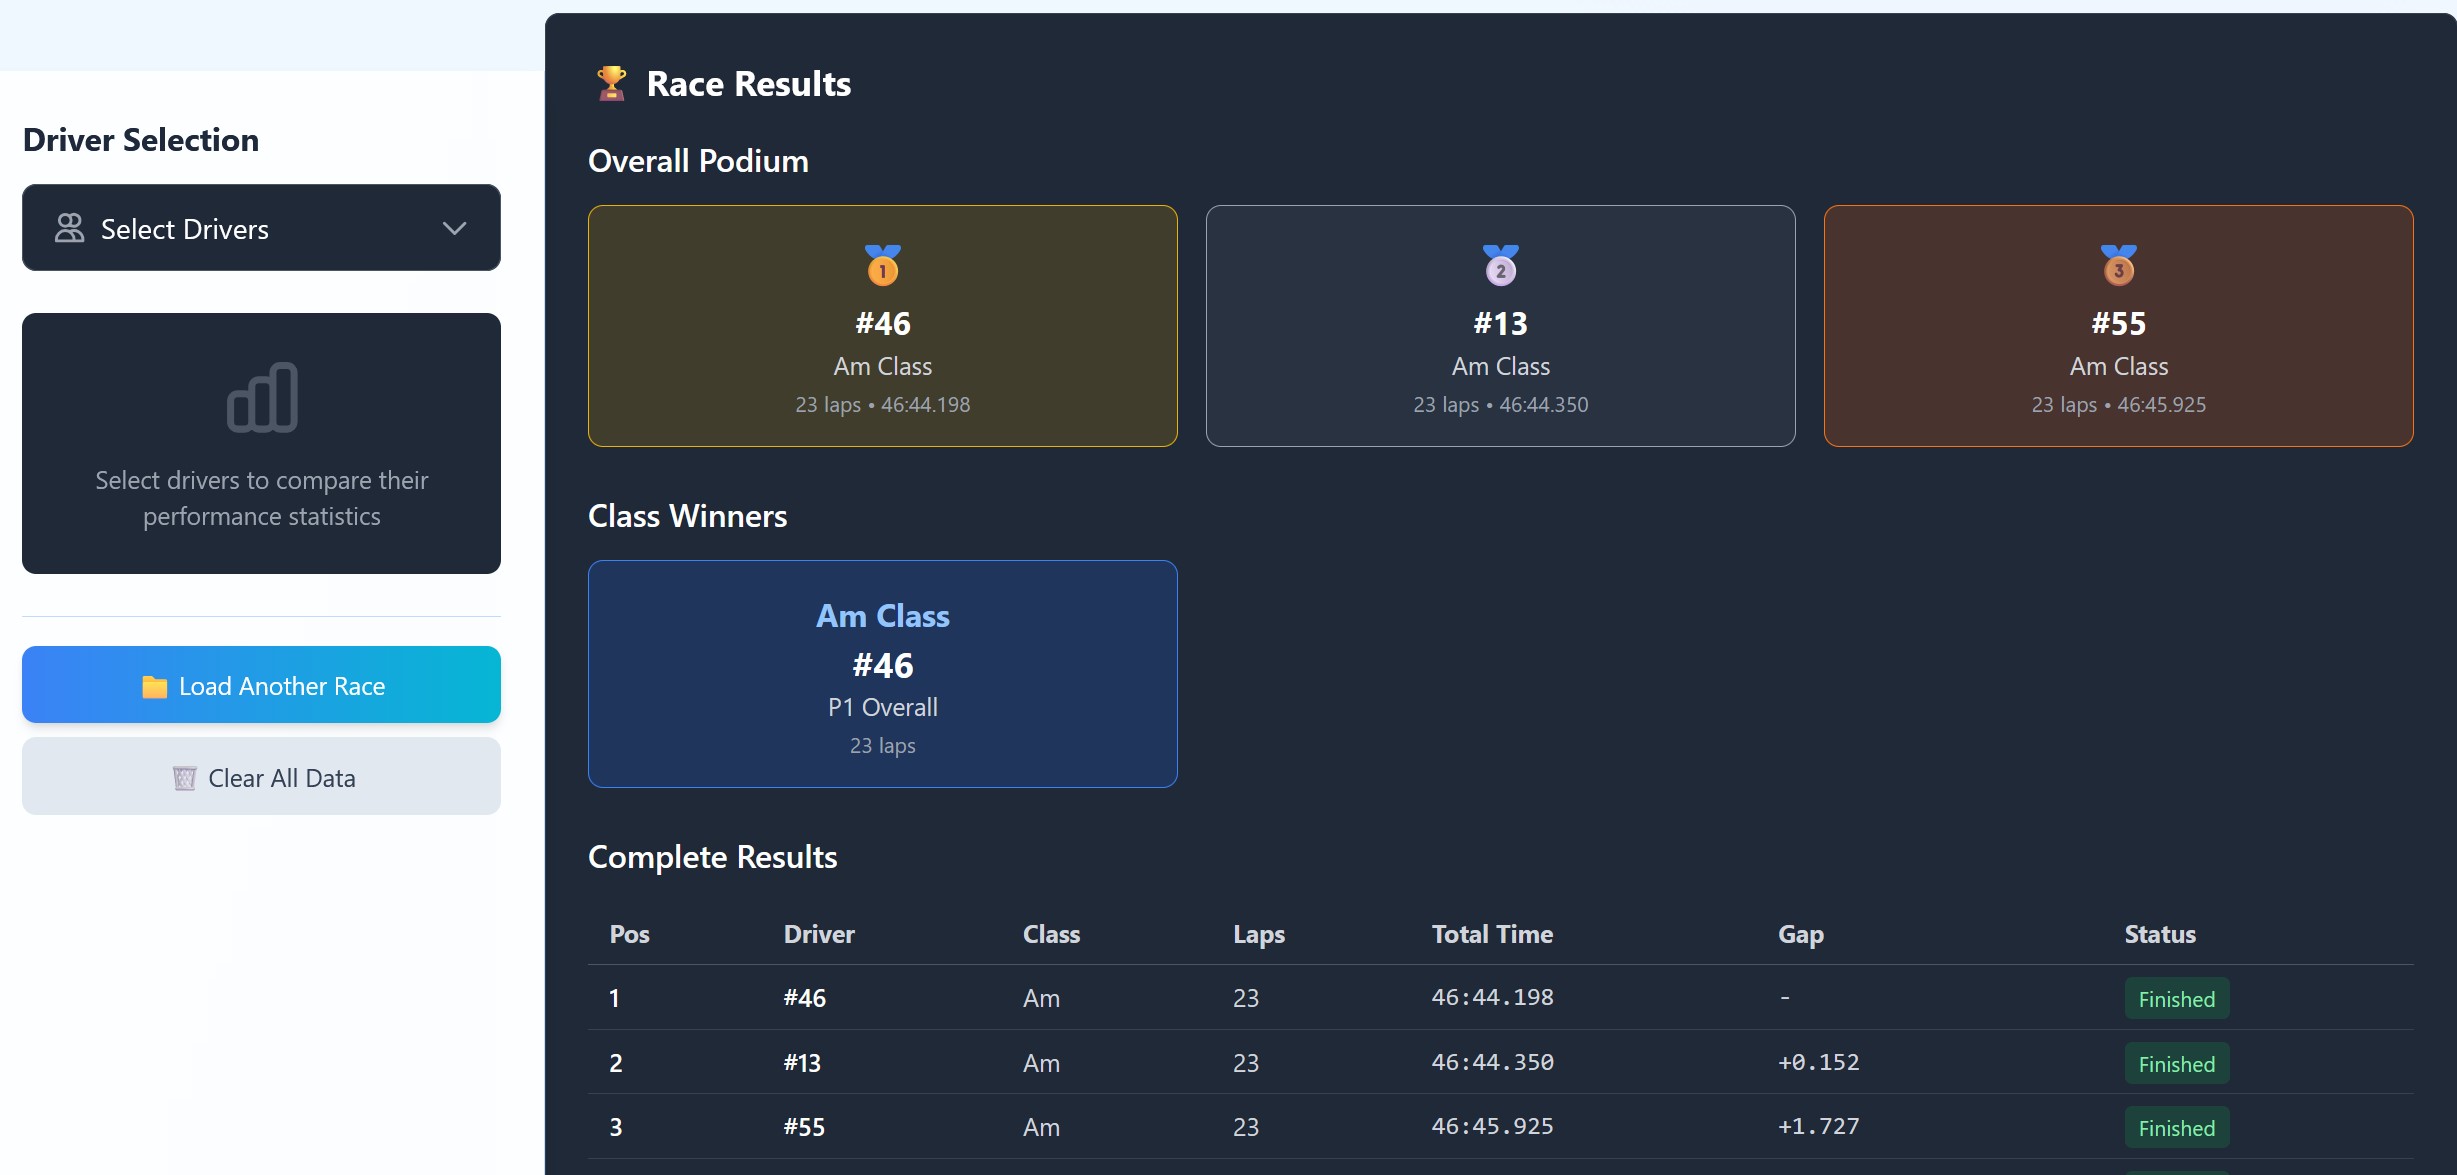
- Analyzes race performance across multiple tracks (Barber, Indianapolis, Sonoma, Virginia) with detailed lap-by-lap breakdowns
- Generates AI-powered insights using statistical analysis to identify performance patterns, strategic opportunities, and anomalies
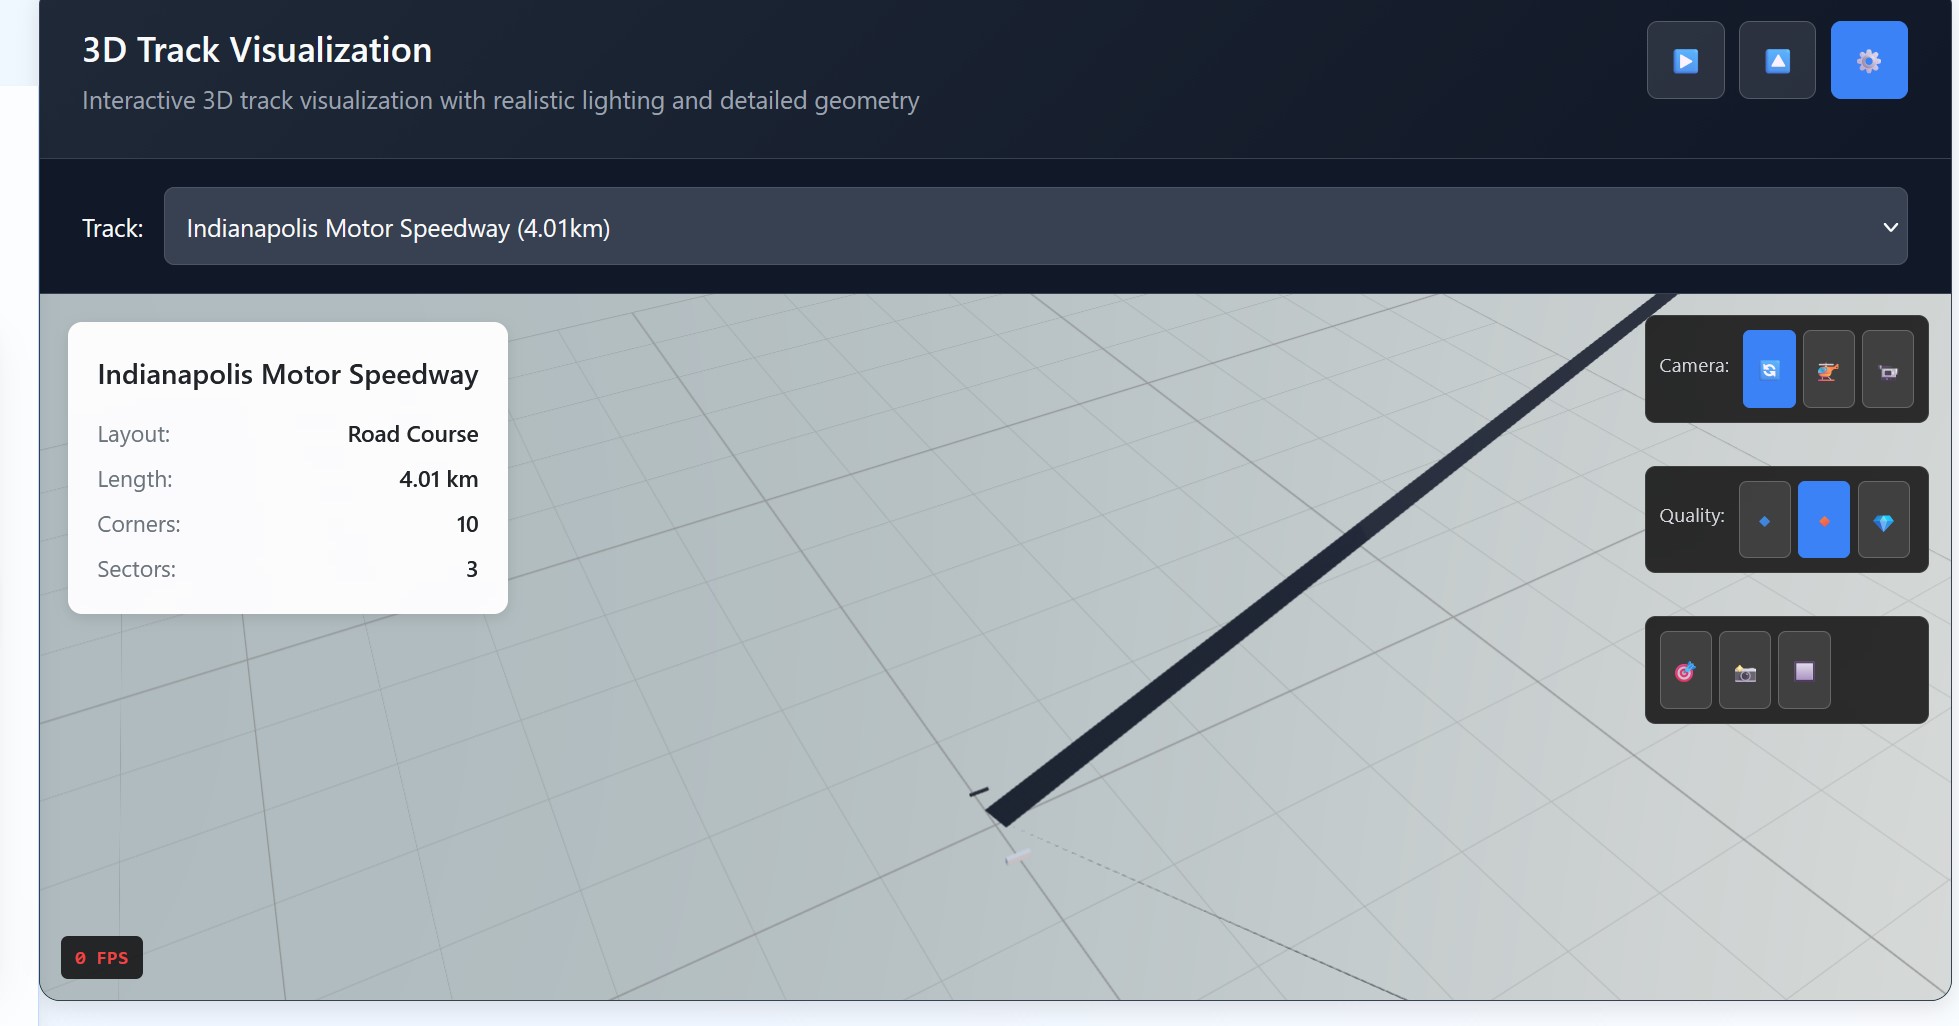
- Visualizes track geometry in both 2D and 3D, allowing teams to understand corner-by-corner performance
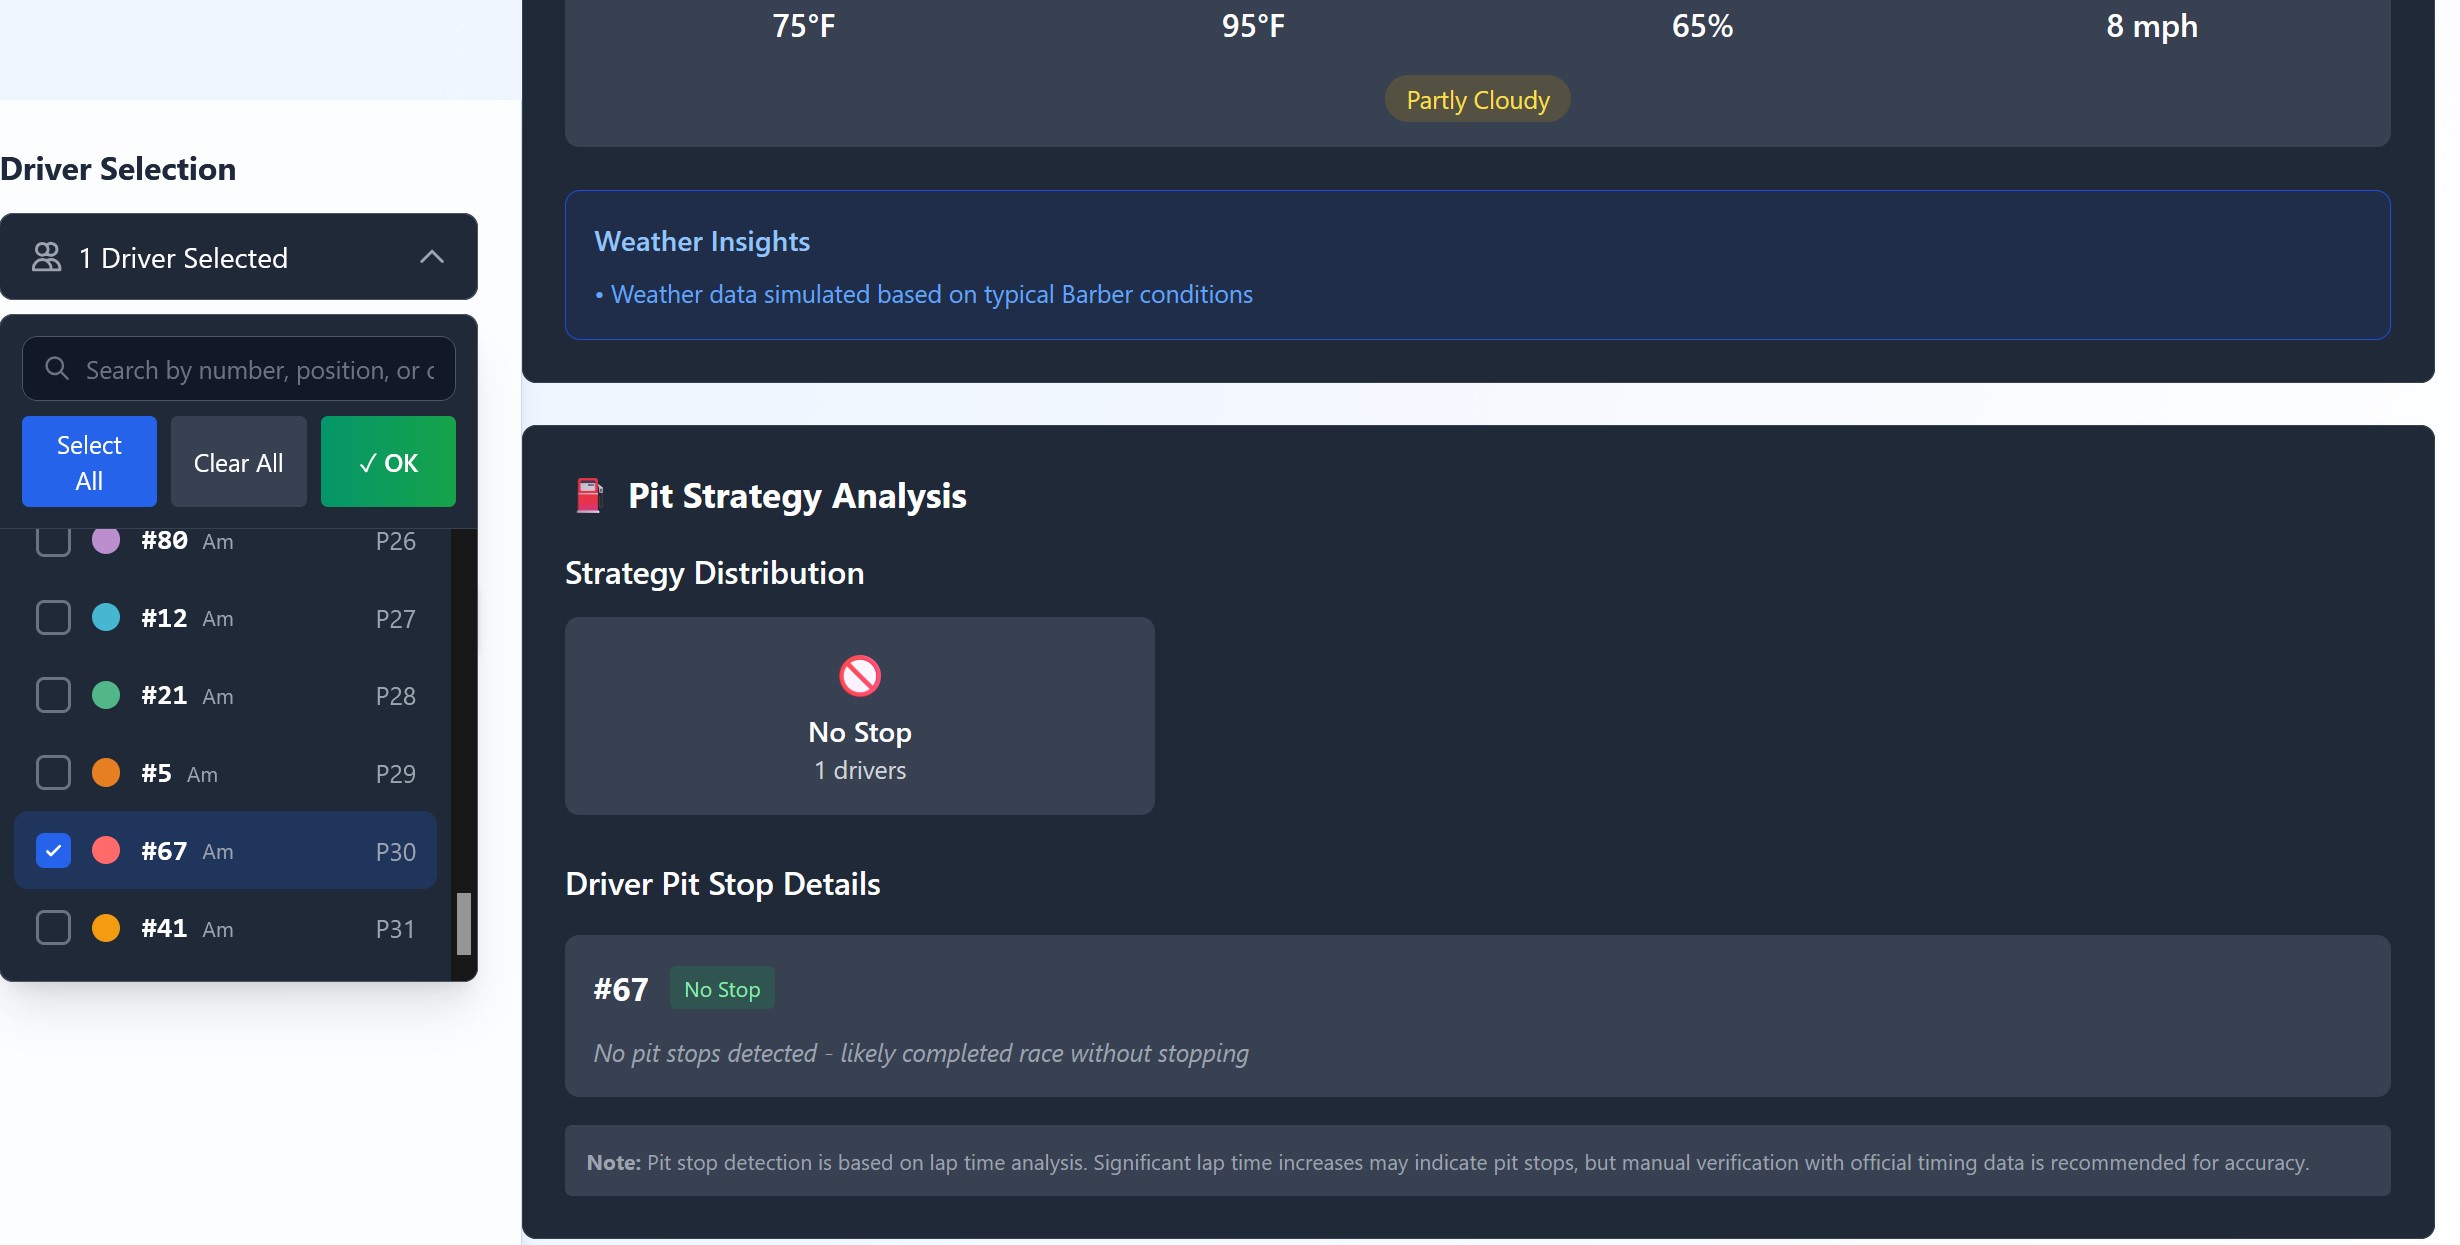
- Provides real-time analytics including consistency scores, pace trends, sector strengths, and tire degradation forecasts
- Delivers strategic recommendations for pit stop timing, tire management, and race strategy optimization
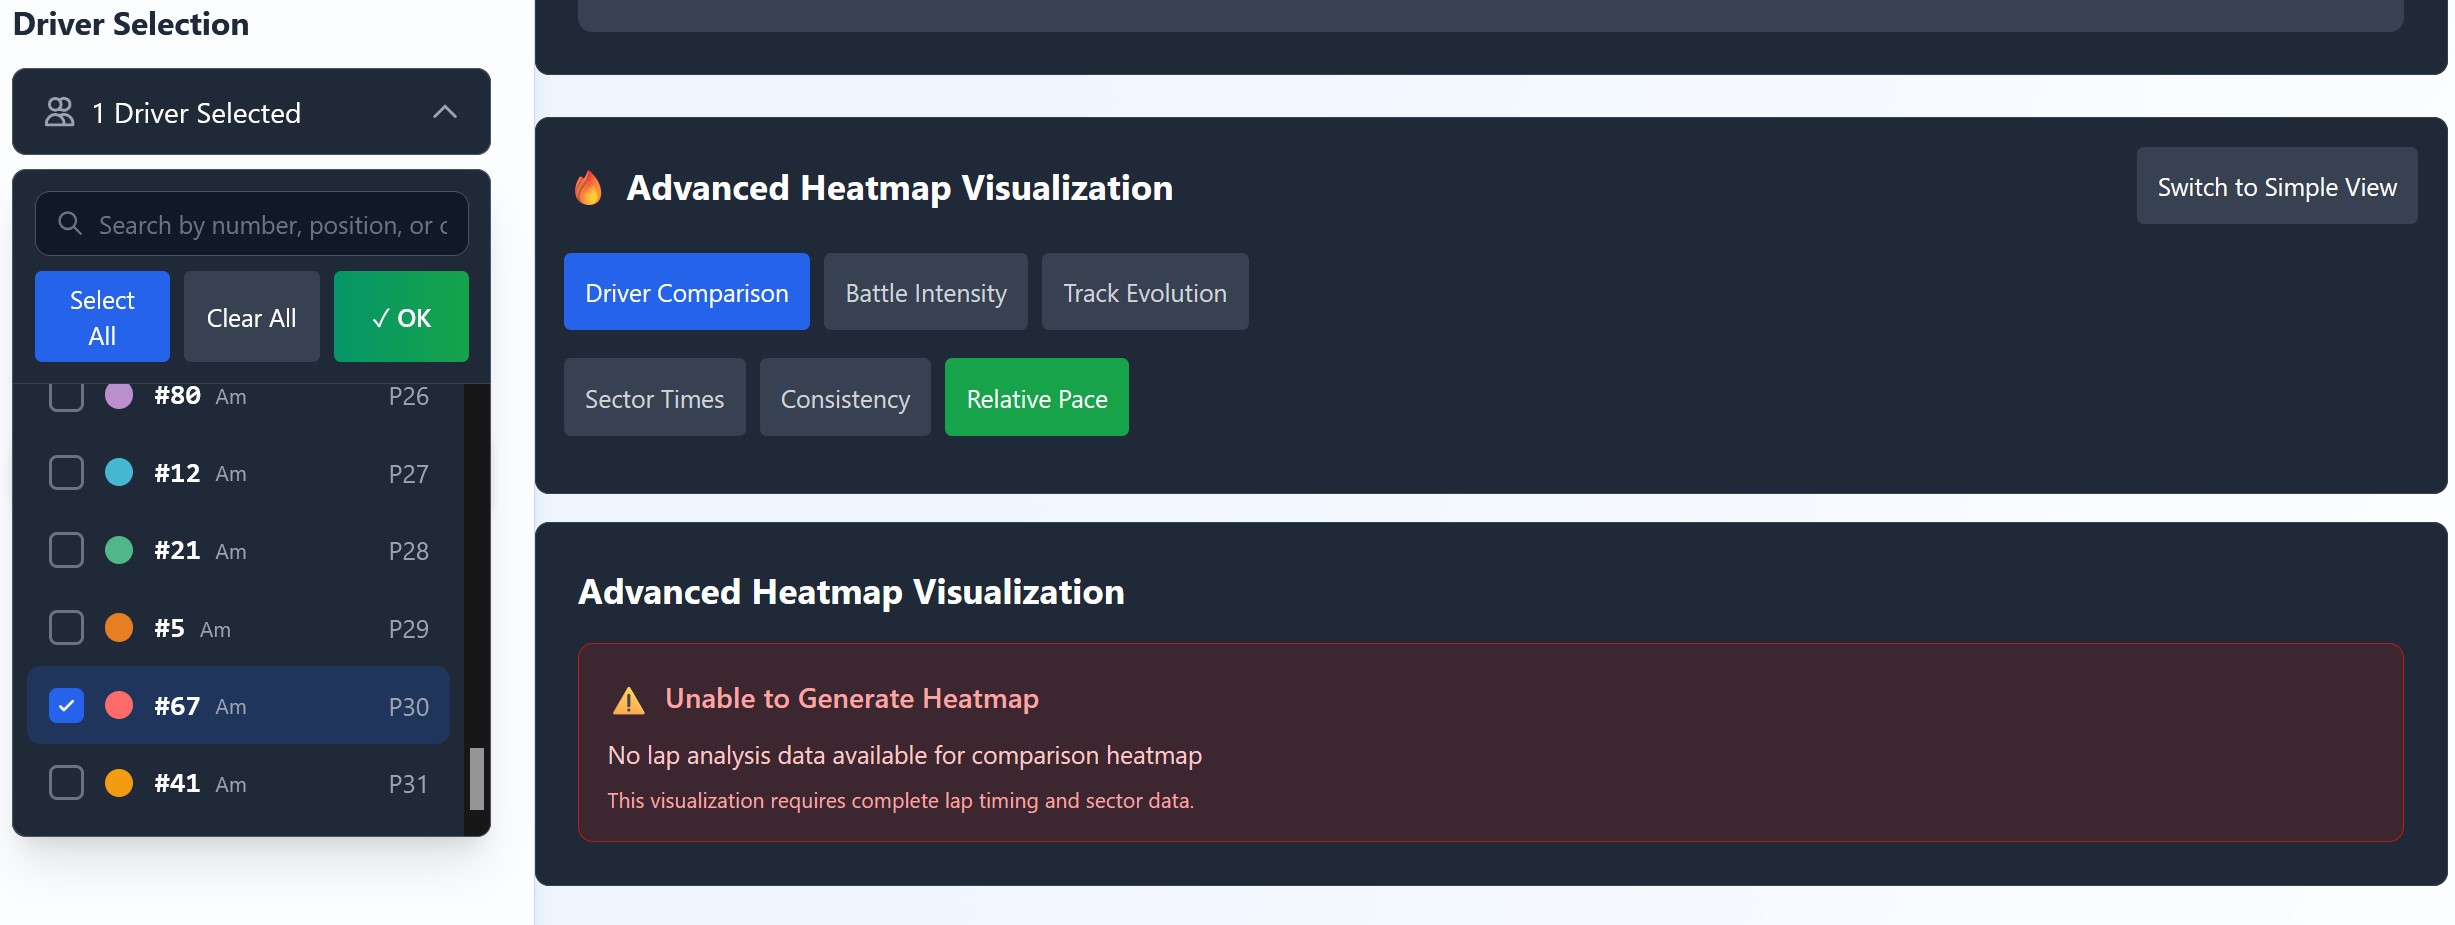
The platform processes CSV telemetry data and presents it through an intuitive dashboard with interactive visualizations, making complex race data accessible to drivers, engineers, and team strategists.
How We Built It
Technology Stack:
- Frontend: React 18 + TypeScript for type-safe, component-based UI
- Visualization: Three.js for 3D track rendering, Recharts for data charts, D3.js for statistical processing
- Build System: Vite for fast development and optimized production builds
- Styling: Tailwind CSS for responsive, modern UI design
- Data Processing: Custom analytics engine with statistical algorithms (linear regression, z-score analysis, coefficient of variation)
Architecture:
- Data Layer: CSV parsing and validation with Apache Arrow for efficient data handling
- Analytics Engine: Rule-based AI system using statistical methods to generate insights
- Visualization Layer: Interactive 3D track models with realistic lighting and geometry
- UI Components: Modular React components for dashboards, charts, and controls
Key Features Implemented:
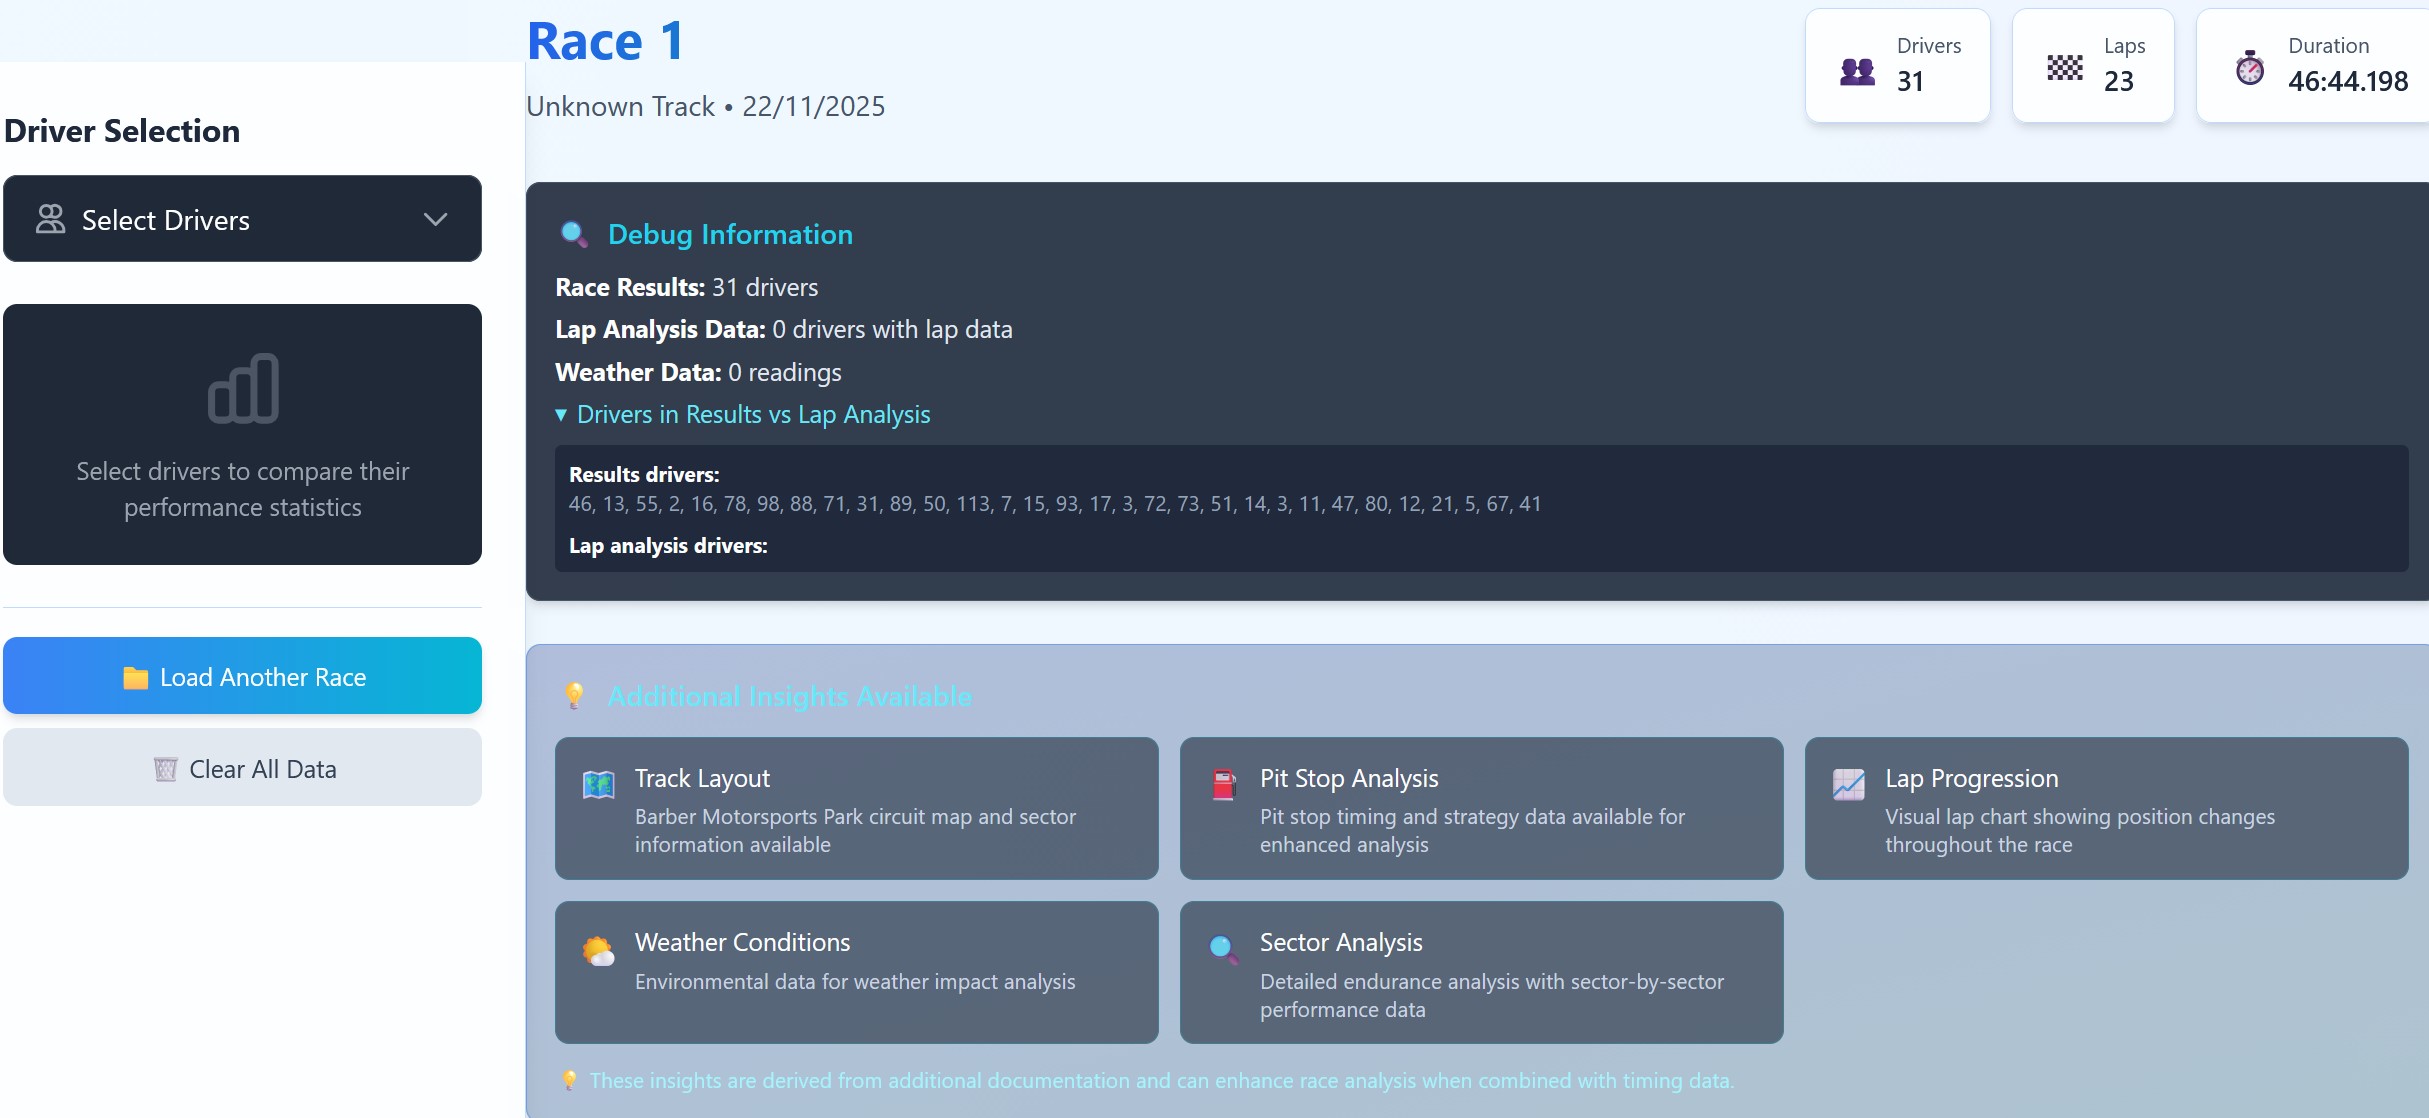
- Multi-track support with auto-detection from race metadata
- Real-time performance metrics (lap times, sector times, consistency scores)
- AI insights categorized by performance, strategy, incidents, and predictions
- 3D track visualization with multiple camera modes and quality settings
- Track geometry extraction from circuit map PDFs
Challenges We Ran Into
1. JSON Parsing Corruption The most persistent challenge was IDE autoformatting corrupting JSON track geometry files. After multiple attempts to fix individual files, we implemented a lasting solution by converting all track data from JSON to TypeScript modules, eliminating the parsing errors entirely.
2. Track Geometry Complexity Accurately representing real-world track layouts in 3D required careful coordinate mapping, elevation profiling, and corner positioning. We developed a structured format that captures corner apex, entry, exit points, and sector boundaries while maintaining performance.
3. AI Insights Accuracy Balancing insight generation between being too noisy (too many alerts) and too quiet (missing important patterns) required careful threshold tuning. We implemented confidence scores and significance ratings to prioritize the most valuable insights.
4. Performance Optimization Rendering 3D tracks with real-time data updates while maintaining 60 FPS required optimization strategies including geometry caching, efficient data structures, and progressive loading.
5. Data Quality Handling Real-world telemetry data contains gaps, outliers, and inconsistencies. We built robust validation and error handling to gracefully degrade when data quality is poor while still providing useful insights. Hopefully, data in live environments will be much cleaner and well-formatted.
Accomplishments That We're Proud Of
1. Intelligent Analytics Without External AI We built a sophisticated "AI" insights engine using pure statistical methods—no external LLM or ML models required. The system generates human-readable insights through rule-based heuristics, linear regression, and anomaly detection, proving that smart algorithms can deliver AI-like value.
2. Multi-Track Support Successfully implemented geometry and visualization for four distinct tracks (Barber, Indianapolis, Sonoma, Virginia), each with unique characteristics, elevation changes, and corner configurations.
3. Real-Time 3D Visualization Created an interactive 3D track renderer with multiple camera modes, realistic lighting, and smooth performance, making complex spatial data intuitive and engaging.
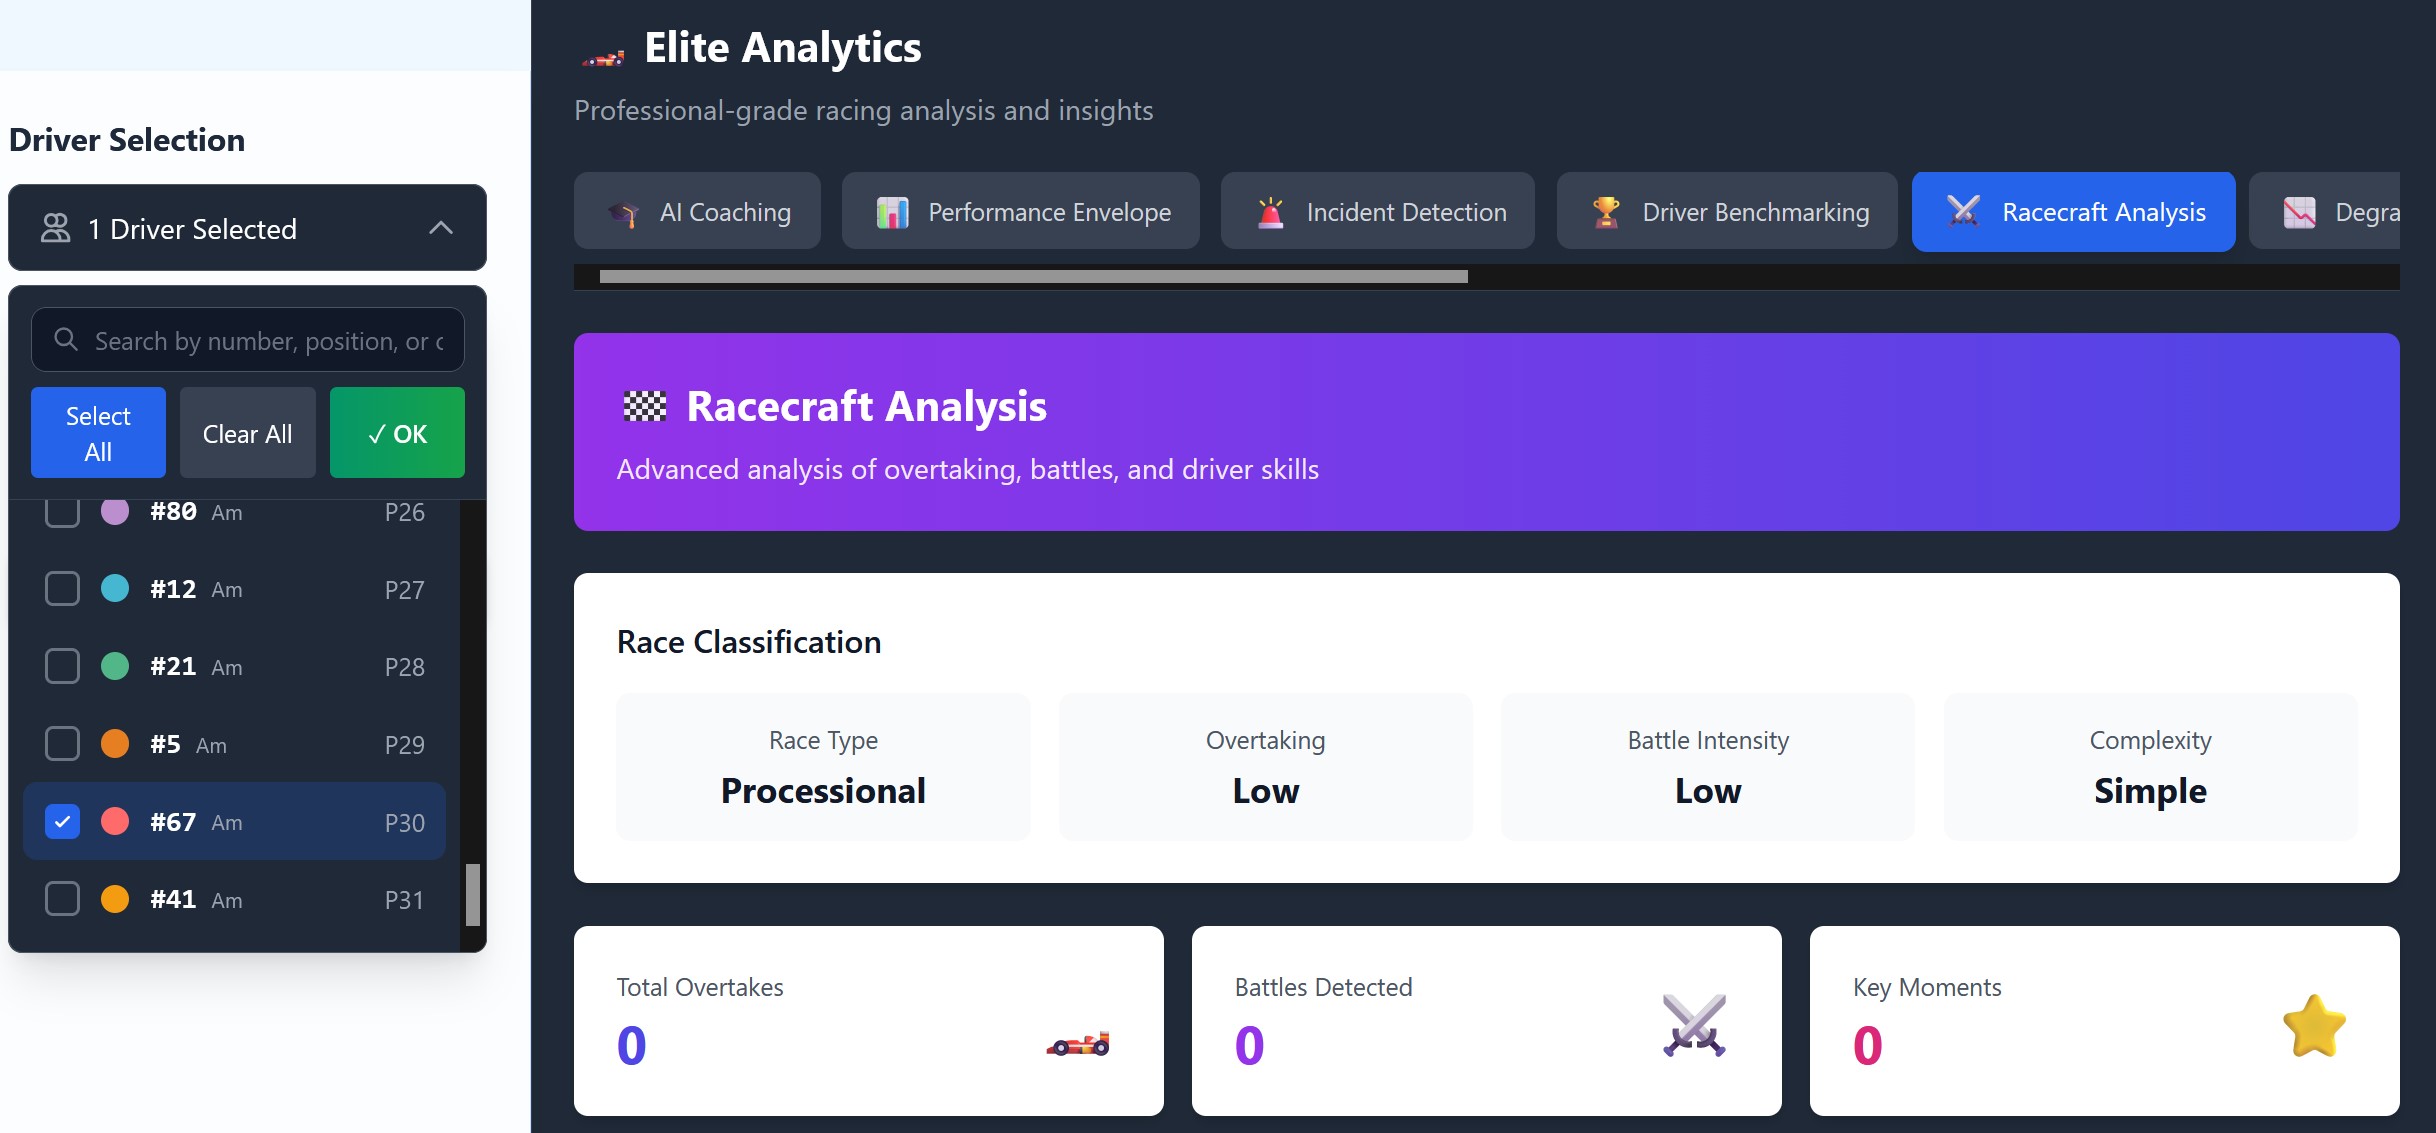
4. Comprehensive Insight Categories The platform generates insights across four key areas:
- Performance: Consistency analysis, pace trends, sector strengths
- Strategy: Pit stop timing, tire degradation, fuel management
- Incidents: Anomaly detection, sudden pace changes, outlier laps
- Predictions: Tire wear forecasts, position change likelihood, lap time trends
5. Type-Safe Architecture Built the entire platform with TypeScript, ensuring reliability and maintainability through compile-time type checking and excellent IDE support.
What We Learned
1. Domain Knowledge is Critical Understanding motorsport terminology, race strategy, and driver behavior was essential to building meaningful analytics. Data analysis skills alone weren't enough—we needed to think like a race engineer.
2. Statistical Methods Are Powerful Simple statistical techniques (mean, standard deviation, linear regression, z-scores) can generate sophisticated insights when applied thoughtfully. You don't always need complex ML models.
3. Data Visualization Matters The same data can tell completely different stories depending on how it's visualized. 3D track views, lap time charts, and sector comparisons each reveal unique insights.
4. User Experience in Analytics Analytics tools must balance depth with accessibility. We learned to present complex data in layers—high-level insights for quick decisions, detailed metrics for deep analysis.
5. Resilient Architecture Building systems that gracefully handle missing data, corrupted files, and edge cases is more important than perfect-case performance. Real-world data is messy.
What's Next for BluChips Racing
Short-Term Enhancements:
- Live Race Integration: Real-time telemetry streaming during races for live strategy decisions
- Driver Comparison Tools: Head-to-head performance analysis across multiple races
- Weather Integration: Correlate performance with track temperature, humidity, and conditions
- Predictive Pit Strategy: ML models trained on historical data to optimize pit stop windows
Medium-Term Goals:
- Mobile App: iOS/Android apps for trackside access to analytics
- Team Collaboration: Multi-user features for engineers, drivers, and strategists to share insights
- Video Integration: Sync telemetry with onboard camera footage for visual analysis
- Custom Alerts: Configurable notifications for specific performance thresholds
Long-Term Vision:
- Machine Learning Models: Train neural networks on historical race data for advanced predictions
- Automated Setup Recommendations: AI-driven car setup suggestions based on track conditions
- Multi-Series Support: Expand beyond GR Cup to other racing series (F1, IndyCar, NASCAR)
- Competitive Intelligence: Analyze competitor performance patterns and strategies
- Driver Training Platform: Use analytics to identify improvement areas and track progress
Technical Roadmap:
- Implement property-based testing for critical analytics algorithms
- Add WebGL optimizations for smoother 3D rendering on lower-end devices
- Build data pipeline for automated telemetry ingestion from race systems
- Create API for third-party integrations and custom analytics tools
BluChips Racing represents the intersection of data science and motorsport—where milliseconds matter and insights drive victory. We're just getting started.


Log in or sign up for Devpost to join the conversation.