How I Built Bloomie
The basic idea
I started with the garden concept first.
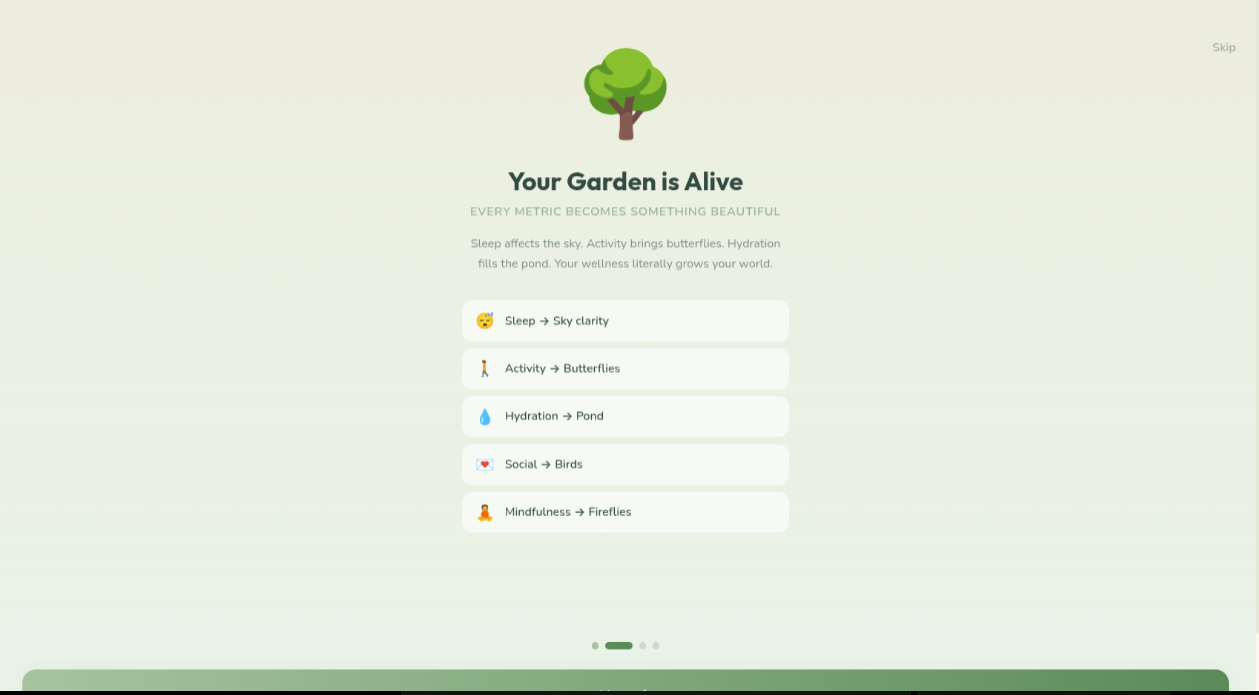
So I mapped each type of data to something inside the garden.
Sleep changes the sky.
Steps bring butterflies.
Hydration fills the pond.
Recovery grows the trees.
Social connection brings birds.
Mindfulness grows fireflies.
Consistency affects the main tree.
The mapping became the base for the rest of the design.
If I added a new health signal, I could think about what it should change in the environment.
Designing the garden
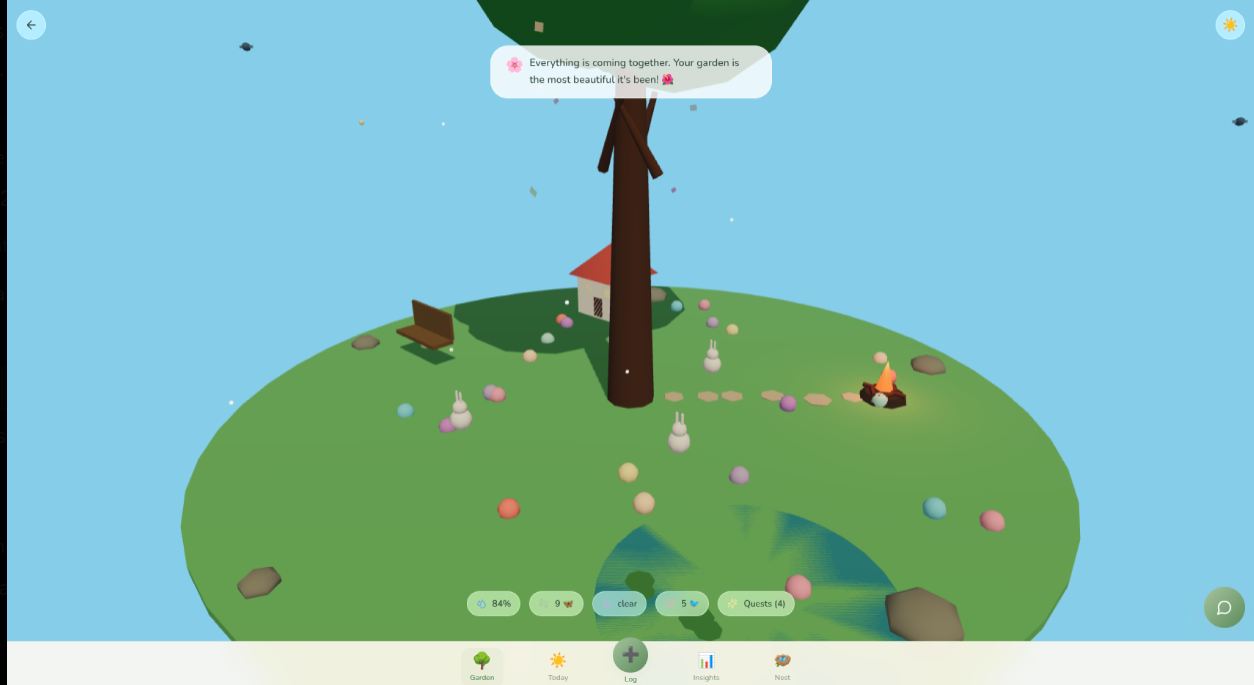
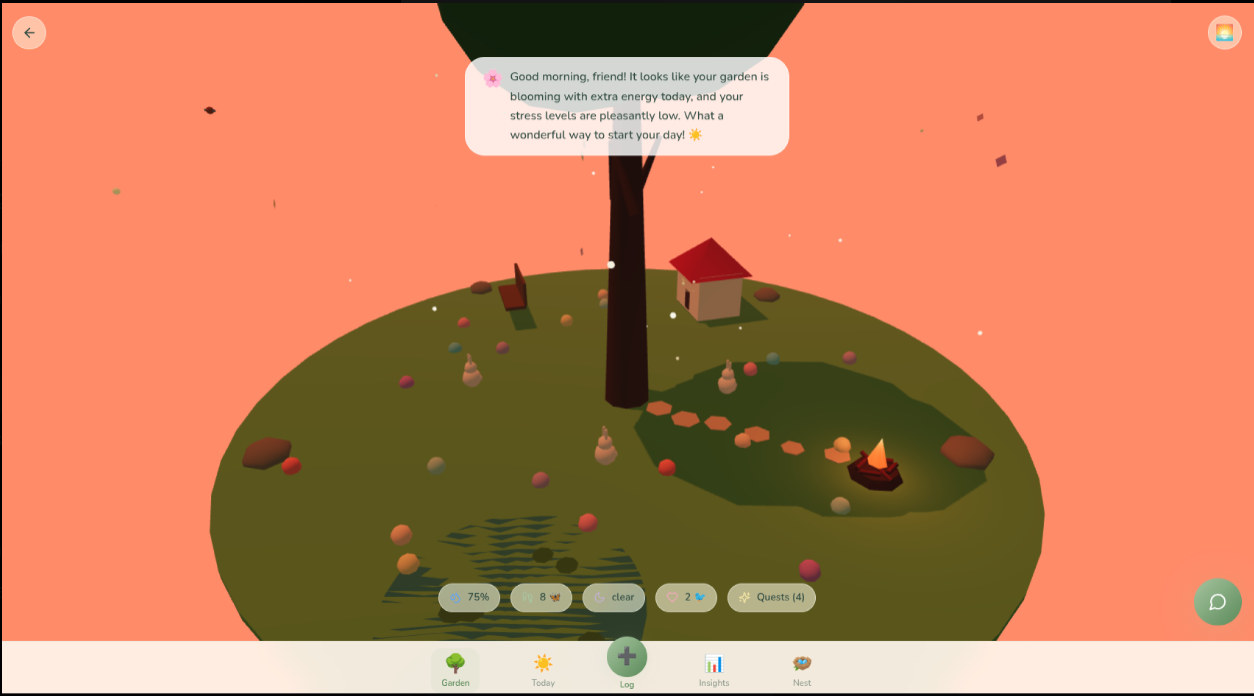
The garden is a floating island built with Three.js.
I used raw Three.js instead of React Three Fiber because I wanted direct control over the scene and individual objects.
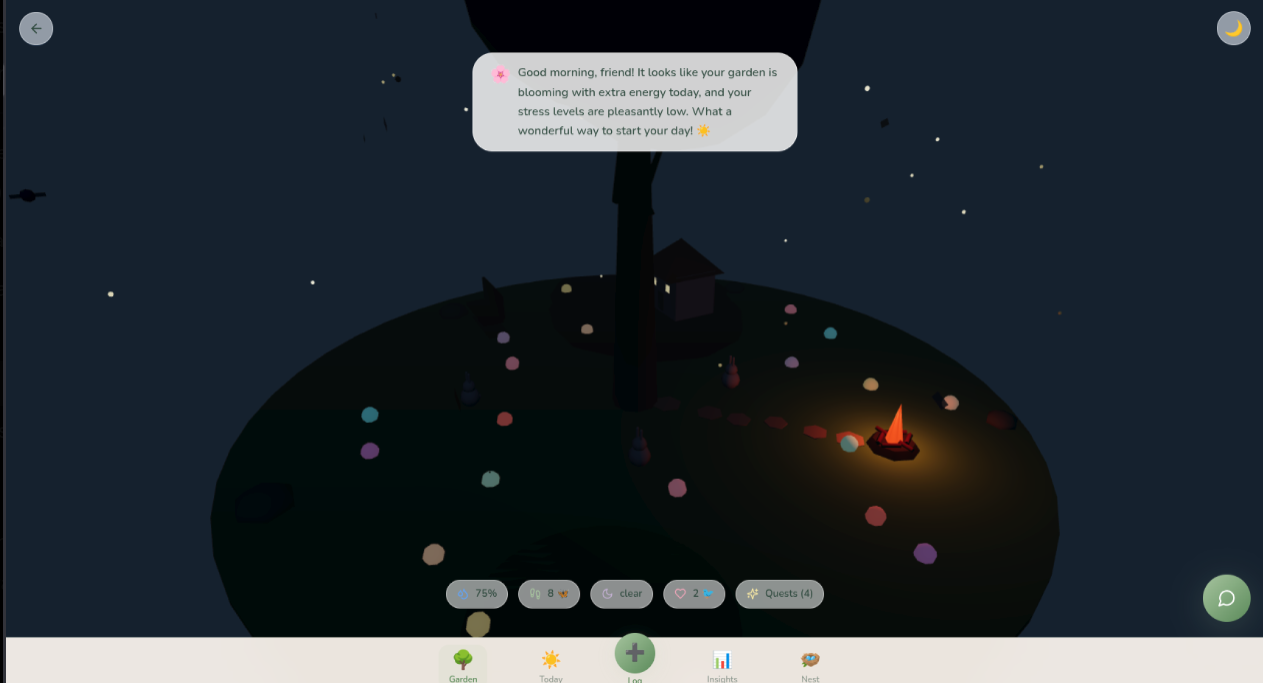
There are different states for daytime, sunset, and night.
The cottage windows glow at night.
The campfire has animated lighting.
The pond moves.
The rabbits move around the island.
The sky changes based on sleep data.
These details are not required for tracking health data. They make the environment feel continuous.
The user is not just looking at a dashboard.
They are returning to the same world.
One important design rule
The garden never dies.
If someone's data gets worse, I don't remove all their progress.
The sky can become cloudy.
The weather can change.
But the garden still has flowers, water, trees, and life.
I made this rule early because I did not want the visualization itself to create pressure.
A bad day should change the garden, not destroy it.
Visual design
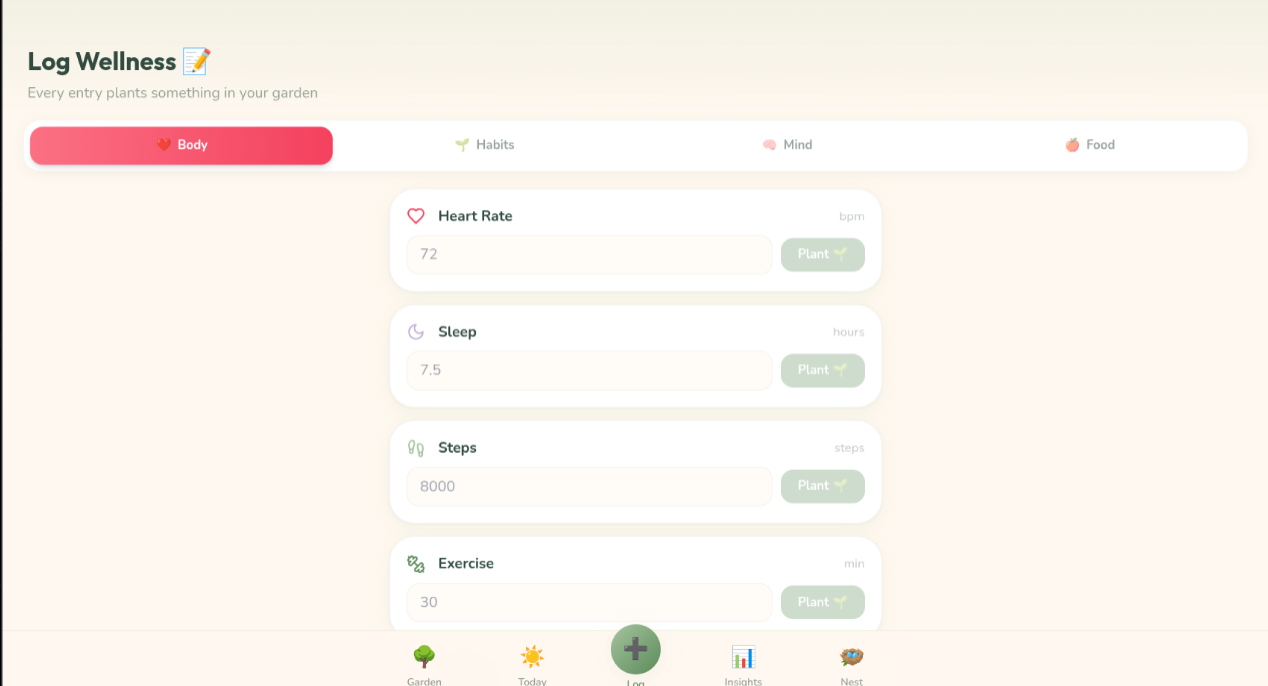
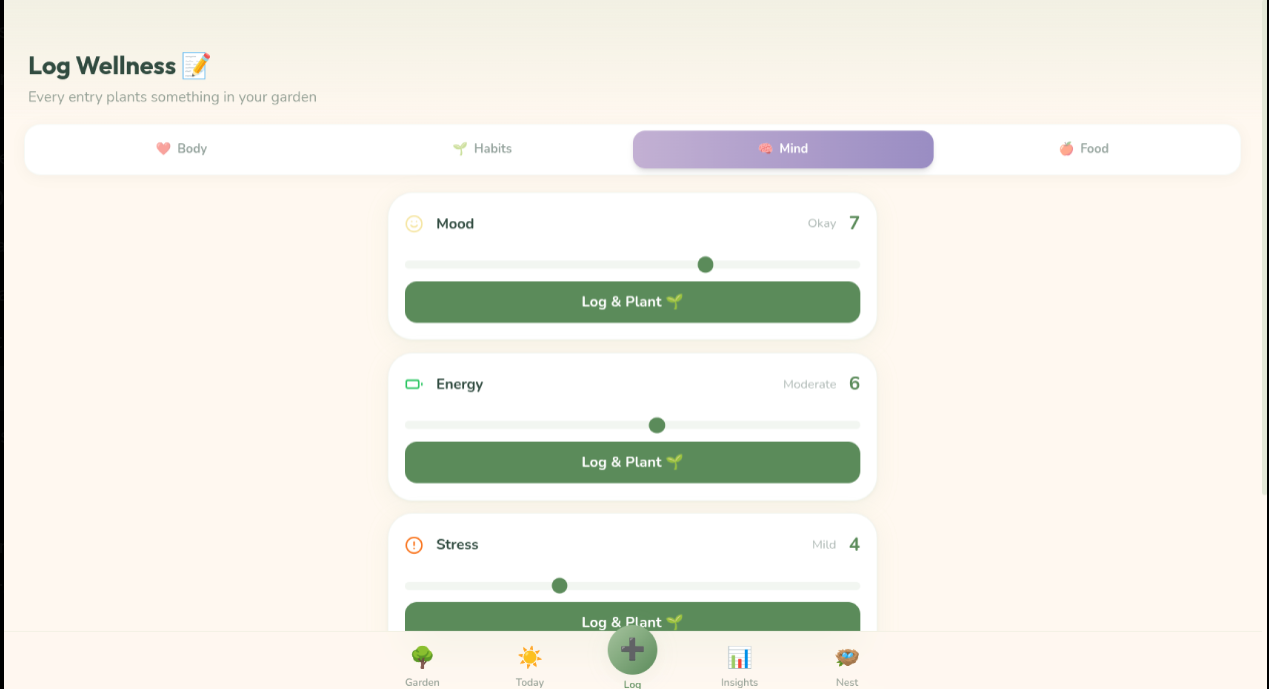
I used a soft visual system throughout the app.
The main colors are cream, sage, lavender, sky blue, peach, and warm yellow.
Cards have large rounded corners.
I used soft shadows and glassmorphism in places where the 3D scene can show through.
For typography, I used Nunito for body text and Outfit for display text.
I also kept the touch targets fairly large.
There are not many tiny controls.
The garden already has a lot of visual information, so the rest of the interface stays fairly simple.
Frontend
I used Next.js 15, React 19, TypeScript, Tailwind CSS, Framer Motion, and Three.js.
Next.js handles the application structure.
Tailwind handles most of the styling.
Framer Motion handles UI transitions and smaller animations.
Three.js handles the actual 3D environment.
The frontend has 17 routes covering the garden, daily dashboard, check-ins, breathing, insights, social features, progression, clinical views, and privacy.
Backend
The backend uses FastAPI.
Supabase handles PostgreSQL and authentication.
I separated the backend into different routers instead of putting everything into one large API.
There are separate areas for wellness data, insights, chat, quests, weather, calendar, nutrition, caffeine, Spotify, ecosystem progression, clinical data, social features, and privacy.
This also made it easier to work on features independently.
The AI pipeline
The AI pipeline is one of the parts I structured most carefully.
I did not send raw health data directly to an LLM and let it make decisions.
The pipeline is:
Raw data
   ↓
Normalize data
   ↓
Compute personal baseline
   ↓
Detect deviations
   ↓
Assess risk
   ↓
Generate narrative
I built this with LangGraph.
The application handles the data processing and risk logic.
The LLM comes at the end.
Its job is to turn the processed result into a readable explanation.
It does not make the underlying health decision.
Personal baselines
Bloomie uses the user's own history.
I did not want every user compared against the same population average.
The system uses a 7-day rolling window to calculate personal baselines.
Then it uses z-scores to detect deviations.
For example, if someone's normal resting heart rate is around 62 to 68 and it reaches 77, Bloomie can notice the change.
It does not turn that into a diagnosis.
It simply identifies the deviation and sends it through the risk logic.
The "Why?" button
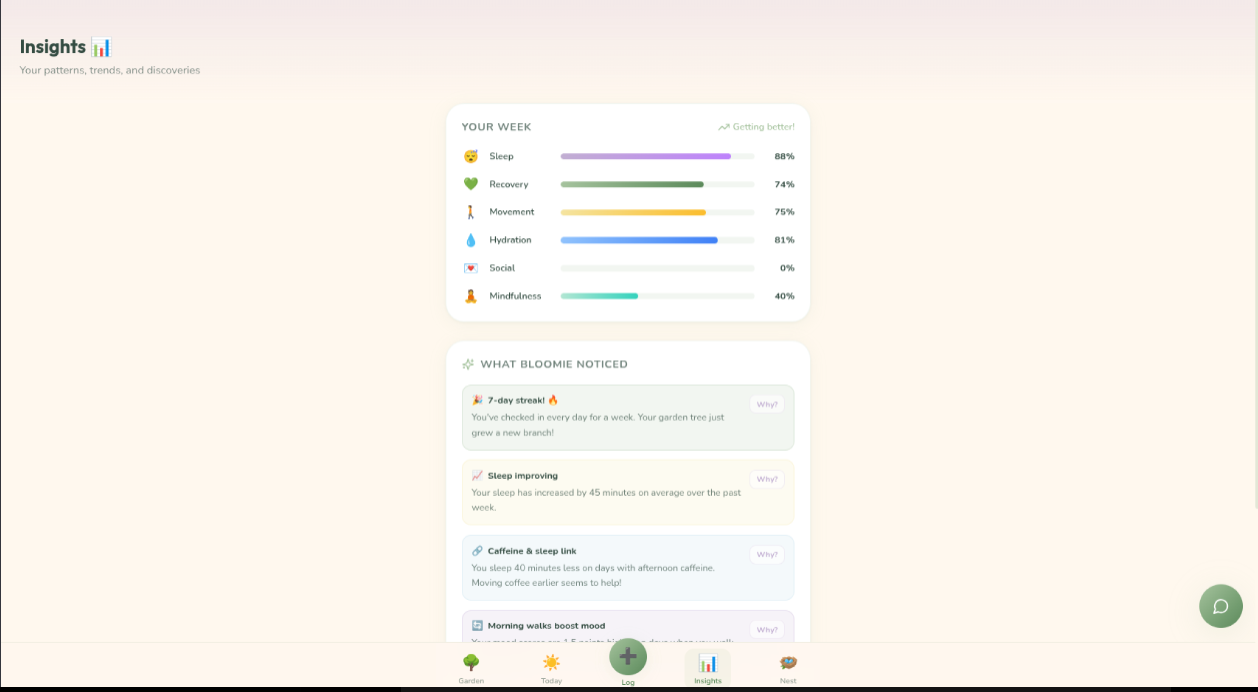
I added a Why? interaction to observations.
The user can see what changed and which data contributed to the observation.
This is also where Bloomie explains its limits.
It can explain a change in the user's data.
It cannot determine the medical cause of that change.
I also found this useful while testing because I could see whether an insight was actually using the expected data.
Voice check-ins
The check-in system supports voice input.
A user can say something like:
"I slept 6 hours and had too much coffee and I'm feeling stressed."
The system extracts structured information from the sentence.
For example:
sleep_hours: 6
caffeine_mg: 190
stress: 7
That data is then stored and used by the wellness pipeline.
The interaction is much faster than manually entering every field.
Wellness score
I built a wellness score from several areas.
Sleep is 25%.
Activity is 20%.
Hydration is 15%.
Mood is 15%.
Consistency is 15%.
Recovery is 10%.
The result is a score out of 100.
I kept the score as one part of the interface instead of making it control the entire garden.
A lower score does not destroy the user's progress.
Chronotype
Bloomie looks at sleep timing patterns to estimate a chronotype using the Lion, Wolf, Bear, and Dolphin model.
It then uses that information for timing suggestions.
For example, it can suggest periods for exercise, focus, or winding down based on the user's observed schedule.
The recommendations are based on the user's own pattern rather than one fixed schedule.
Social jet lag
I also added social jet lag.
Bloomie compares weekday and weekend sleep timing.
The difference is calculated automatically and becomes part of the user's insights.
This is another example of the system looking for relationships between different parts of the user's data.
Quests
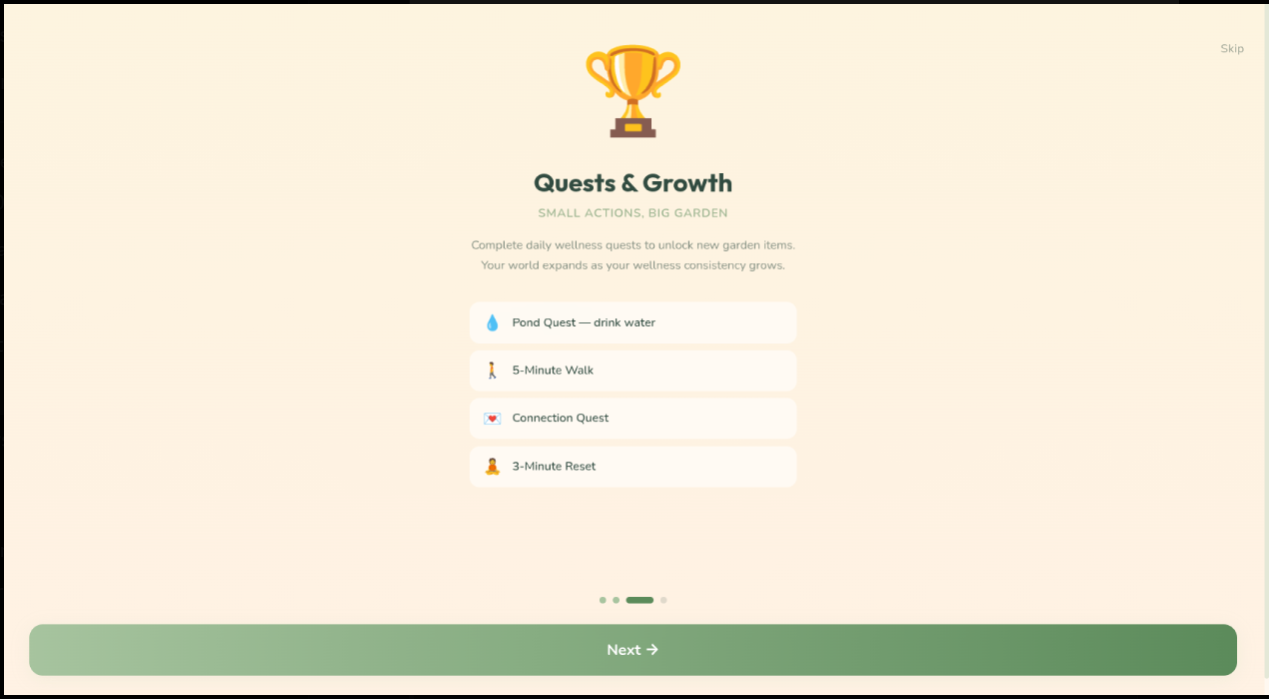
I used quests for the main gamification system.
Drinking water can unlock a water lily.
Walking can add butterflies.
A breathing session can add fireflies.
Sleep can unlock night-related garden elements.
There are eight ecosystem levels.
The progression happens inside the garden instead of being shown only as a level number.
I also kept streaks as a separate feature.
Milestones happen at 3, 7, 14, 21, 30, 60, and 100 days.
Kindness Bingo
Kindness Bingo is a 5x5 grid of small acts of kindness.
The system detects when the user completes a line.
It is a much simpler feature than the health processing underneath Bloomie, but it gives the wellness system something social and playful.
Breathing experience
The breathing page has a separate visual style.
It uses a dark background, ambient particles, and a large expanding and contracting circle.
There are four breathing patterns:
- 4-7-8 Calm
- Box Breathing
- Quick Calm
- Energy Boost
Completing an exercise adds fireflies to the garden.
Weather integration
I connected Bloomie to OpenWeatherMap.
Weather affects the garden as well as some recommendations.
For example, hot weather can lower the pond level and lead to a hydration suggestion.
I used the weather as part of the environment instead of showing it as another isolated data card.
Calendar awareness
Bloomie can read calendar data and look for open spaces between meetings.
The interaction is different from a normal reminder.
Instead of telling someone to find 30 minutes for exercise, Bloomie can find smaller gaps in their actual schedule.
This makes the recommendation depend on the user's day.
Social wellness
The Nest feature handles social connections.
Users can add people they care about.
Bloomie can suggest checking in when there has been a long gap.
Connecting with someone can also add birds to the garden.
There is a family dashboard too.
Family members can see a high-level status without automatically getting access to everything.
Clinical dashboard
I added a separate clinical dashboard for professional use.
It includes a patient timeline, baseline-based anomaly detection, and AI-generated summaries.
I kept this separate from the normal user interface because a clinician needs different information from a person checking their own garden.
Privacy
Bloomie handles health information, so I added granular sharing controls.
The user can decide what different audiences can access.
There is also an audit log and data deletion support.
The idea is to make sharing explicit instead of giving every connected person access to the same information.
AI safety
The AI companion has several safety layers.
The first is crisis detection using pattern matching.
The second detects negative self-talk.
The third is the system prompt that controls how the AI responds.
The AI is instructed not to diagnose.
It should not validate harm.
It should not agree with harsh self-criticism.
The crisis detection also happens outside the normal LLM reasoning flow.
I tested the system with different negative and crisis-related messages to check that the responses stayed within those rules.
Testing the interactions
A lot of the testing was not about whether a button worked.
I also checked what happened after different types of data changed.
I checked how the garden reacted.
I checked whether the explanation matched the underlying data.
I checked whether a low metric created unnecessary pressure.
I checked whether the AI response sounded too generic.
This was especially important for the health insights because a technically correct response can still be a bad interaction.
What I left out
I deliberately avoided making every health change into an alert.
I also avoided making every missed habit reduce progress.
The garden does not reset because someone had a bad day.
Not every deviation is treated as a problem.
The system first looks for meaningful changes and then applies the risk rules.
That keeps the amount of feedback lower.
Deployment
The frontend runs on Vercel.
The backend runs on Railway.
Supabase handles the database.
The project is connected to GitHub for automatic deployment.
I kept the infrastructure simple so I could spend more time on the actual product.
Final structure
The final system has three main layers.
The frontend handles the garden and user interactions.
The backend handles health data, integrations, permissions, and application logic.
The AI pipeline handles the final explanations and conversational layer.
The garden is the visible part.
The personal baseline engine, risk rules, integrations, and safety system run underneath it.
That separation lets the interface stay simple while the system underneath can handle much more complex health data.
Built With
- fastapi
- framer
- langgraph
- next.js-15
- openrouter
- python
- react-19
- supabase
- three.js
- typescript


Log in or sign up for Devpost to join the conversation.