-
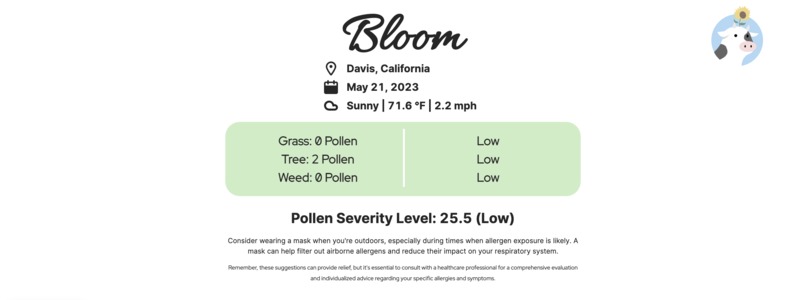
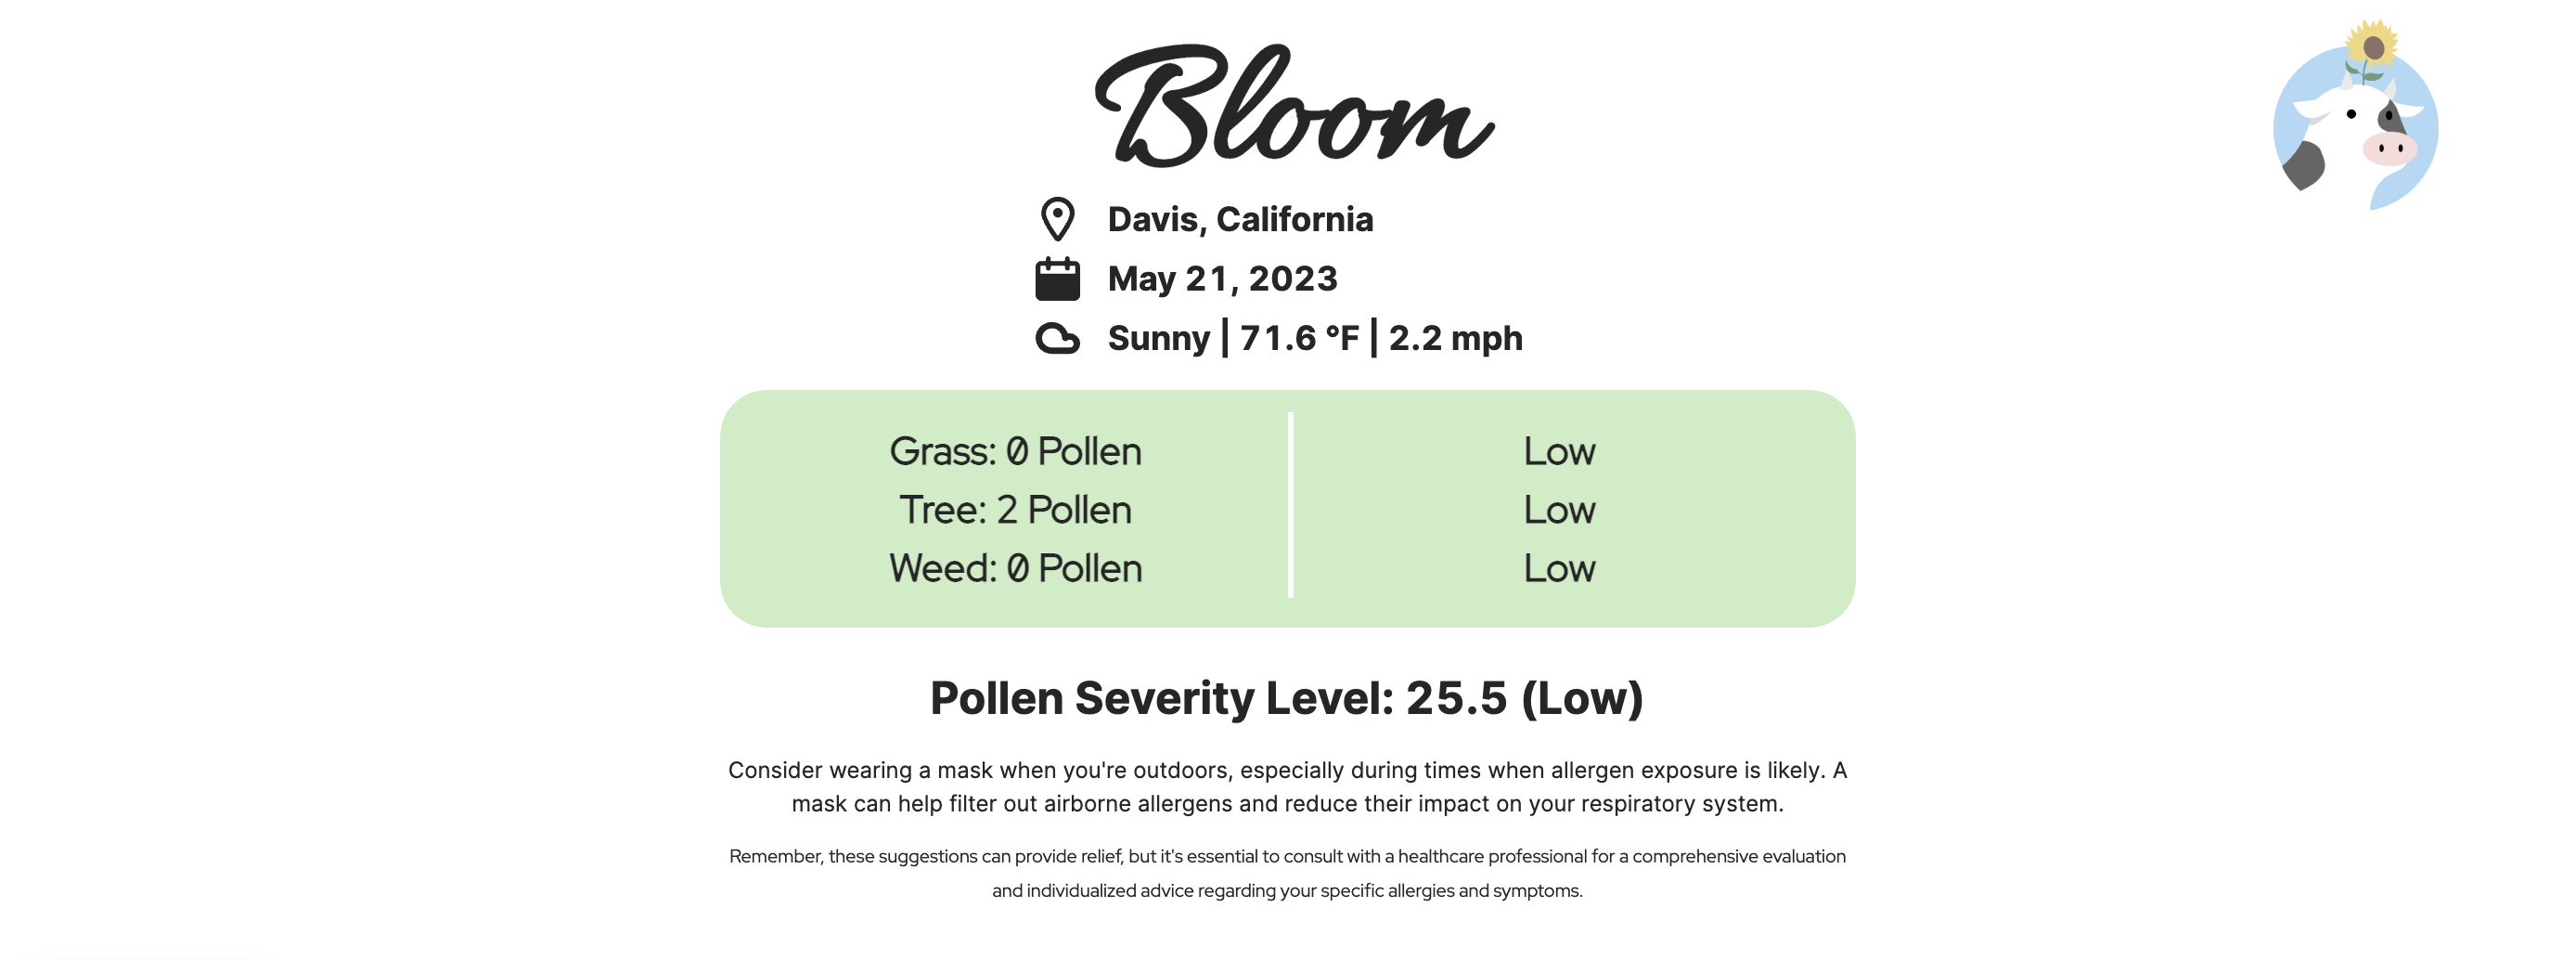
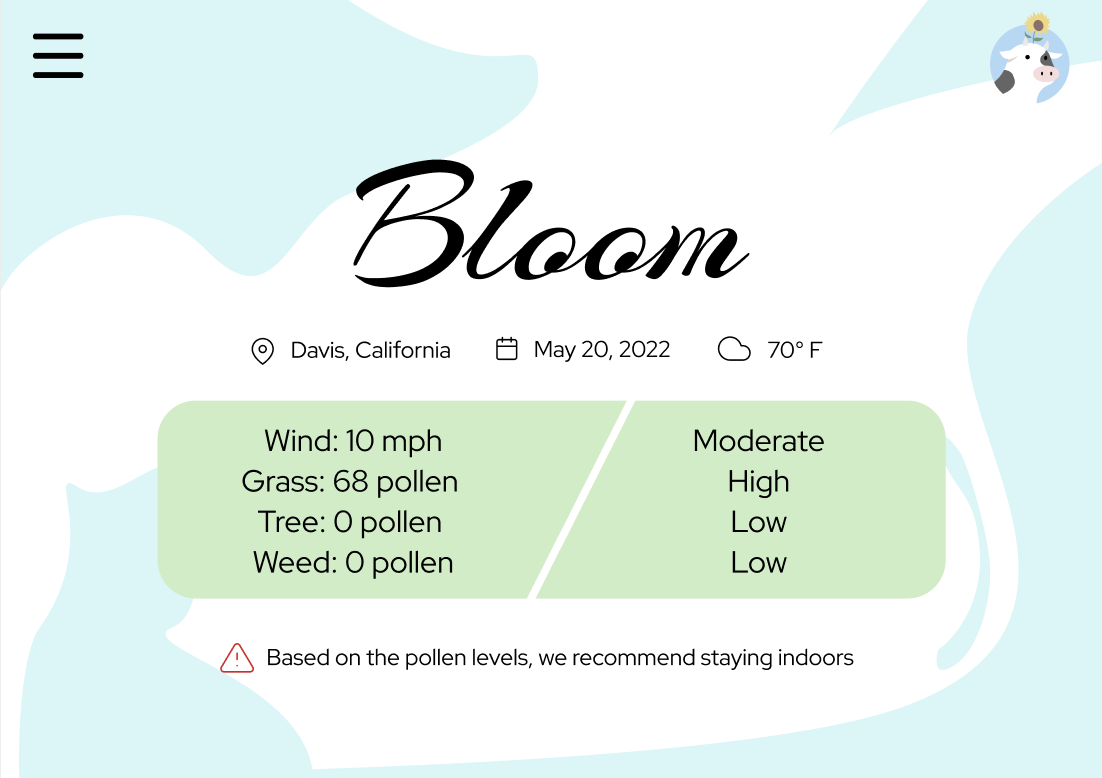
Pollen level dashboard
-
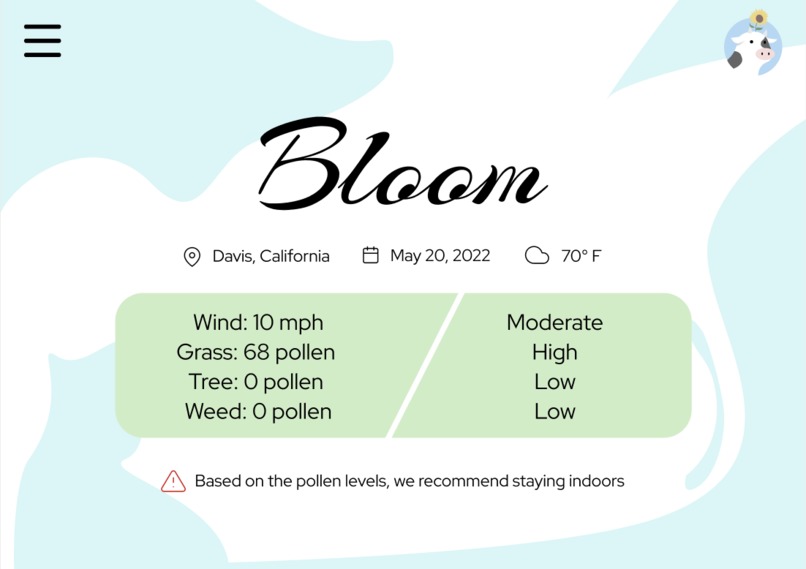
Proposed UI customization
-
Bloom logo
Inspiration
Allergies: a constant presence that affects every aspect of our lives. These past few months, they have reached new heights, fueled by a remarkable super bloom. The air, saturated with an abundance of pollen from an unusually wet rainy season, has left many battling heightened allergic reactions. But fear not, for we present to you Bloom—a web app designed to empower, inform, and bring relief to those in need.
What it does
Bloom is a web app that can be accessed by any browser. Based on the user’s current location, it uses a public API to get the live pollen levels in the air from grasses, trees, and weeds and displays it. It also draws from another API to display live weather conditions such as temperature and wind speed. From these factors, the severity of the allergies can be calculated.
Calculating Severity
For the algorithm and model behind determining the impact of allergies, we use five factors.
-Pollen Level -Wind Speed -Temperature -Weather Condition -Time of Day
Allergy symptoms would be heightened if pollen levels were high on hot, dry days with high wind speeds. Likewise, a cool, rainy night would have a lighter allergy impact. Thus, for each condition based on how severe it is, we assign base points. From there, the base points of each factor are multiplied by the weight for each factor. The weight is determined by how much the factor impacts allergy symptoms. For our ranking, pollen levels have the greatest impact on allergies, followed by wind speed, temperature, weather conditions, and lastly time of day. Once we multiply the base points by the weights, we add the score of each factor together to get a total, and from there, we classify it into one of three levels - low, moderate, and high - based on how large the number is.
Once the severity is calculated and classified, Bloom displays that information to the user and also cycles through a set of recommendations that the user can take to mitigate symptoms. Bloom refreshes every 5-10 seconds to give the user the most up-to-date information.
It displays the current pollen levels in the air coming from grass, trees, and weeds. It also displays normal weather features such as temperature, wind speed, and weather conditions. From the variable conditions, it calculates the severity of the average impact of allergies on people and displays a score and rating to the user. Along with this, it cycles through tips and recommended actions the user can do to mitigate allergy symptoms. This web app uses the user's current location and several APIs to pull information regarding pollen levels and weather conditions.
How we built it
We started brainstorming and prototyping on Figma. We each created a few user sketches and prototypes. Then we combined our ideas to formulate a final low-fi design. After this, we split into teams of developers and designers. The developers used Retool and JavaScript to develop the web application. Meanwhile, the designers continued to design the high-fi design and worked on the CSS.
You can view the prototypes here: https://www.figma.com/file/jdRLqtA0LRoWmiKPhla4it/HackDavis-2023?type=design&node-id=0%3A1&t=KgkmvcCMeZvmVAwA-1
Challenges we ran into
One of the major challenges we ran into was learning how to use Retool. We are not used to building web applications by dragging and dropping UI components. Some minor issues include figuring out how to change the font to the same one in order to make the overall design look better while utilizing Retool.
Accomplishments that we're proud of
We're proud to have finished within the limited amount of time and also laid out a foundational idea for a project we will continue to pursue. We managed to successfully implement the desired main features we wanted to include for the web application.
What we learned
Initially, we struggled to compromise on a design but we've learned to work together as a team and agree upon our differences. We divided the workload into the developer and designer teams, and each of us learned something new from the project.
What's next for Bloom
We hope to implement additional customization functions for users, such as changing the background or font style. We also wanted to implement charts to view weekly pollen levels and also add an option to view other cities to see their pollen levels. Here at Bloom, we want to make navigating allergy season as easy and seamless as possible.
Built With
- javascript
- pollenapi
- retool
- weatherapi


Log in or sign up for Devpost to join the conversation.