Inspiration
Every year, the US discards roughly 2.2 million units of donated blood not because people didn't donate, but because no one knew where it needed to go. A hospital running critically low on O- might have a facility 8 miles away sitting on 40 surplus units. There's no shared visibility, no early warning, and no coordination until it's too late. Most existing tools treat blood like static inventory. We built bloodBridge to treat it like what it actually is: a time-critical, perishable resource that needs to be in the right place before someone needs it, not after.
What it does
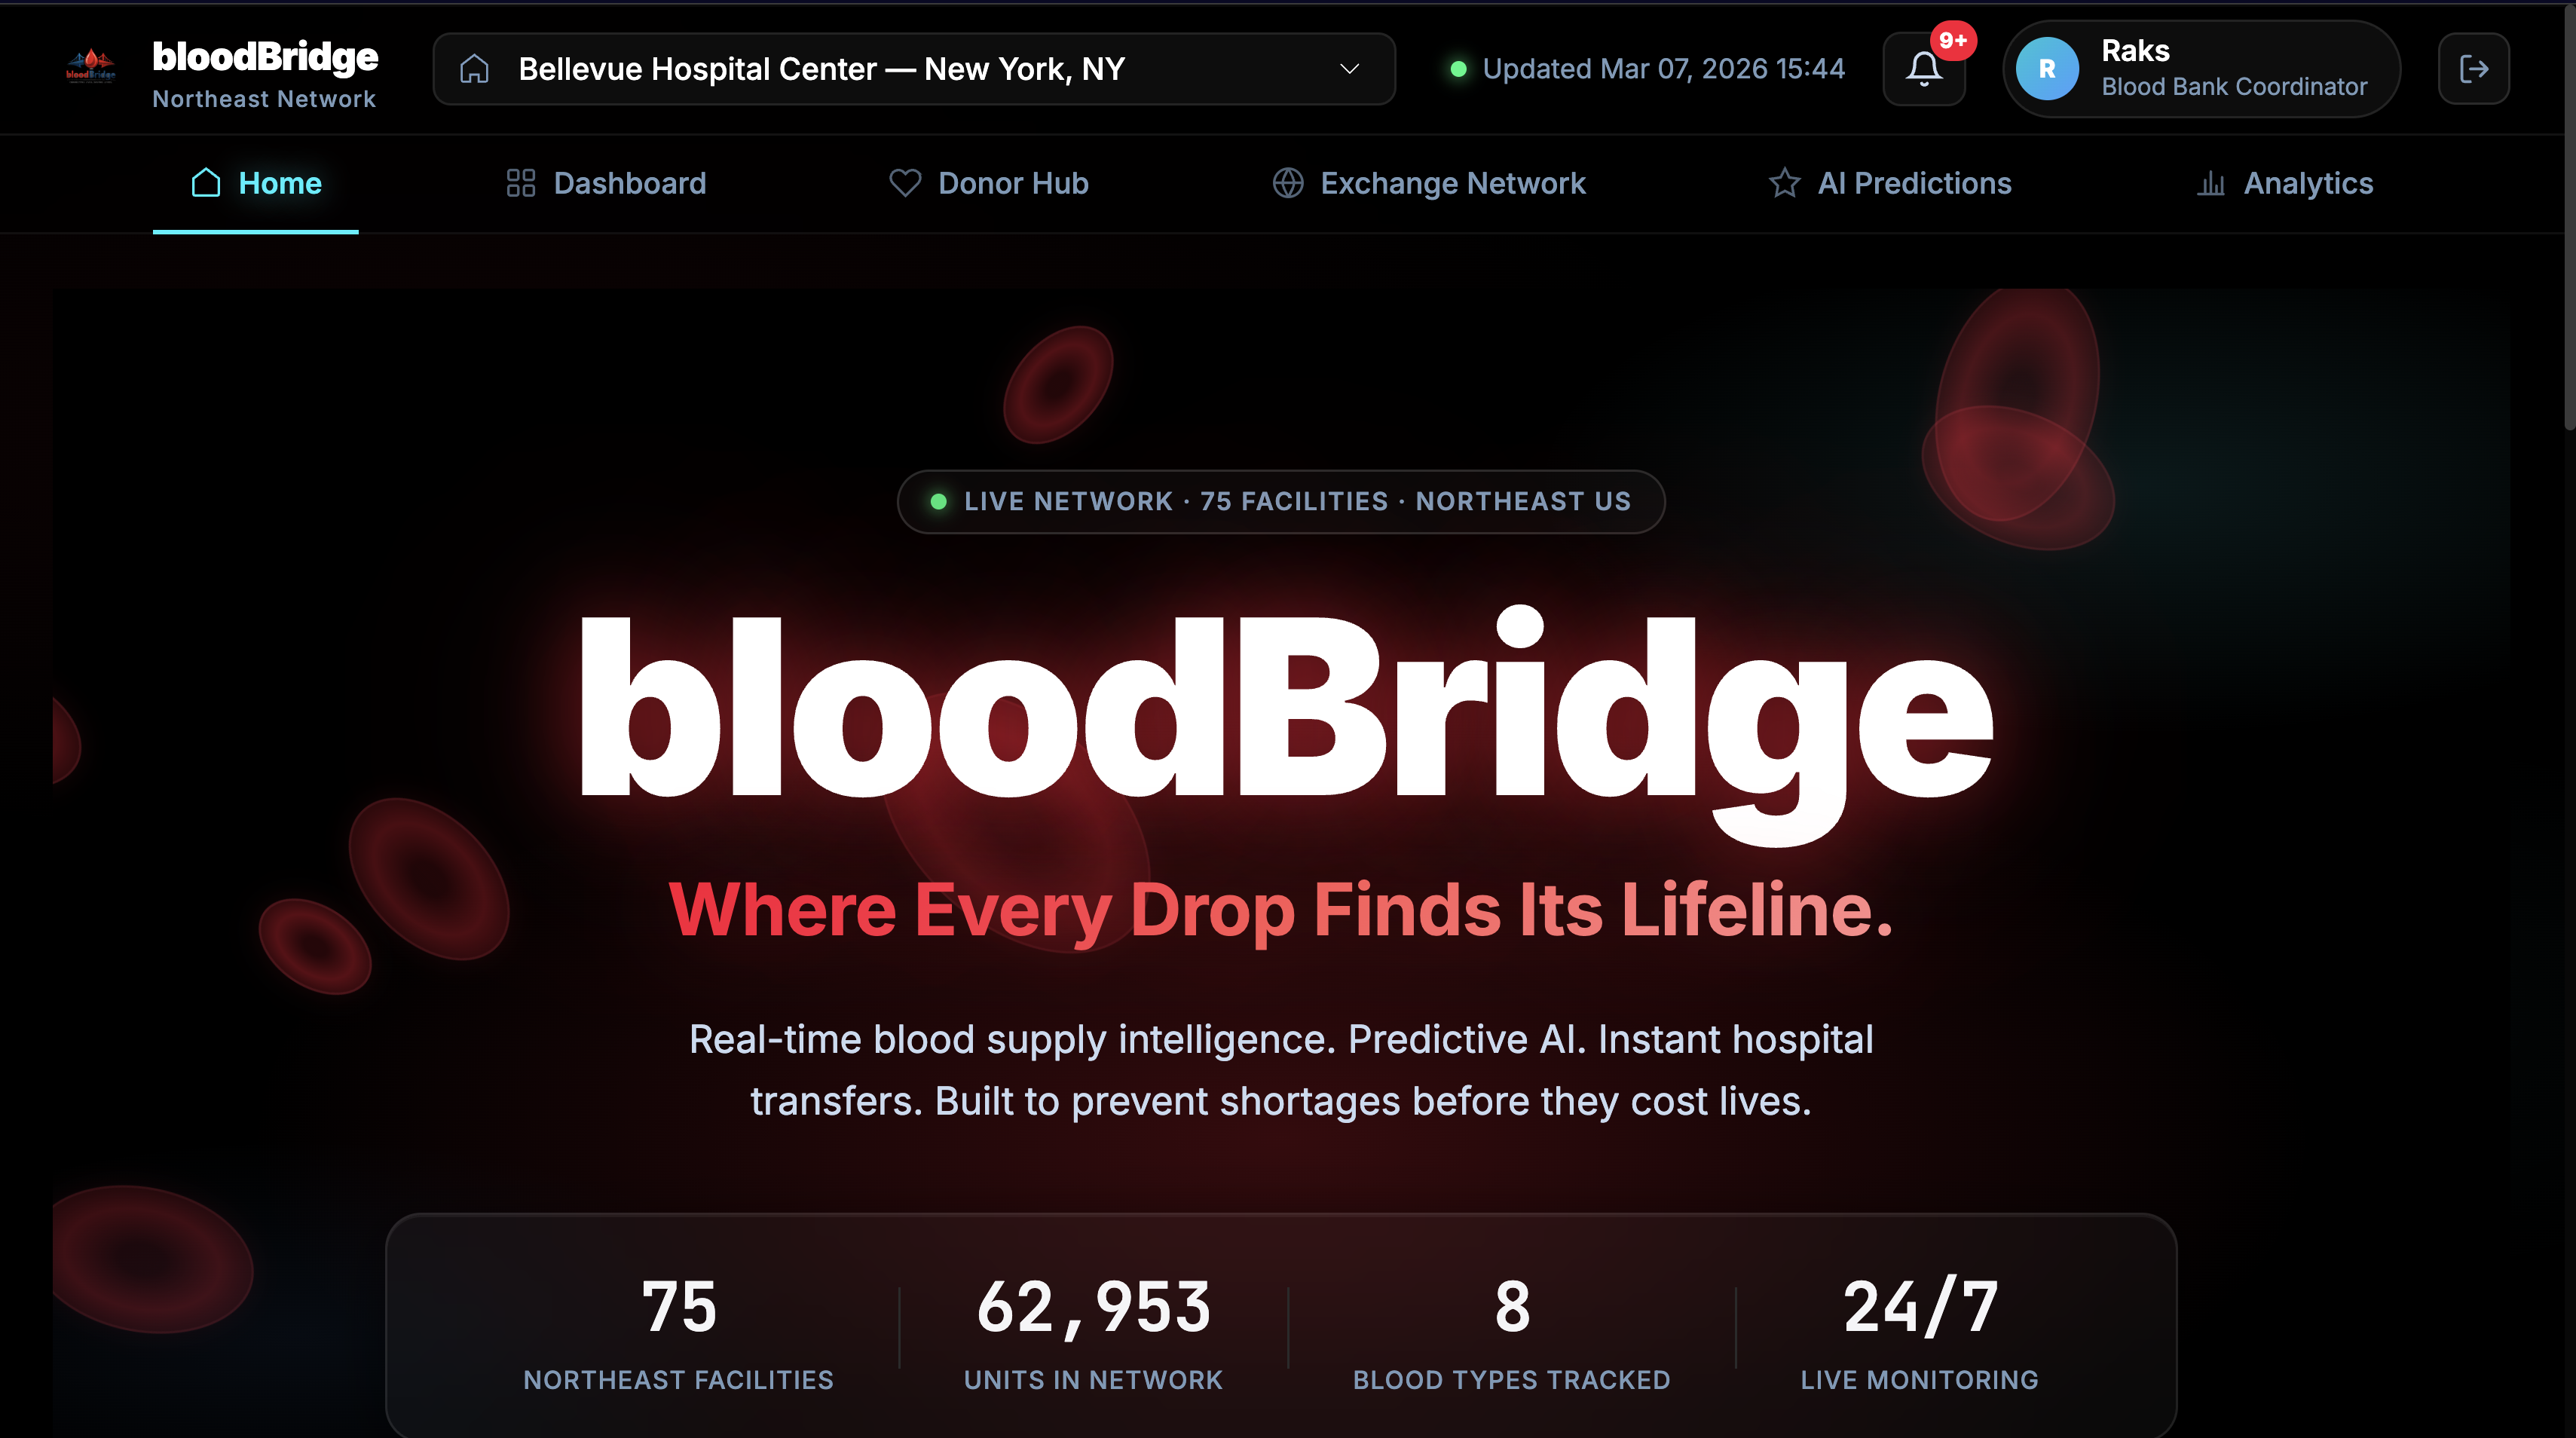
Most blood management tools are dashboards. They show you what you have. bloodBridge tells you what's going to run out, why, and what to do about it before the shortage happens. The core of the platform is a machine learning model that predicts 7-day shortage risk for every blood type at every hospital in the network. It doesn't just look at current stock, it factors in surgical schedules, trauma intake rates, expiry windows, historical demand, and seasonal patterns together. Our platform also includes a transfer layer. When the model flags a shortage, it immediately surfaces which nearby hospitals have surplus and can transfer. bloodBridge closes the loop from awareness to action in one platform.
How we built it
The backend is a Python Flask server with a Random Forest classifier trained at startup on hospital inventory data across 35 facilities in the Northeast US. Because our dataset only produces ~280 hospital-blood type pairs, too small for a Random Forest to generalize well, we augmented it with Gaussian noise copies of the training data to improve model robustness without fabricating labels. The frontend is a website with a live network map, real-time inventory views per hospital, an AI predictions tab with risk classifications and simple explanations, a donor routing feature, and a full analytics section.
Challenges we ran into
Getting the ML model to be actually meaningful was harder than expected. A basic shortage score only looks at supply vs. average demand, but surgical scheduling load can completely change a hospital's risk profile days before it shows up in inventory numbers. Building that surgery-adjusted demand layer and deciding when it should escalate risk vs. just flag it required a lot of iteration. We also had to make a fully synthetic dataset feel realistic with hospital locations and blood type distributions that reflect real-world percentages.
Accomplishments that we're proud of
One accomplishment we are proud of is building a full-stack platform that connects prediction, visualization, and decision-making. Instead of just displaying hospital data, bloodBridge actively identifies shortages, recommends transfer partners, and highlights the most impactful places for donors to contribute. We are also proud of the regional network map, which makes supply stress across multiple hospitals immediately visible and easy to understand during a live demo.
What we learned
This experience taught us how challenging and complex healthcare logistics can be when resources are scarce and demand is unpredictable. We also learned how to use machine learning and feature engineering to simulate real life conditions, like surgery scheduling and trauma demand.
What's next for Northeast bloodBridge
We are hoping to expand bloodBridge to integrate real hospital data, blood bank APIs, and donor scheduling systems to move from a prototype to a real operational tool. We also hope to integrate higher security to our site when using real world data.


Log in or sign up for Devpost to join the conversation.