Inspiration
Blood is a valuable, limited resource. When refrigeration fails or a backup generator does not start, a blood bank can face both supply disruptions and financial losses.
As distance-learning students in a Six Sigma statistics and coding course, we wanted to turn classroom concepts into a practical tool: help a supervisor identify a problem, understand the evidence, and decide where attention is needed.
What it does
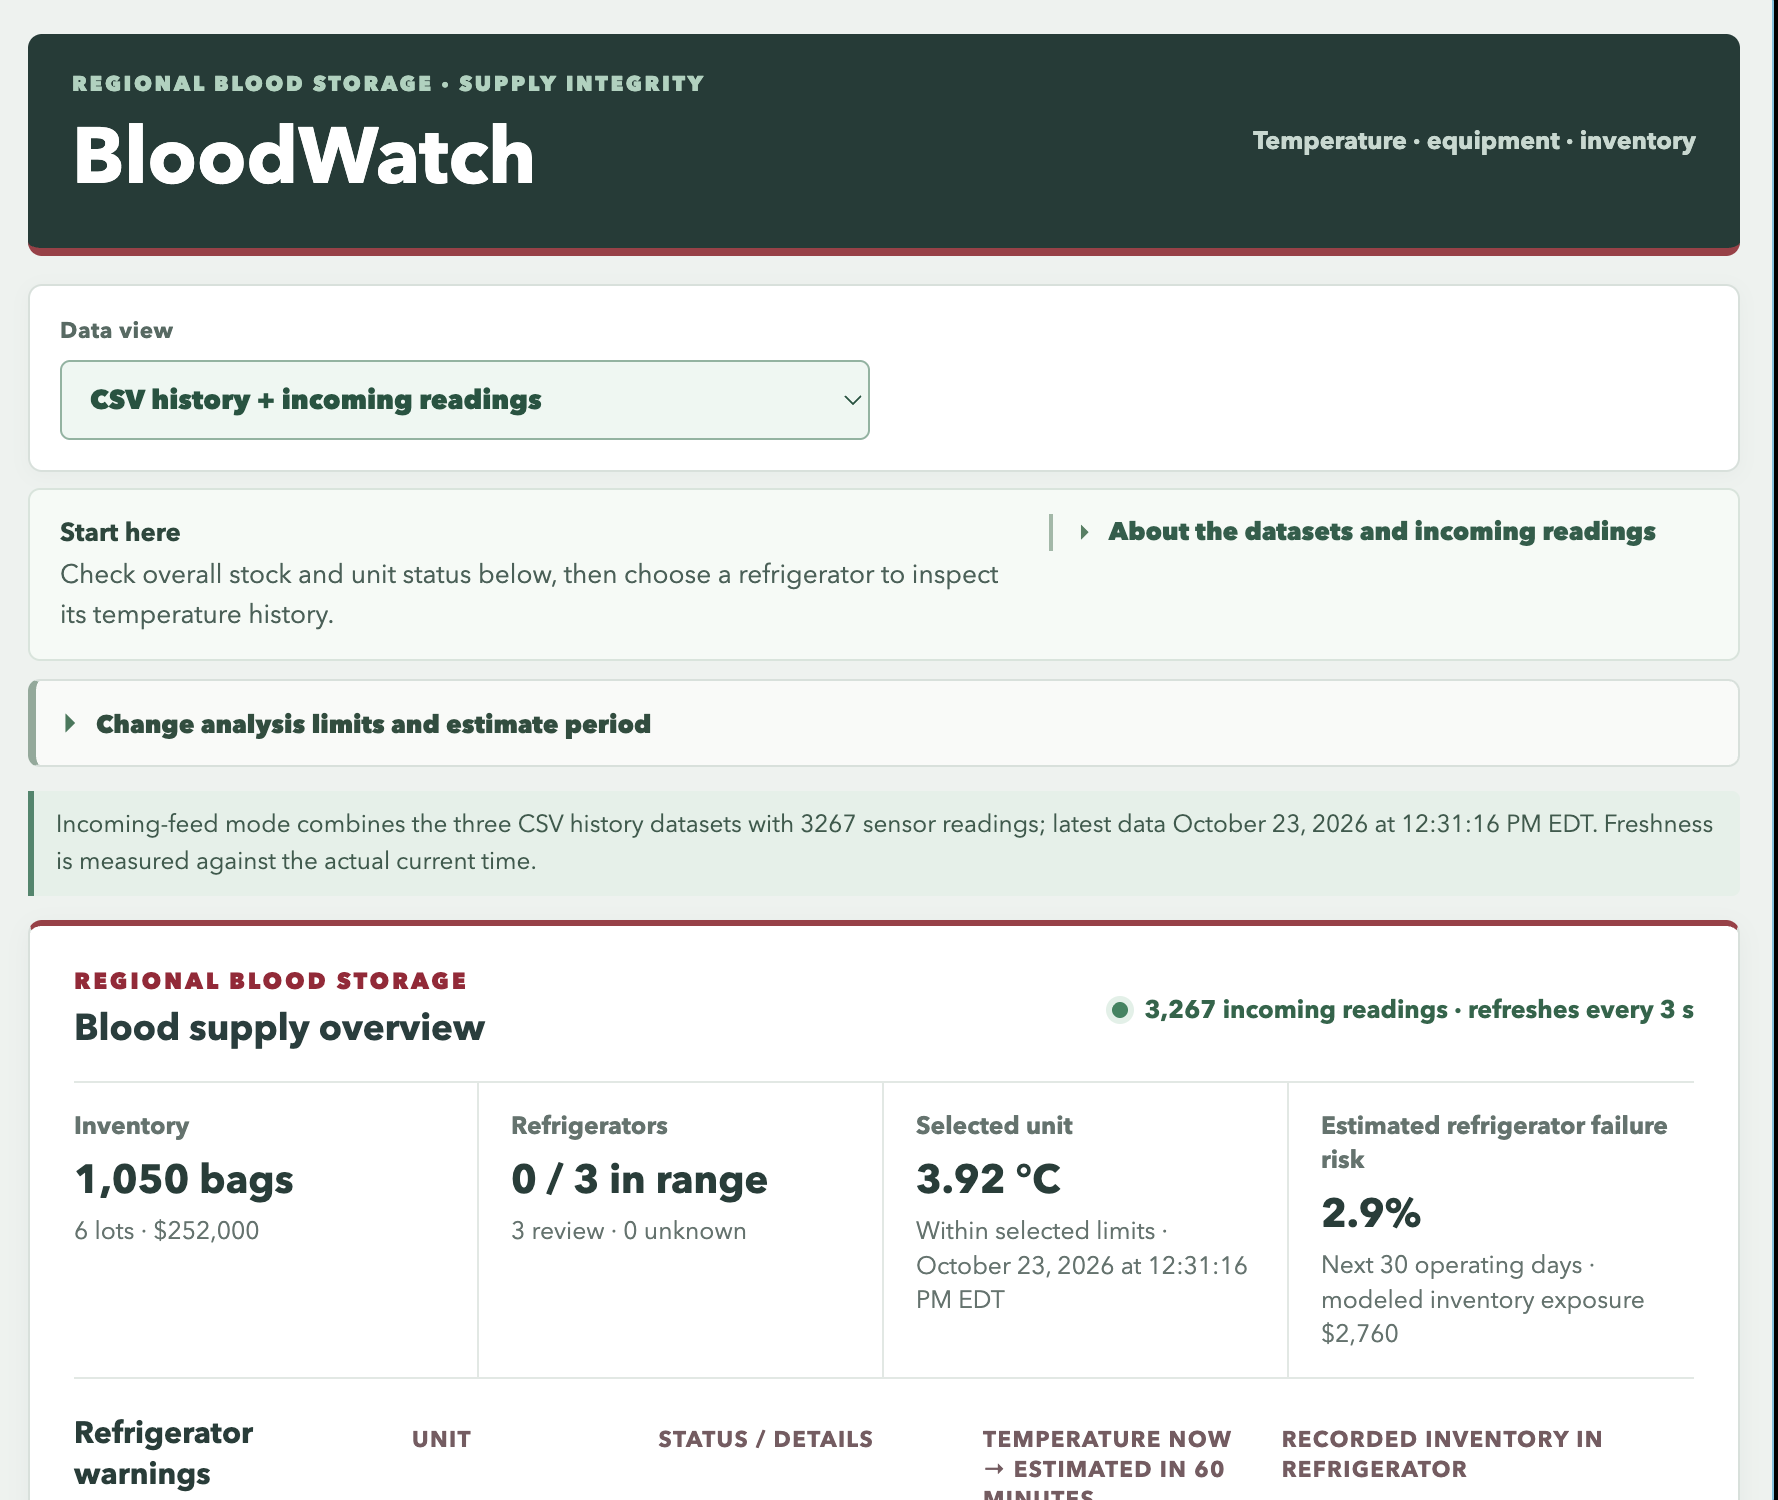
BloodWatch brings temperature monitoring, cooling-interruption records, and equipment reliability into one dashboard.
Supervisors can:
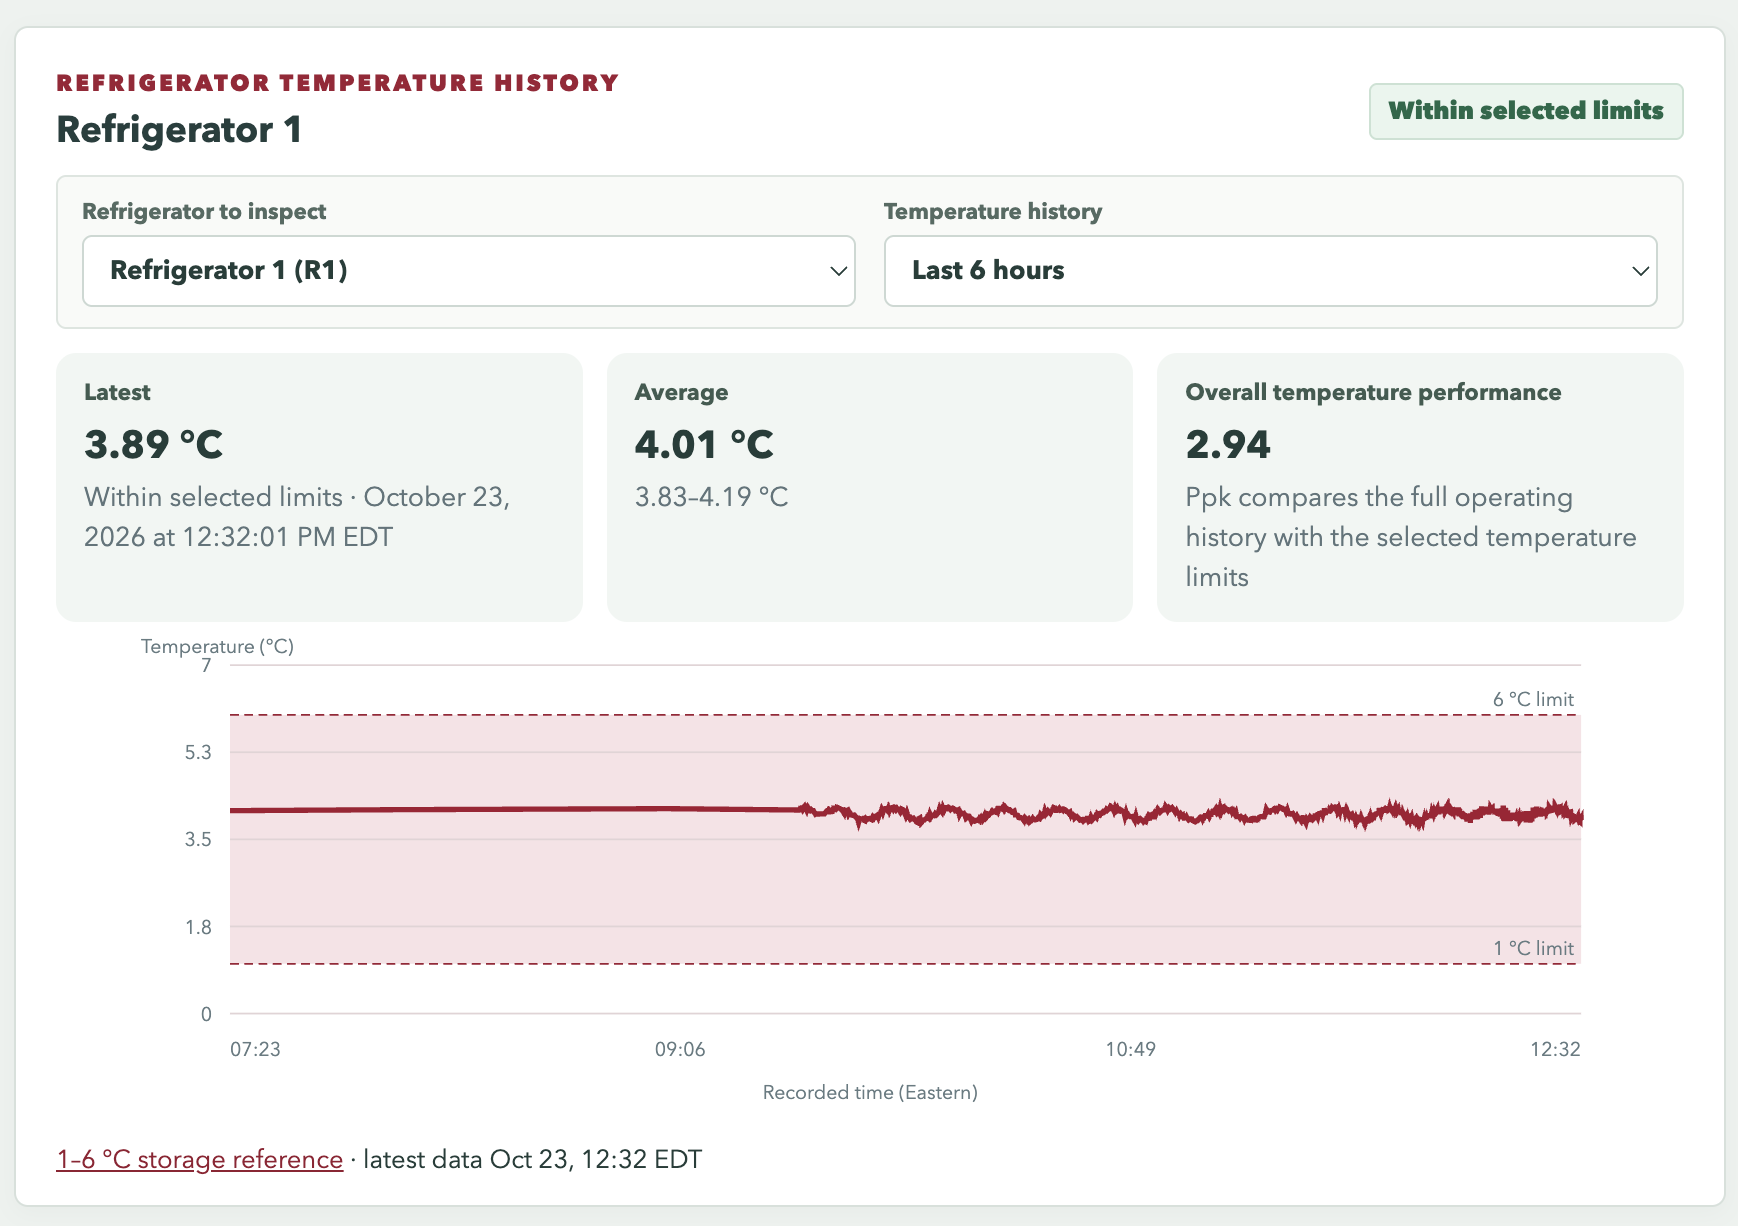
- Review refrigerator temperatures and inventory.
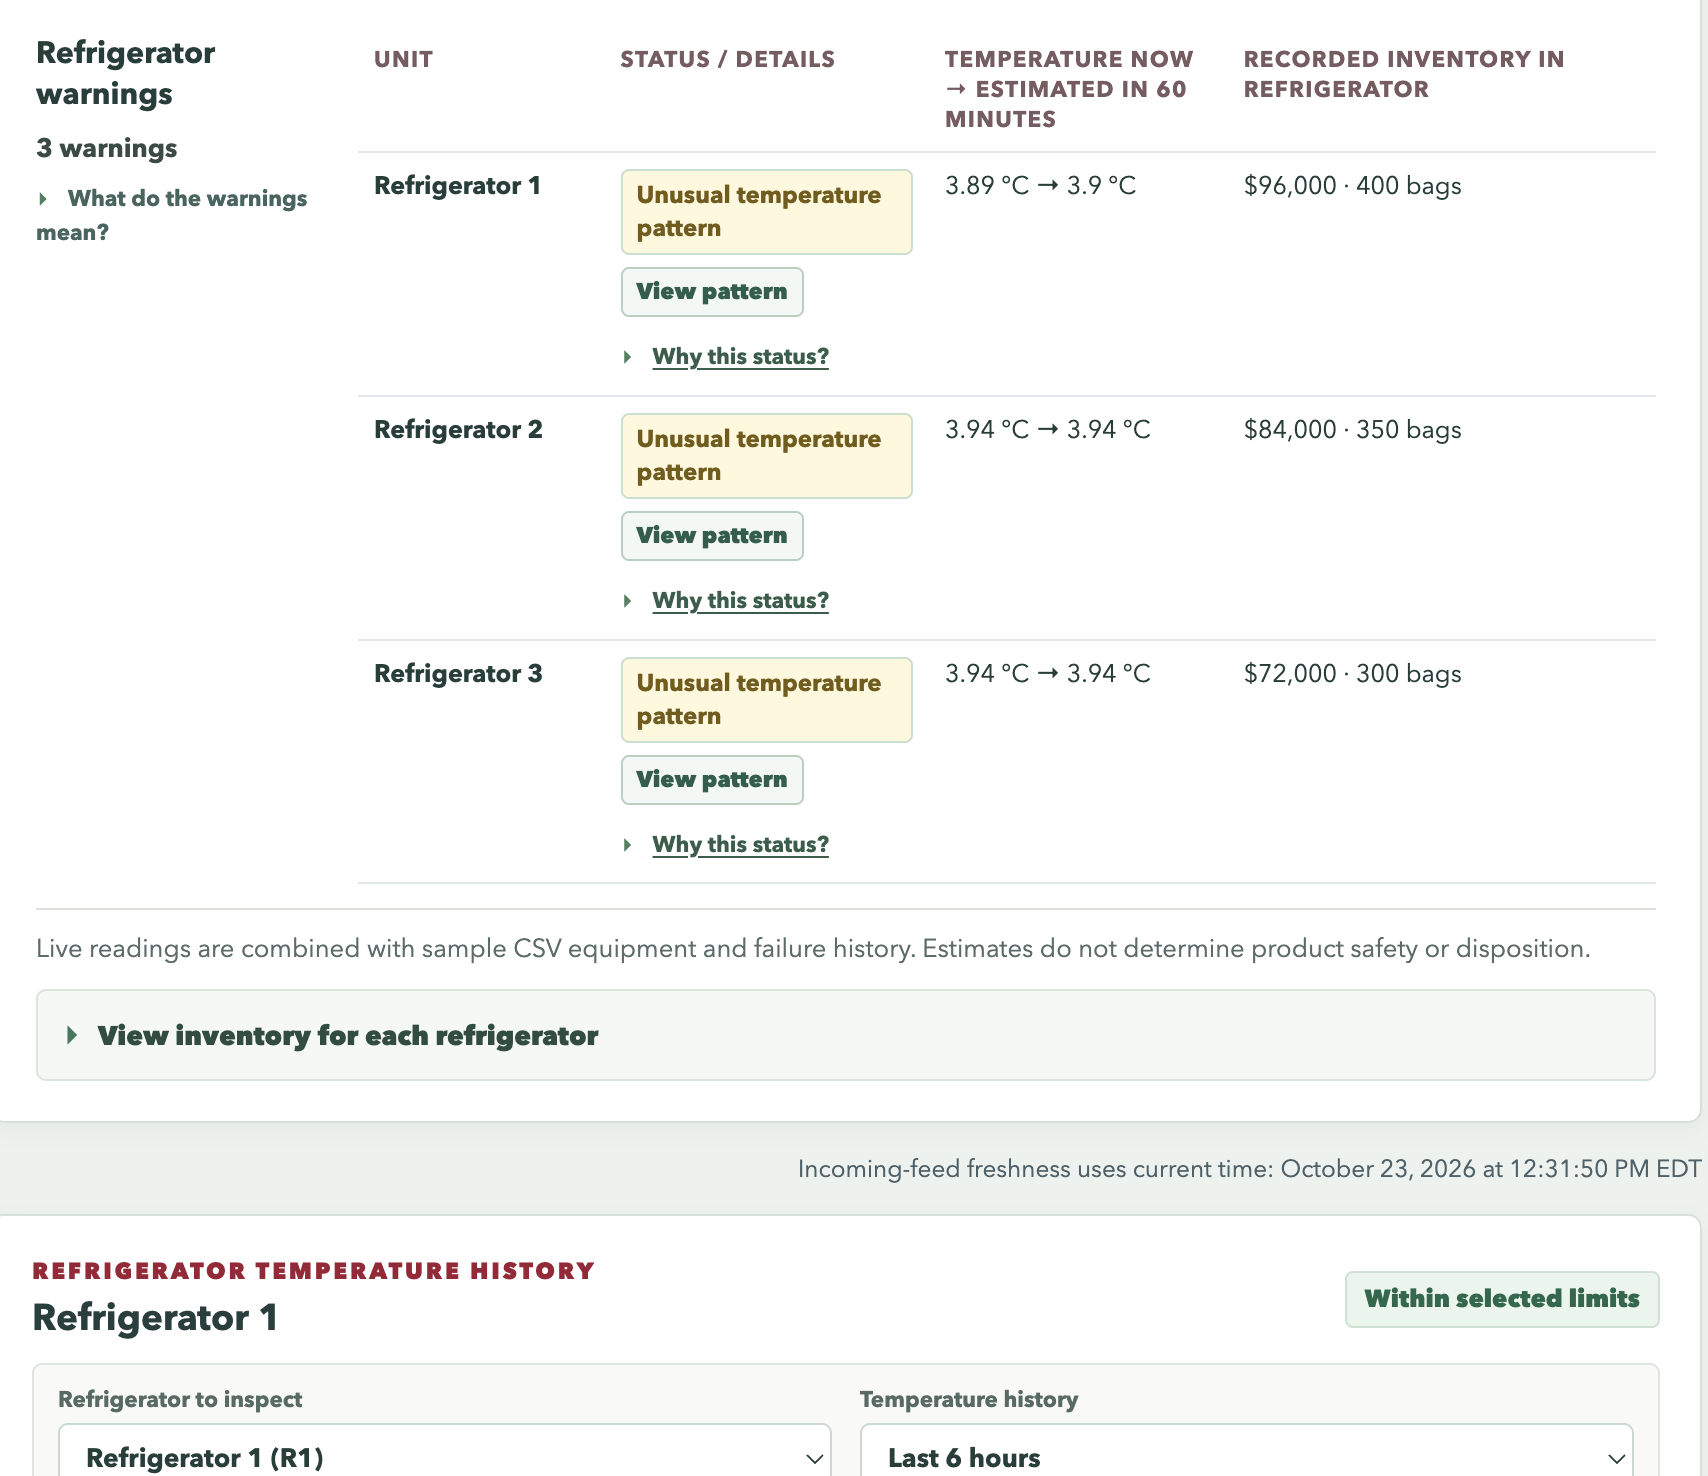
- Identify observed temperature breaches, projected crossings, and unusual process patterns.
- Select “View pattern” to highlight the exact readings behind a warning on the temperature-history plot.
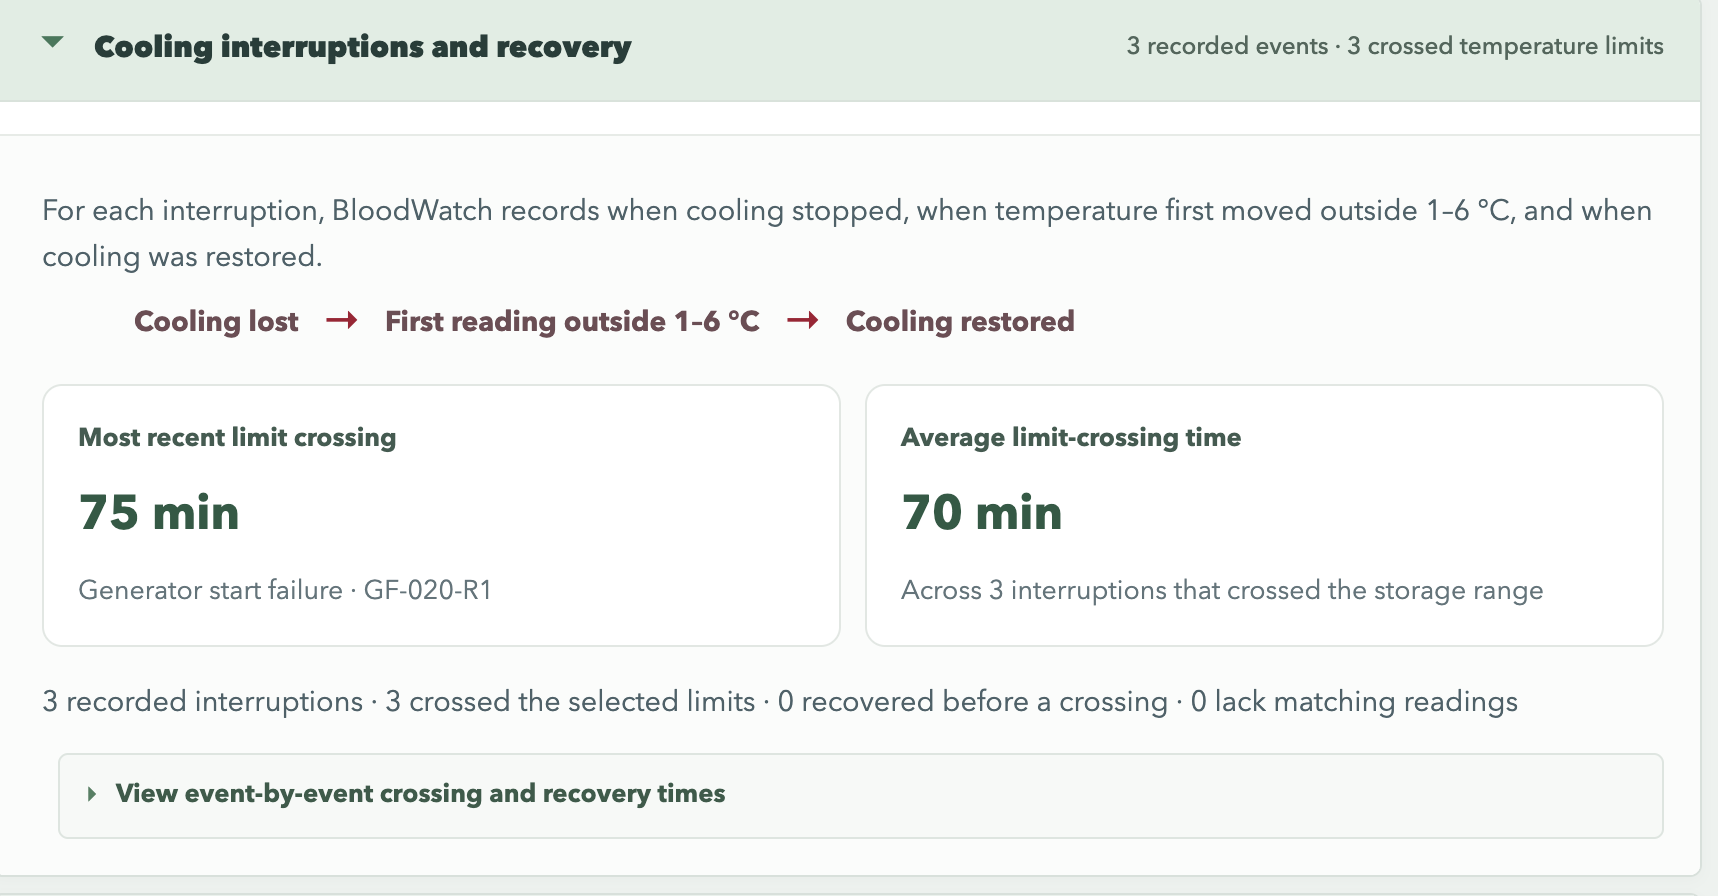
- Compare cooling-loss, temperature-breach, and recovery times.
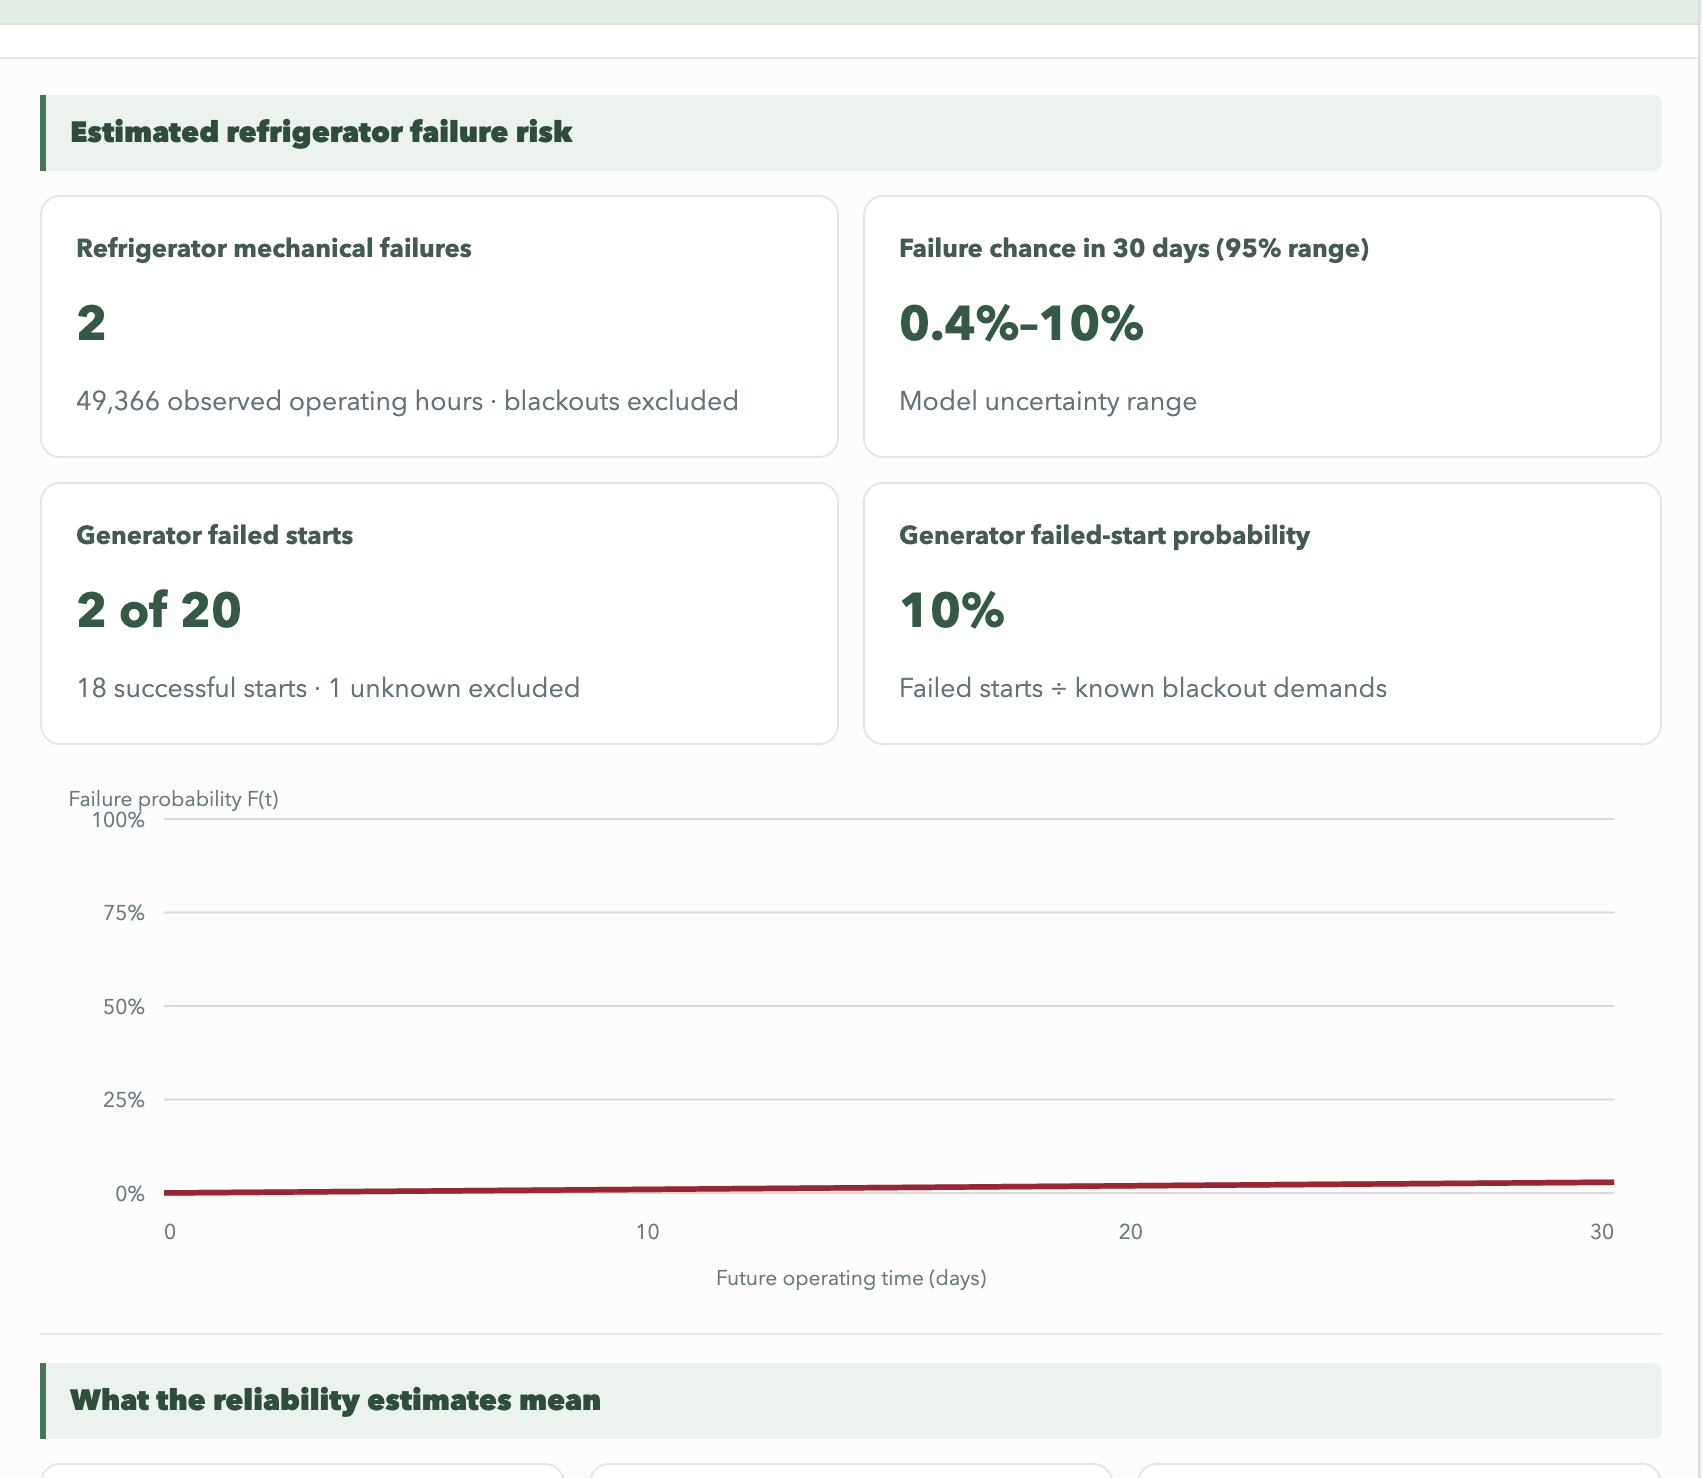
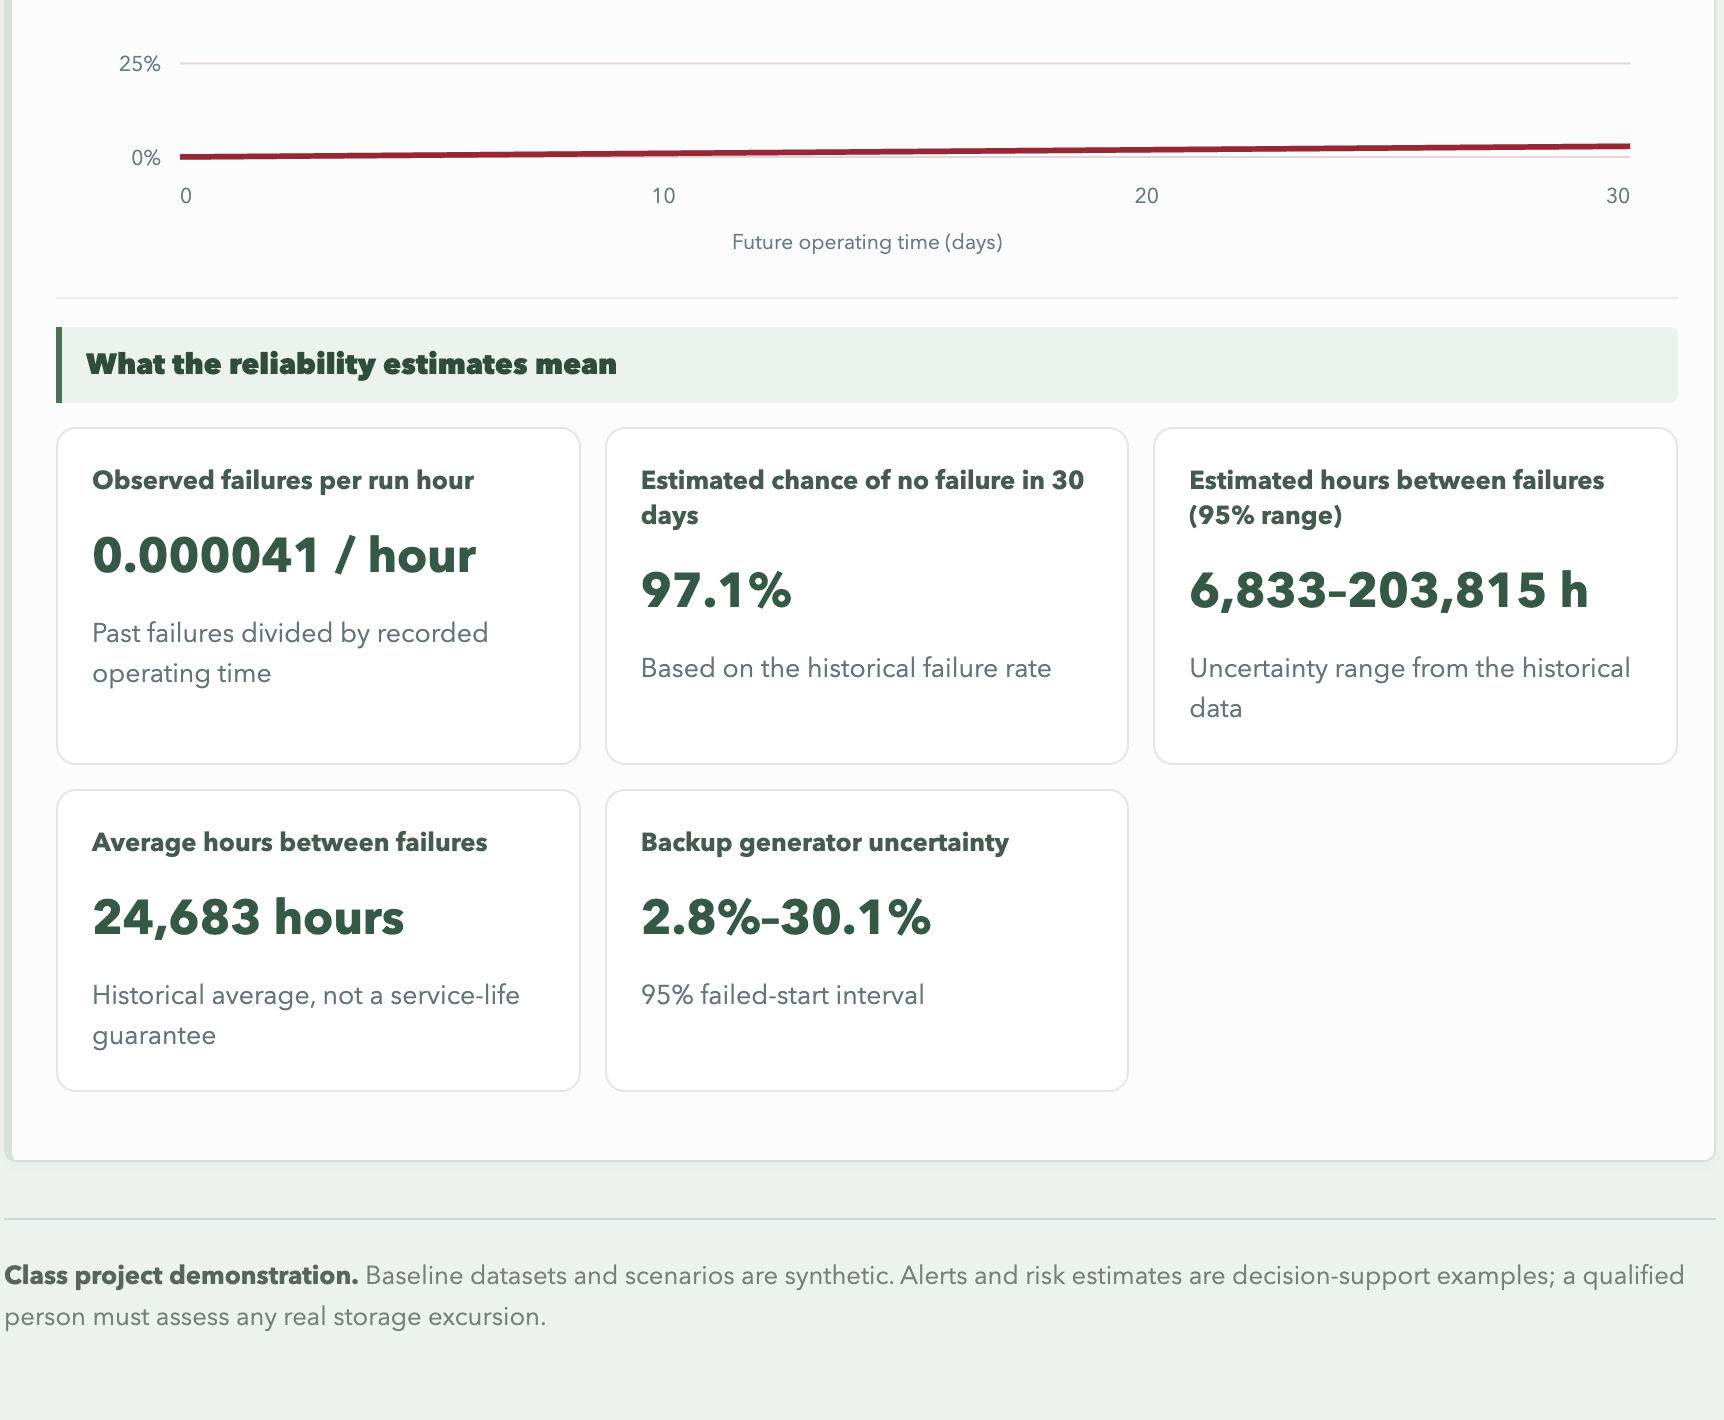
- Explore historical refrigerator and backup-generator failure estimates.
An optional simulated feed demonstrates normal operation, warming, a projected crossing, an actual breach, and recovery.
How we built it
We organized the project around three related synthetic datasets:
- Blood temperature: timestamped refrigerator readings.
- Refrigerator failures: operating exposure, mechanical events, baseline periods, and inventory.
- Generator failures: blackout demands and generator start outcomes.
We built the statistical functions in Python, used SciPy for statistical calculations, and exposed the results through a FastAPI REST API. The dashboard uses HTML, CSS, and JavaScript, with SQLite storing incoming temperature readings.
For refrigerator reliability, we estimated a constant failure rate from observed failures and operating hours:
$$ F(t)=1-e^{-\lambda t} $$
Generator reliability uses failed starts divided by blackout demands with known outcomes. Fixed-baseline control-chart rules identify unusual temperature behavior.
We used GitHub branches for collaboration and AI-assisted development to help build and refine the code. Automated tests check formulas, data relationships, warning behavior, and API responses.
Challenges we ran into
Our biggest challenge was simplifying the dashboard without losing the statistics. Early versions displayed too many metrics together. We refined the interface around equipment status, temperature history, cooling interruptions, and reliability, with supporting details available when needed.
We also had to make the warnings consistent. The status, explanation, warning count, and highlighted readings needed to tell the same story.
Another challenge was choosing meaningful denominators. One blackout affecting three refrigerators is still one generator demand. Refrigerator reliability requires operating exposure from equipment that did not fail, too.
Finally, we needed to distinguish historical records, incoming simulated readings, and demonstration scenarios so users could understand what each result represented.
Accomplishments that we're proud of
- Connecting warnings to evidence: users can jump from a flagged pattern to the exact temperature readings that triggered it.
- Building a working demonstration: the simulated feed shows warnings appearing and clearing as conditions change.
- Applying classroom statistics: reliability functions and control-chart rules support understandable operational questions.
- Making the project reproducible: synthetic datasets, documented inputs, and automated checks help others run and verify the tool.
- Collaborating remotely: we brought data generation, statistical calculations, and the interface together through shared GitHub work.
What we learned
We learned how to connect process variation, control charts, reliability functions, and uncertainty to a supervisor’s decisions.
We also learned to distinguish storage specifications from control limits, equipment failure from temperature breach, and inventory exposure from confirmed financial loss.
Most importantly, a useful statistical tool must explain its results clearly. BloodWatch’s synthetic demonstrations show how monitoring and analysis can support investigation; they do not determine biological blood viability or replace a qualified person’s assessment.
What's next for Blood Watch
We would like to evaluate BloodWatch using calibrated temperature-logger data and longer equipment-maintenance histories. This would help us assess warning accuracy, check model assumptions, and understand how well the demonstrations reflect actual operating conditions.
We also want feedback from blood-bank staff to refine the interface, clarify response information, and keep the dashboard focused on the decisions supervisors need to make.


Log in or sign up for Devpost to join the conversation.