-
-
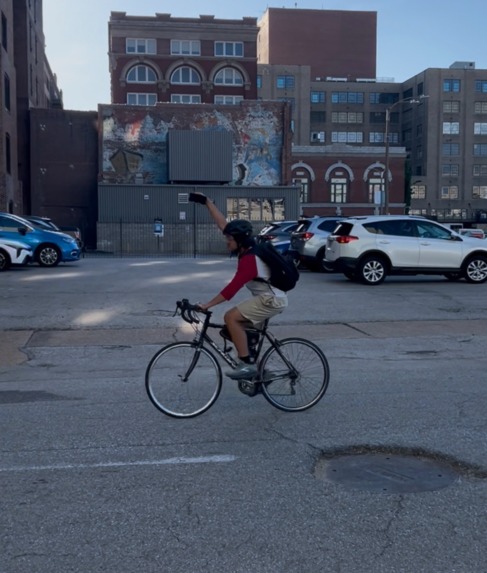
Kevin collecting data for the Hackathon

Inspiration
The Downtown St Louis Area has a lot of businesses active businesses coexisting amongst boarded up buildings up for commercial lease. Investment in the area is difficult without an accurate assessment of economic activity. Publicly available dataset is not always accurate or update to date on the current state of a business corridor like Washington Avenue and companies like Costar, who try to bridge this gap, are 3-6 moths behind as well. The goal of this project is to create an automated method to give a ground-truth read to retailers before they sign the lease.
What it does do
First, it compares current street video against the Overture Maps registry to surface what's changed in the commercial corridor. Second, it flags change indicators in neighborhoods - like For lease or sale signs, new construction, boarded up buildings, or Grand Opening signs. This combination let's retail leaders see the full and recent picture before committing to 5-10 year leases
How we built it
The video analysis pipeline was built on top of FFMPEG which pulls frame data from video and a pytho script merges it with GPS data from GPX file. The time stamps is also correlated with prediction results from PEGASUS model.
Coordinates are fed as query parameters to overture API which pulls POI. We do a spatial buffer to isolate POI's within 50 feet of a GPS position. Then we use fuzzy diff and geographic proximity to match signage on the street and the Overture place description.
Challenges we ran into
The biggest challenge as getting clean data on day 1. Getting stable footage footage on the bike was hard. Also getting it to output the kind of result was hard. Of course the biggest challenge was time. 24 hours was not enough time to implement all the features we would have wanted. Getting accurate ground truth data was also a challenge. This is because even though we had a method for collecting input video from GPS tagging we did not have a method to correlate text data with GPS data. This would have been useful for analyzing whether a business was boarded up.
Accomplishments that we're proud of
Turning an open geospatial dataset into a defensible CRE product solving a real problem. We also discovered new business location that was not on Overture, specifically Re/Max.
What we learned
With two beginners on the team, geospatial data and the associated apps were fun to learn about and use.
What's next for Blocksight
We would like to explore vector embeddings to that describe a place so we can match signage to a building. We would also like to do a quantitiative analysis of all the boarded up locations on Washington Ave.
Links:
Frontend App: https://v0-twelvelabs.vercel.app/
Documentation + Analysis: https://docs.google.com/document/d/1XfF6uodJV0ZOcSFHDEwWokgui43UxgclxOPi2DkecYI/edit?tab=t.0
Raw Data Analysis Spreadsheet: https://docs.google.com/spreadsheets/d/1TvBddc_QWx8OCm8645GaH_PdOFjCBRqOkbpAWfsiw5o/edit?gid=0#gid=0
Mission Impact Brief: https://drive.google.com/file/d/1gyjGvKZncUYO6nxCyRpXnlcJGwrNuPqD/view

Log in or sign up for Devpost to join the conversation.