Inspiration
I've always been very interested in different ways to represent data. When I found out that blockchain offered a websocket and data API which could give real-time bitcoin data I knew I had to do something with it.
What it does
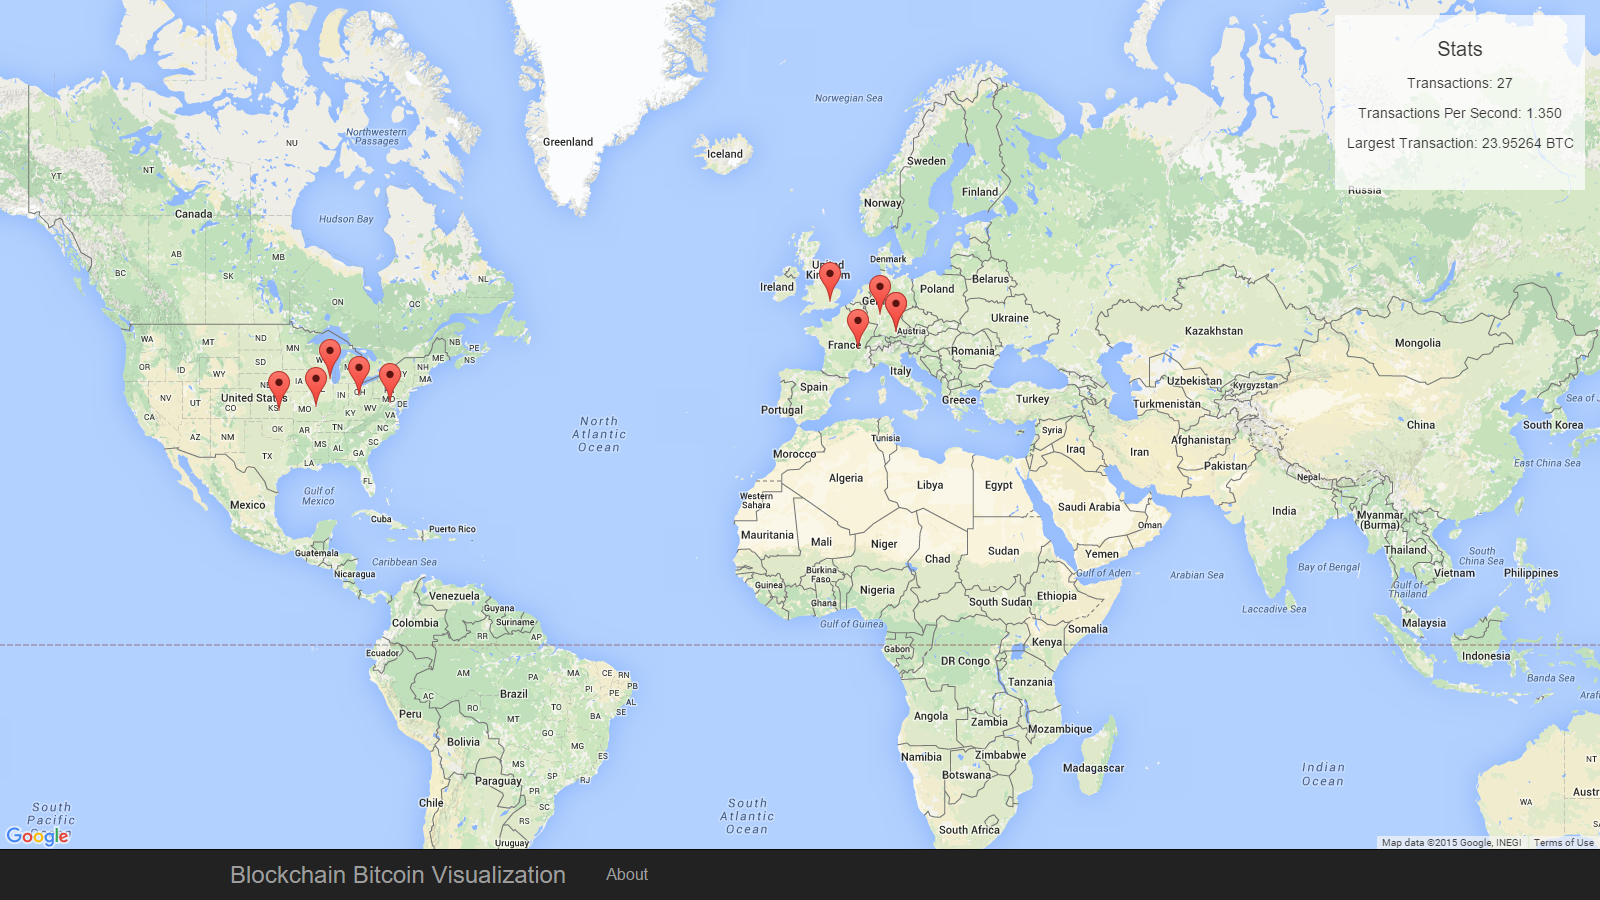
The blockchain visualization map utilizes real-time bitcoin transaction data. This data is parsed and analyzed to create a map of active bitcoin nodes throughout the world while also accumulating statistics such as transactions per second and largest recent transaction amount.
How I built it
I used Bootstrap/HTML for my front end and Javascript/node.js for my back end. Most of the app's processing is on the client-side javascript so the load on the server is very minimal. I used node.js for forwarding certain API requests that the client-side javascript couldn't handle too well. The map is powered by the Google Maps API and the IP to latitude/longitude transformation is powered by the ipinfo.io API.
Challenges I ran into
The biggest challenge I ran into was getting all the different APIs to cooperate together. I ended up having to move one of the APIs to a node.js server to get everything to work.
Accomplishments that I'm proud of
I'm proud of how polished the "final" product looks. I don't have much front end experience, so to see something come together that is both functional and aesthetically pleasing is very rewarding.
What I learned
Callbacks, usually caused by the various APIs, made it a lot harder for me to maintain a nice flow throughout my app. I had to change a lot of my usual coding practices to better fit the languages and context I was coding in.
What's next for Blockchain Visualization Map
My first priority would be to expand upon the statistics sidebar. The amount of raw data that the blockchain API provides is perfect for data visualization and statistics. Hopefully in the future this web app will be able to serve as an educational resource for anyone interested in bitcoin.


Log in or sign up for Devpost to join the conversation.