-

Main page
-

Risk heat map - high dimesion
-
Risk heat map - lower dimesion
-

Potential construction sites in future
-
Details of a single address - 1
-
Details of a single address - 2


Inspiration
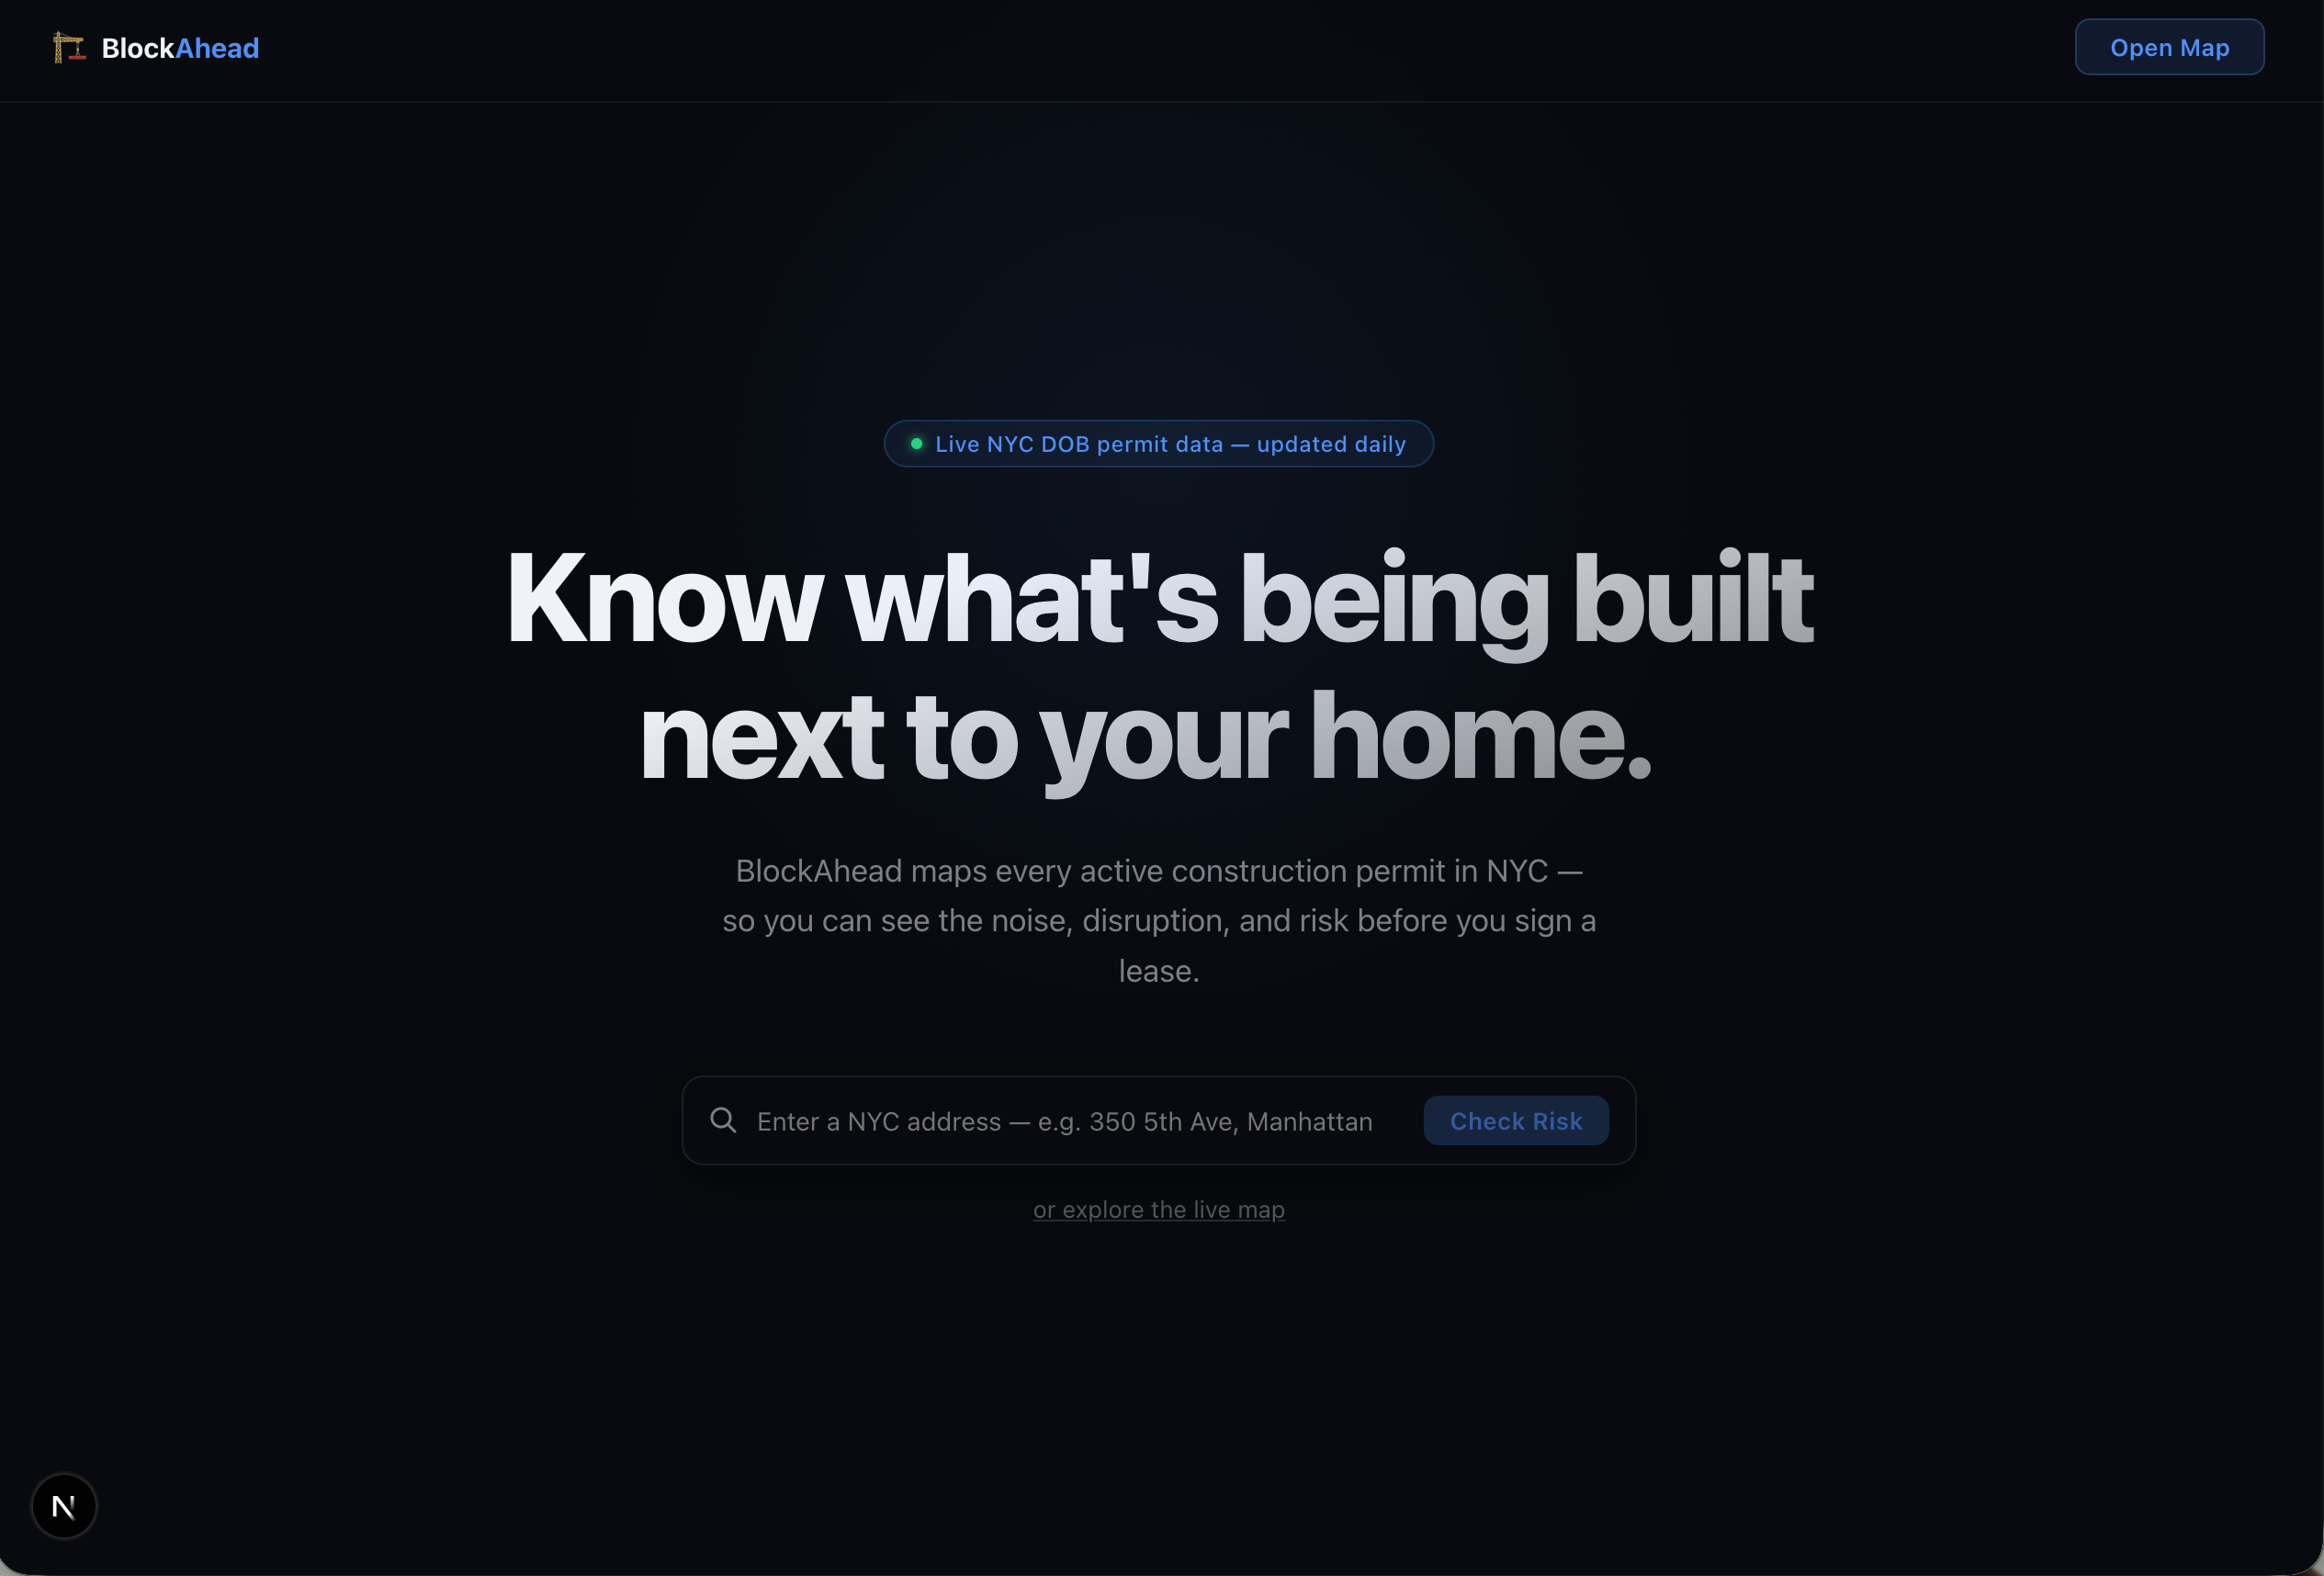
Over 750,000 noise complaints hit NYC's 311 system every year. Construction is the #1 source. You sign a lease, move in, and discover a tower going up next door with weekend demolition permits. The city publishes all this data — permits, after-hours variances, complaints, zoning — but it's scattered across six different portals. Nobody checks before signing. We built BlockAhead so apartment hunters can see what's coming before they commit.
What it does
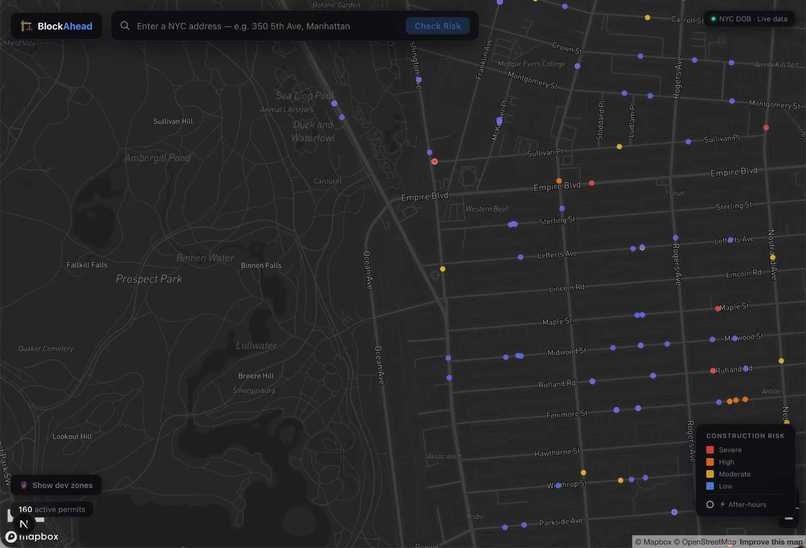
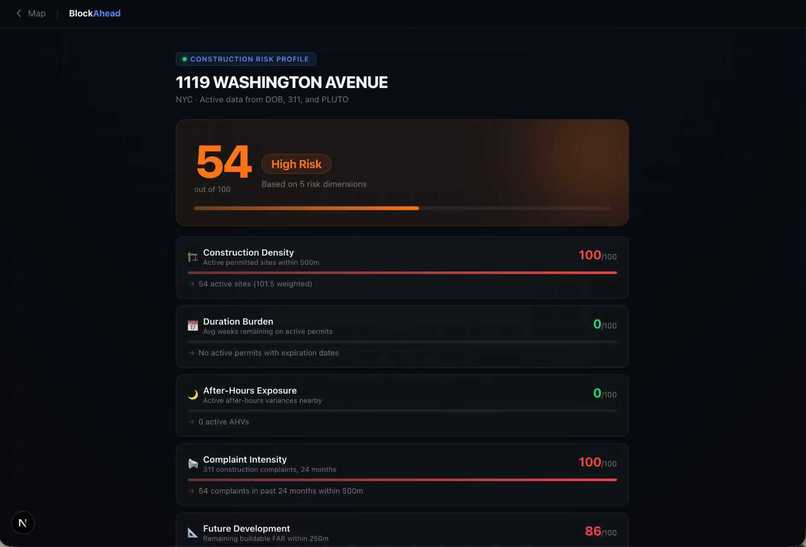
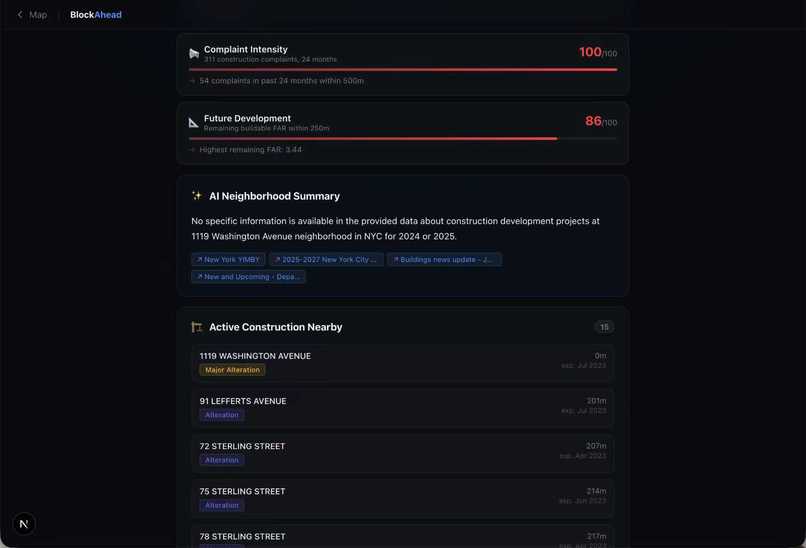
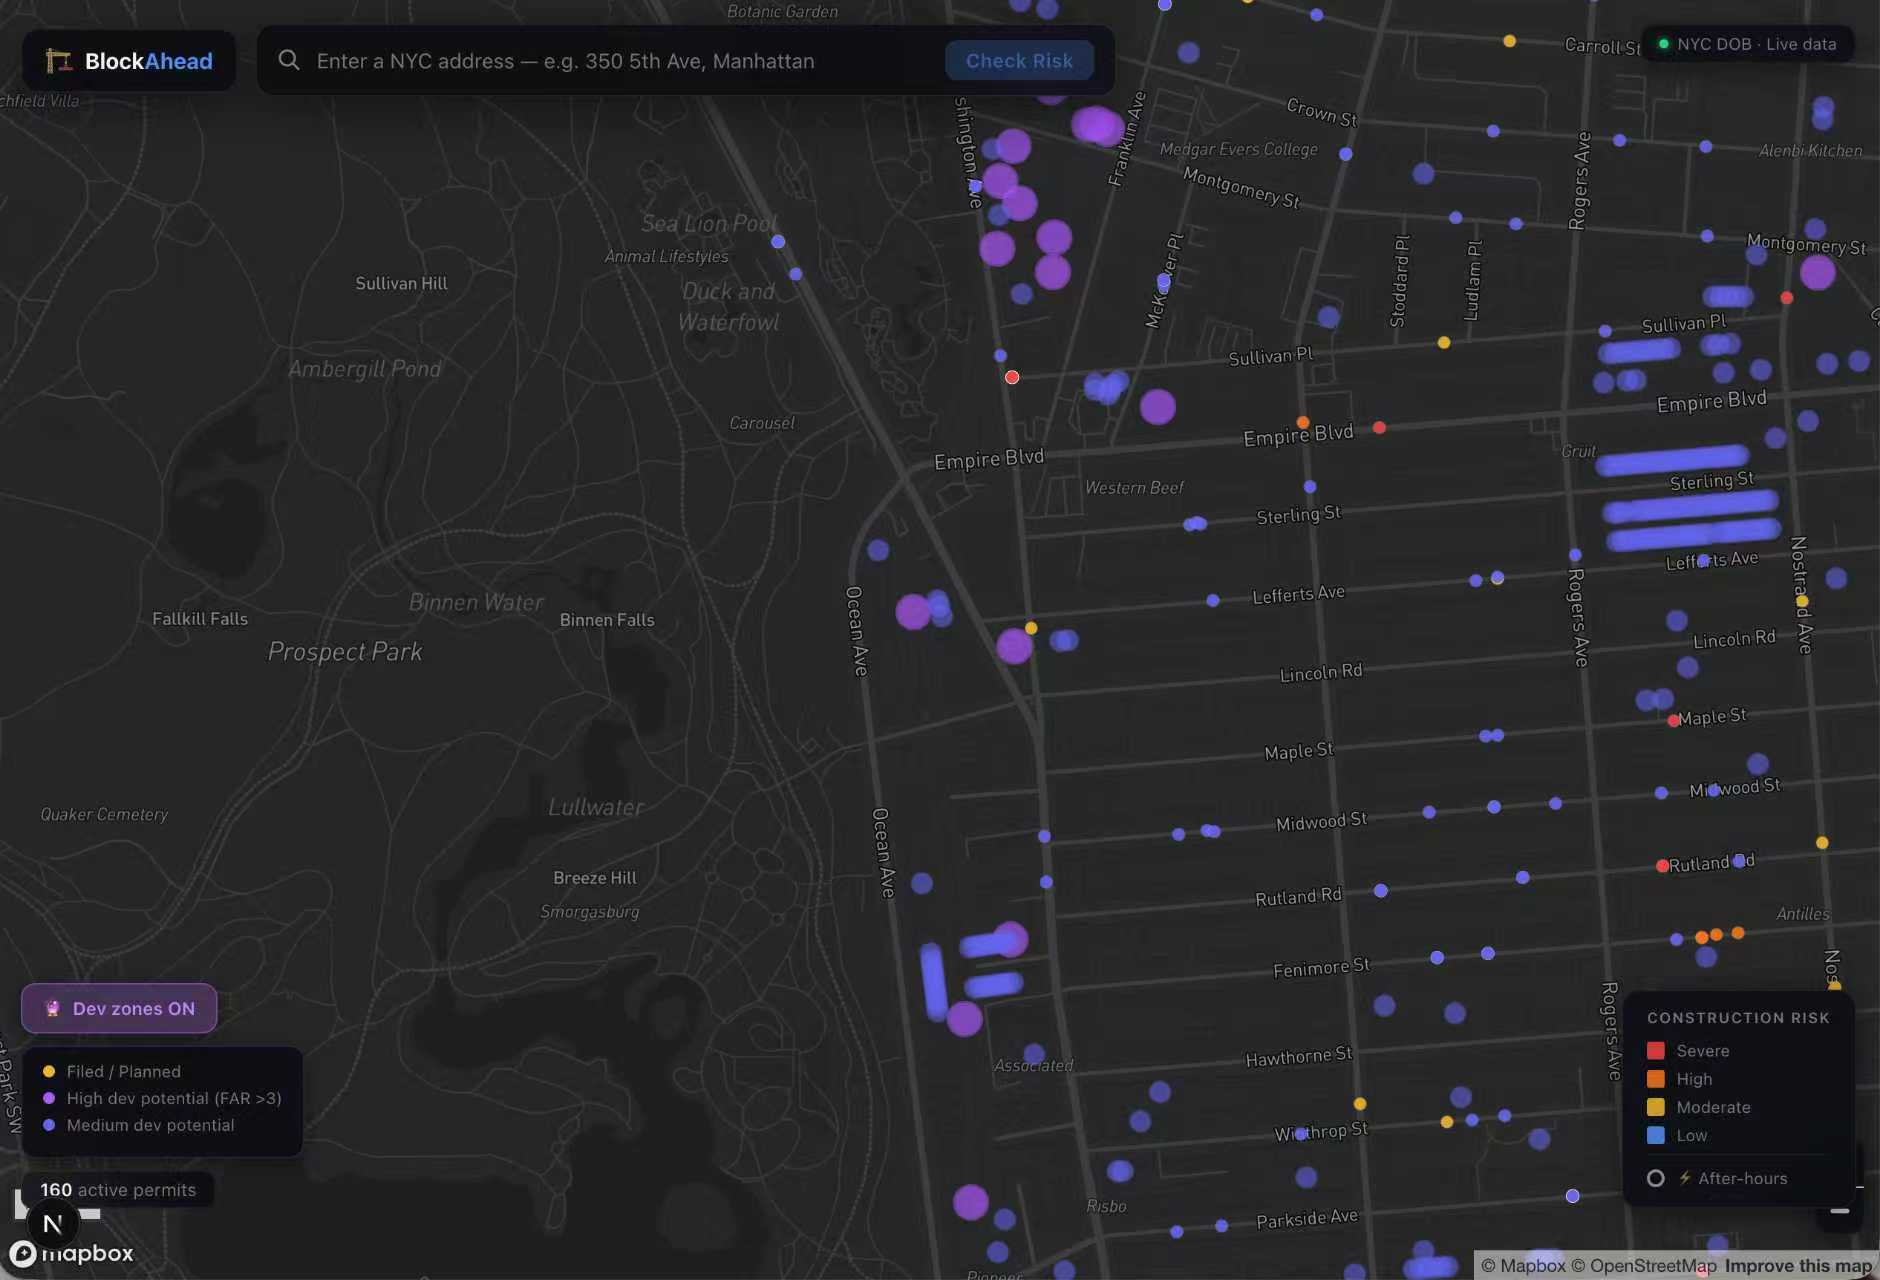
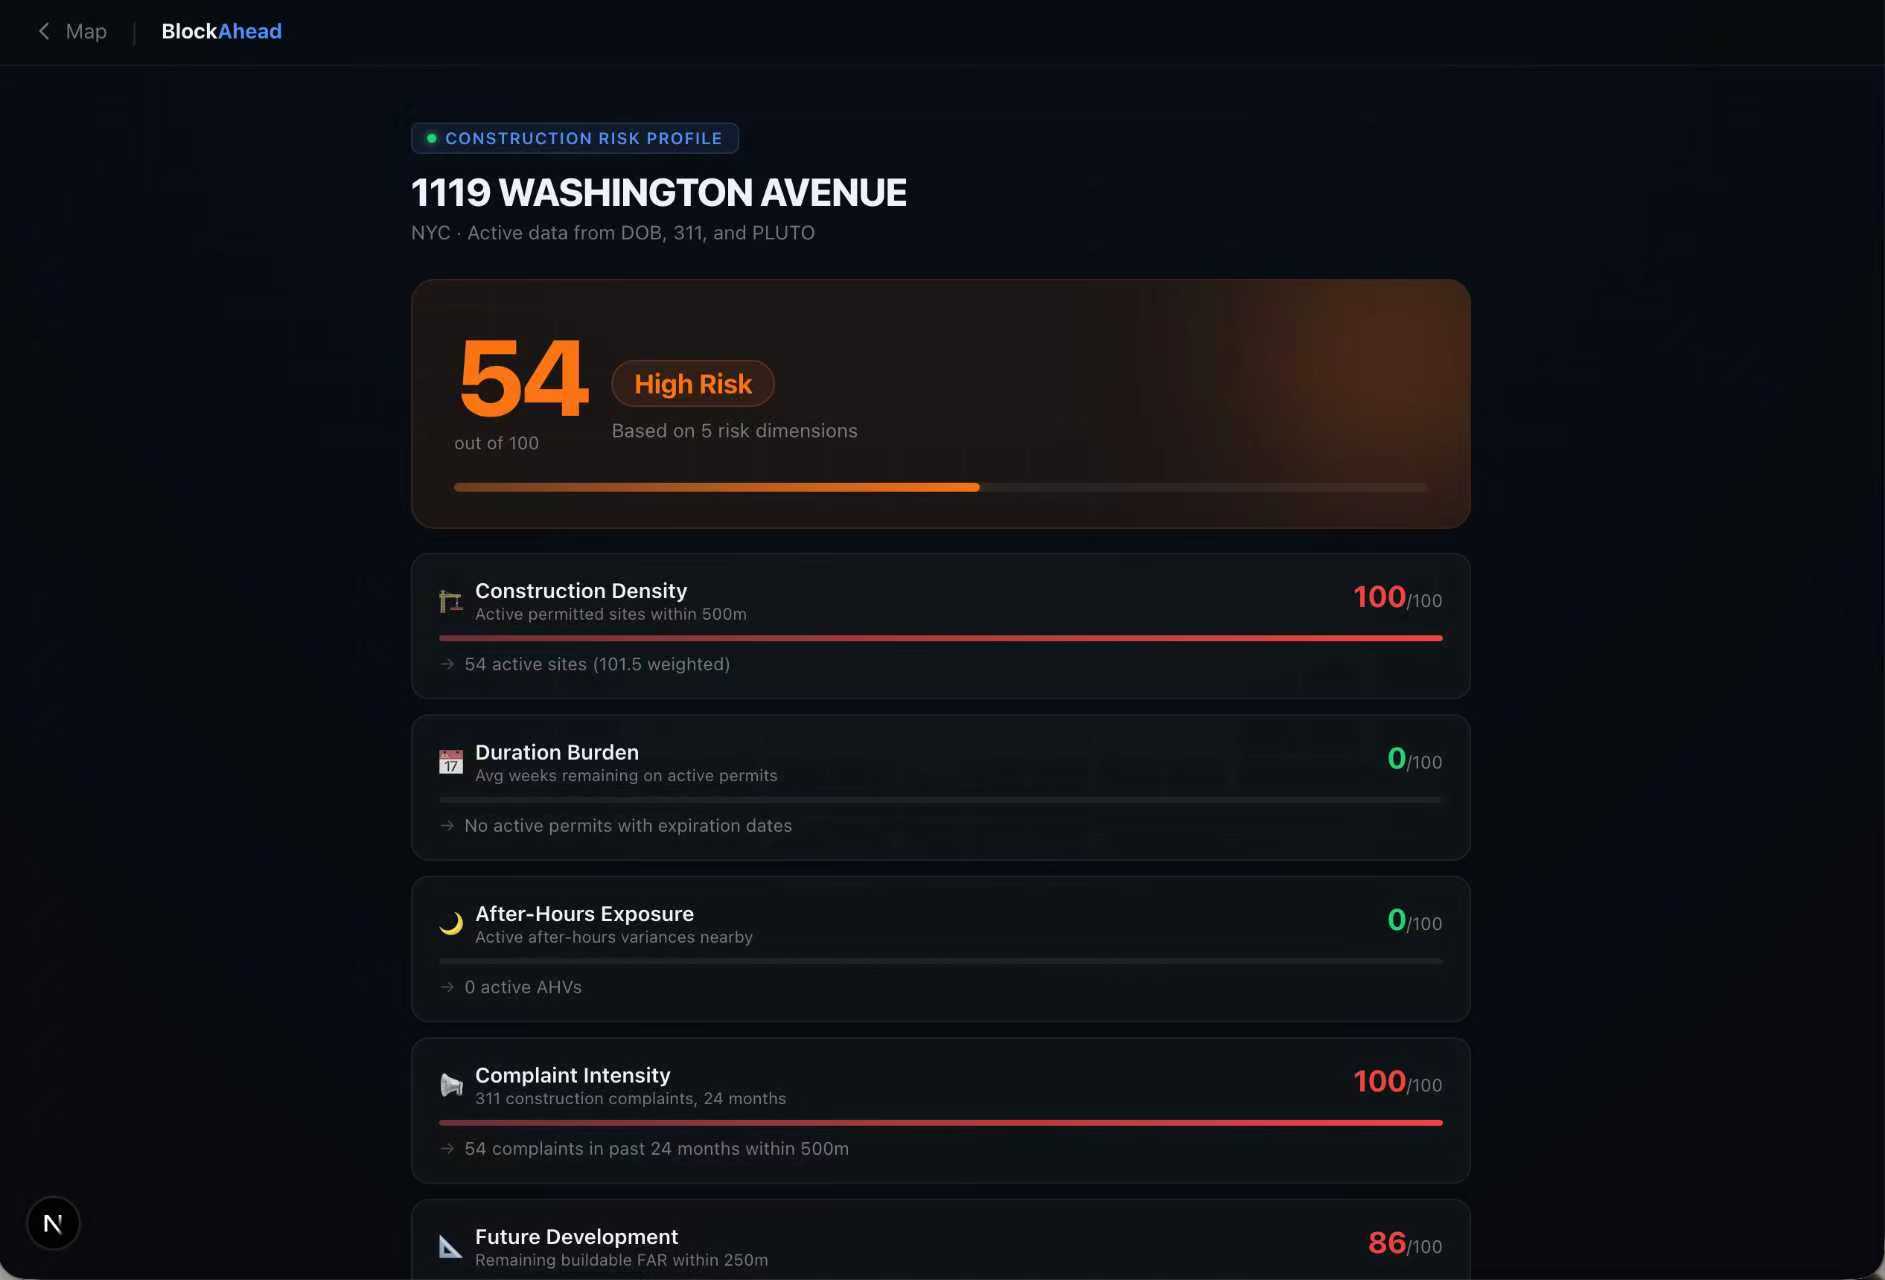
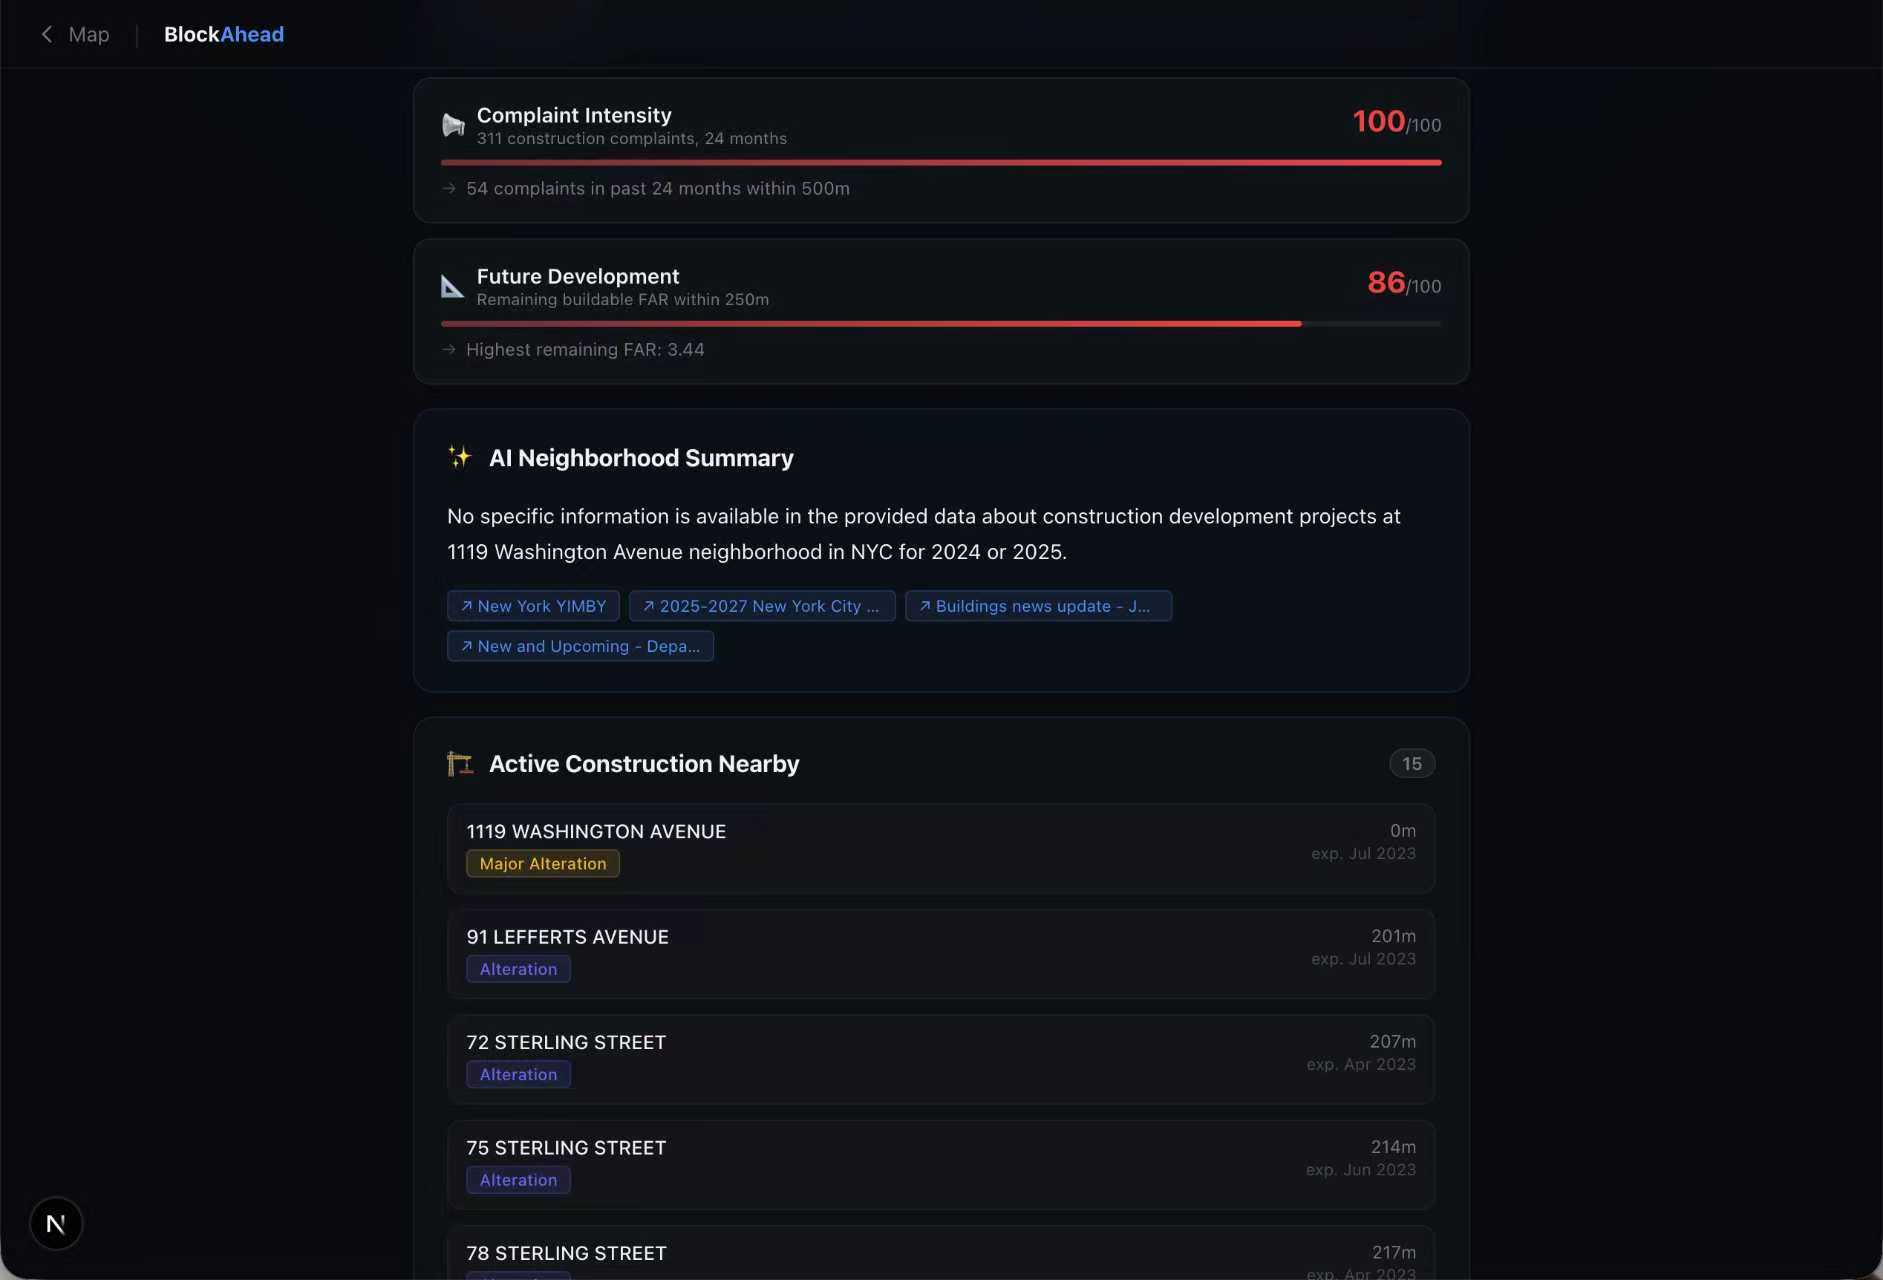
BlockAhead gives any NYC address a 0–100 construction risk score. The score spans five dimensions: construction density, project duration, after-hours noise, complaint history, and future development potential. An interactive 3D hex grid map covers all five boroughs. Color and height encode severity at a glance. Zoom in to see individual permits, AHV flags, and complaint hotspots. A development overlay reveals underdeveloped lots where construction hasn't started but likely will. Each address profile includes an AI-generated neighborhood briefing with recent news and live data context.
# How we built it
Python ETL scripts pull from five NYC Open Data sources via Socrata: DOB BIS, DOB NOW, after-hours variances, 311 complaints, and PLUTO parcels. Over 1.2 million construction records and 858,000 tax lots feed into PostgreSQL + PostGIS. We deduplicate BIS/DOB NOW overlaps, normalize status codes, and batch-geocode complaints through NYC GeoClient v2.
The frontend is Next.js 15 with Mapbox GL JS and H3 hexagonal indexing. Hex resolution adapts from city scale (H3 res 7) to block level (res 9). Risk scoring runs five parallel PostGIS spatial queries. Geocoding chains NYC GeoClient with a Nominatim fallback. AI summaries come from the Linkup API combined with database context.
# Challenges we ran into
Data quality. BIS and DOB NOW use different field names for the same data. gis_latitude vs latitude. Single-letter status codes vs full strings. DOB NOW has no job type field — we inferred it from descriptions like "Sidewalk Shed." BBL identifiers had to be manually constructed from separate block and lot fields.
Scale. Our first pull grabbed 50,000 records — barely covering Midtown. The full BIS dataset has 4 million rows. We added paginated fetching, 10,000-row chunked upserts, and a 2,000-site API cap to stay responsive.
# Accomplishments that we're proud of
Real risk data across all five boroughs. Not mock data. Not one neighborhood. The entire city, backed by 1.2 million live records. The hex grid makes density legible at any zoom. 3D extrusions give a visceral sense of severity. The risk score isn't a black box — every dimension shows its evidence. The development overlay answers a question no existing tool does: where will construction happen next?
# What we learned
NYC open data is comprehensive but painfully inconsistent. The same building appears in two systems with different IDs, vocabularies, and field names. Data normalization wasn't a preprocessing step — it was the core challenge. PostGIS spatial queries are powerful but need careful indexing. A missing GIST index turns 50ms into 30 seconds on 600,000 rows. The simplest feature hit hardest: the after-hours variance boolean is what users react to most.
# What's next for BlockAhead
- Alerts. Subscribe to an address. Get notified on new permits, AHV filings, or complaint spikes.
- Historical trends. Filing dates go back years. Show whether a neighborhood is winding down or ramping up.
- DOT closures. Road and sidewalk closure data completes the disruption picture.
- Mobile. Walk up to a viewing, open BlockAhead, see the risk profile on the spot.
- Community reporting. 311 has a lag. Let users flag active disruptions in real time.

Log in or sign up for Devpost to join the conversation.