Inspiration
Coming into HackCU, we knew we wanted to use Google Sentiment Analysis with social media. When we were here we became excited about the challenges proposed by OppenheimerFunds and Twitter, so we decided to focus on a market sentiment analysis.
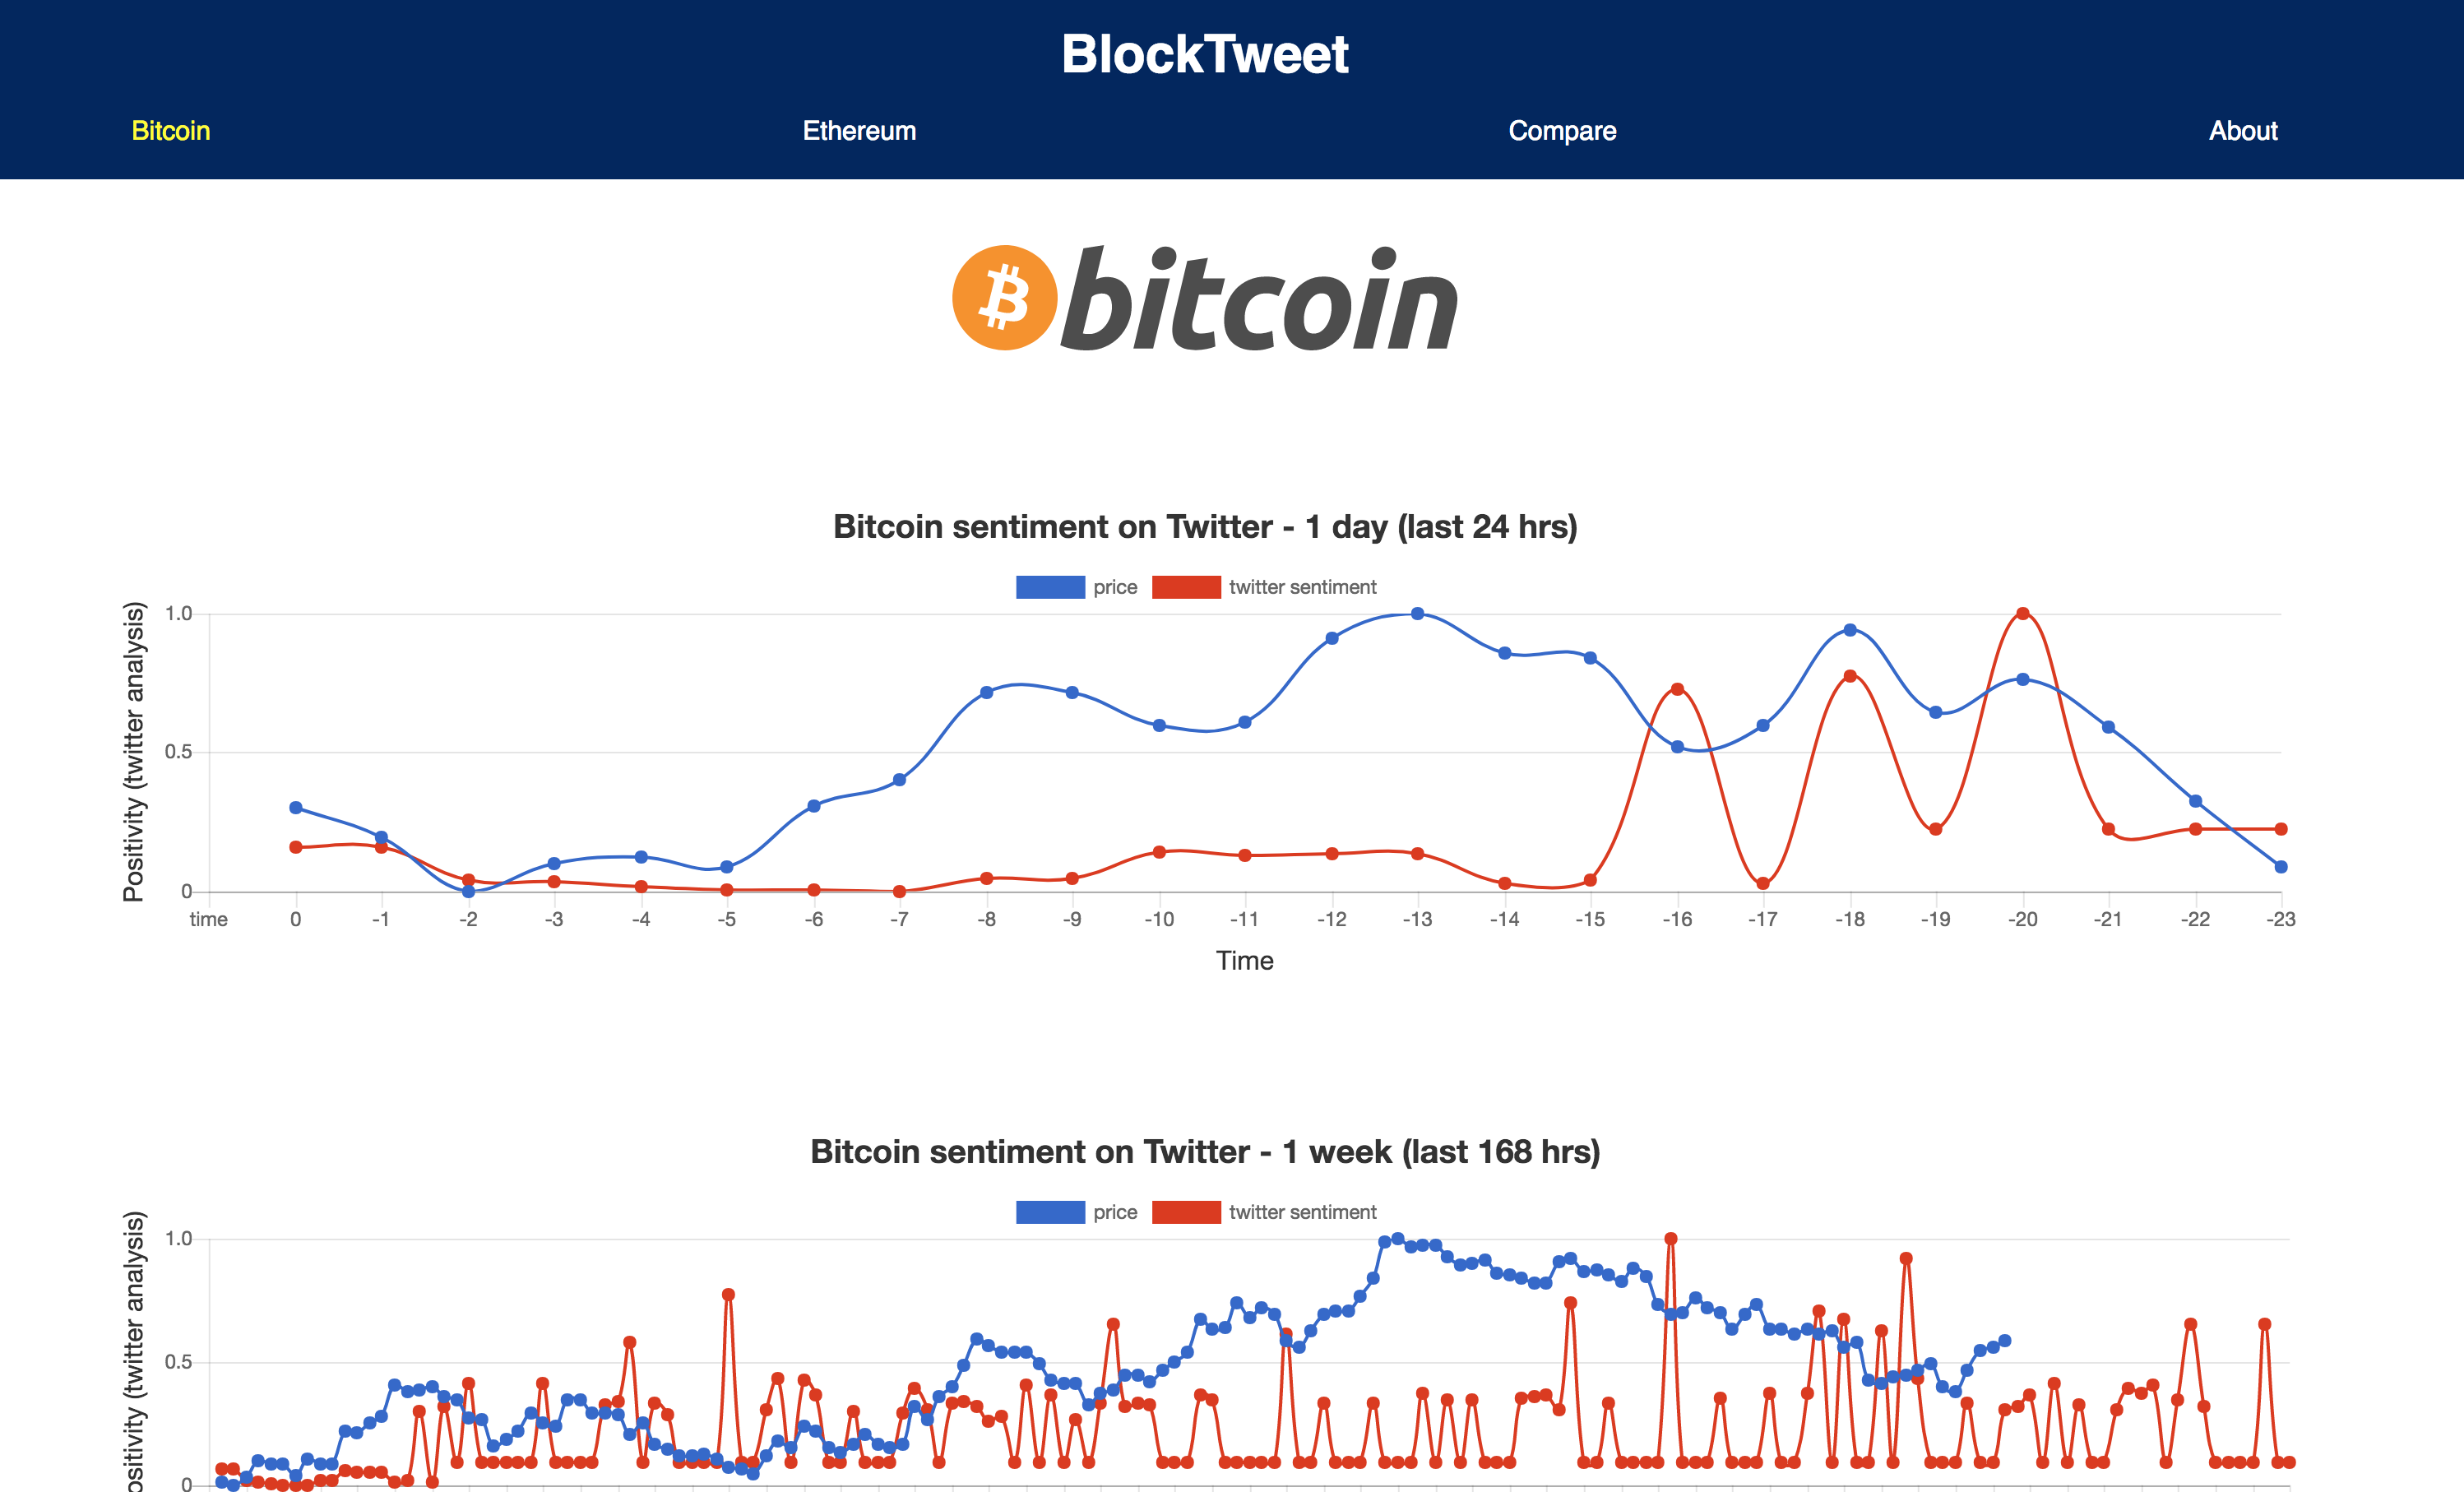
What it does
Every hour we collect the most popular tweets in four categories: "bitcoin", "ethereum", "blockchain", and "crypto". We package those tweets up and send them through the Google Natural Language API to get a sentiment score and magnitude for each category. Our React front-end queries the backend API of scores and plots them against hour by hour bitcoin and ethereum price data.
How we built it
Our team was composed of two front-end developers and two back-end developers, so we decided to build two separate applications that work together.
On the back-end, we built a Rails API to serve data to the front-end. We host the backend on Heroku and using Heroku Scheduler, we make hourly calls to the Twitter API. We send this tweet data through the Google Natural Language sentiment analyzer and create normalized values based on sentiment (-1 negative to 1 positive) and magnitude (degree of certainty).
Our front-end was built using React.js and uses from the ChartKick and Chart.js libraries. Our main objective was to display this data graphically so the user can easily digest the information and make comparisons between cryptocurrency prices and twitter sentiment. We queried the backend, formatted the response data to satisfy CharKick, and created our own normalizer to compare values across the board.
Challenges we ran into
Scraping historical Tweets: Part of the challenge from Twitter was to use their basic API package, which had limitations in it's search functionality. We wanted hourly data points going back as far as possible, but the basic plan only allowed for search within the last 7 days. In addition, the parameters only allowed for search granularity by day. To work within this limitation, we wrote a script that recursively steps back in time using the max_id parameter and saves data on the hour.
We also needed a way to display data with vastly different magnitudes (Bitcoin obscures Ethereum in price and twitter volume) in a comparable way within a single chart. Data was again normalized to provide direct comparison.
In our programs, front-end and back-end teams have not yet had the opportunity to work together, so it was a welcome challenge to figure out how to work as a cohesive team and get the front and back-ends to communicate with each other. On the front-end team, it was a challenge to conceptualize how the back-end works and create a front-end in anticipation of back-end data.
Accomplishments that we're proud of
We are most proud of the collaboration within the team to come up with working applications within the time limit and without ever working as a group before. We are proud of the solution we implemented to circumnavigate the limited access to time-based granularity of tweets.
What we learned
We learned how to build and format separate front-end and back-end applications that can communicate with one another. In our school experience, the front-end and back-end programs are very separated, so we enjoyed being able to combine our collective knowledge and experience for formulate a setting that will be more indicative of an actual work environment.
What's next for Block Tweet
Going public and becoming Bitcoin millionaires! Jk. We are 7 weeks from graduation and looking forward to our careers in software.


Log in or sign up for Devpost to join the conversation.