🧠 Inspiration
We wanted to build a real-time trading dashboard that not only visualizes market data but also monitors the system’s network and performance metrics directly from the Linux kernel using eBPF. Our goal was to combine financial analytics with deep observability for better reliability and performance insights.
⚙️ What it does
The project provides a web-based trading dashboard that displays live stock data, portfolio performance, and technical indicators. At the same time, an eBPF module runs in the background to monitor kernel-level network activity, latency, and packet flow — giving traders real-time insights into how network performance may affect their trading operations.
🛠️ How we built it
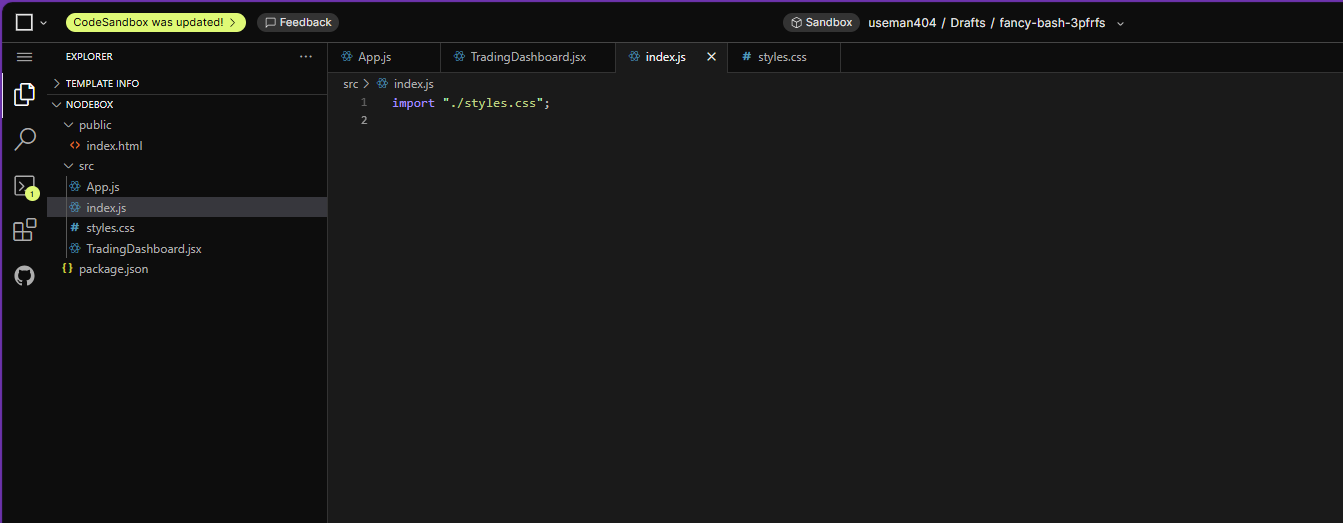
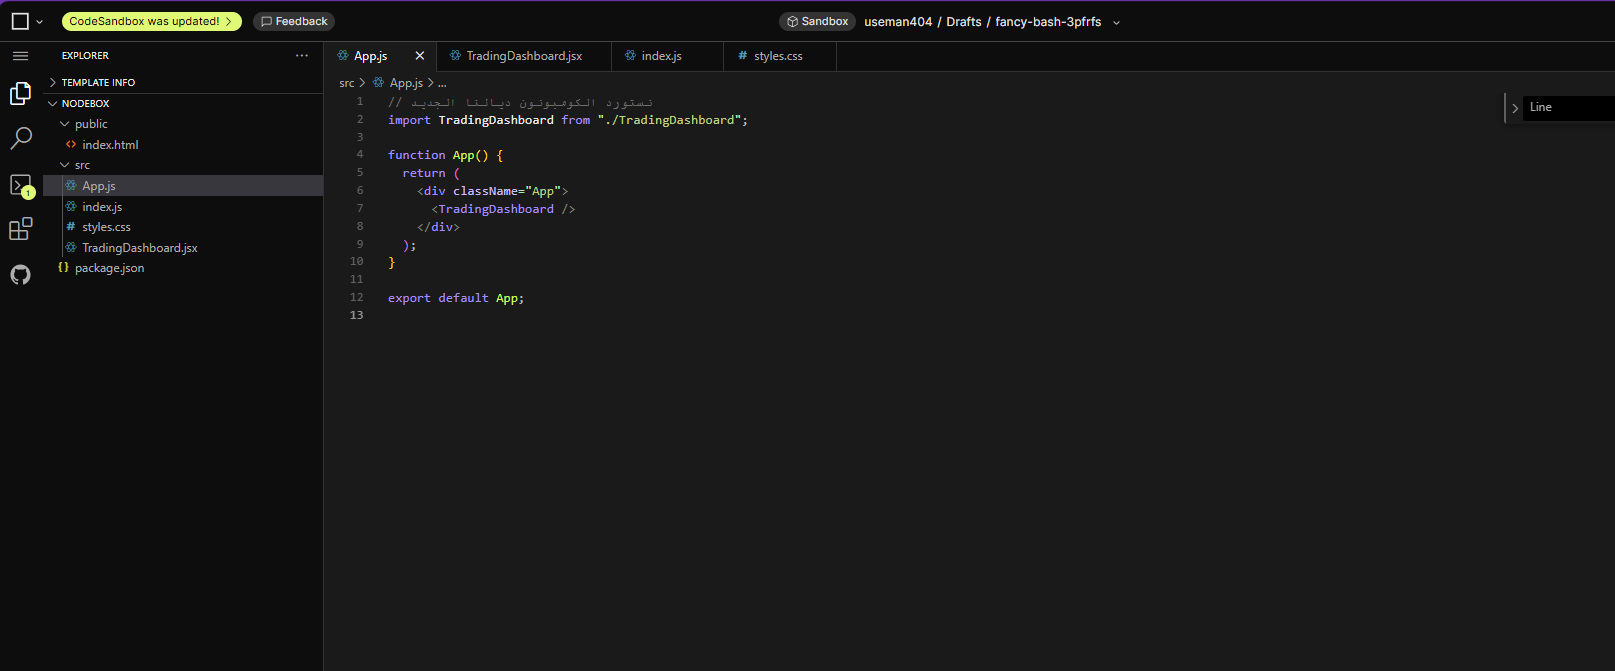
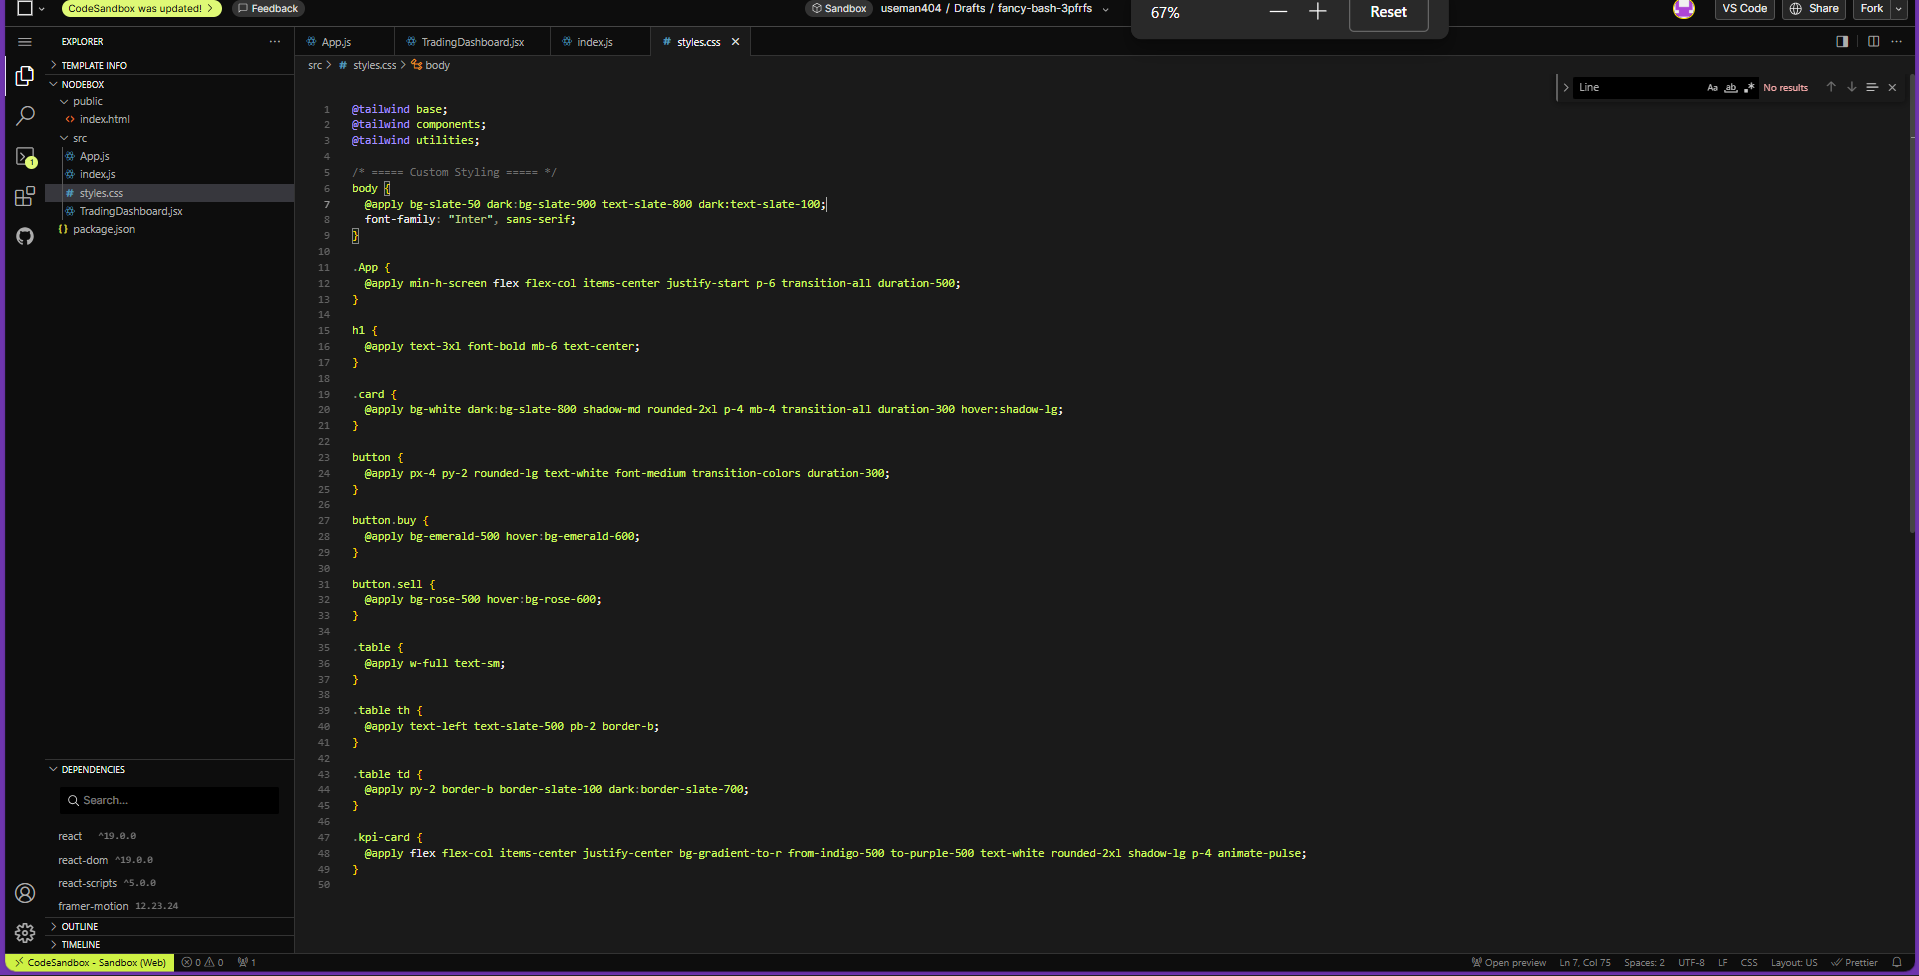
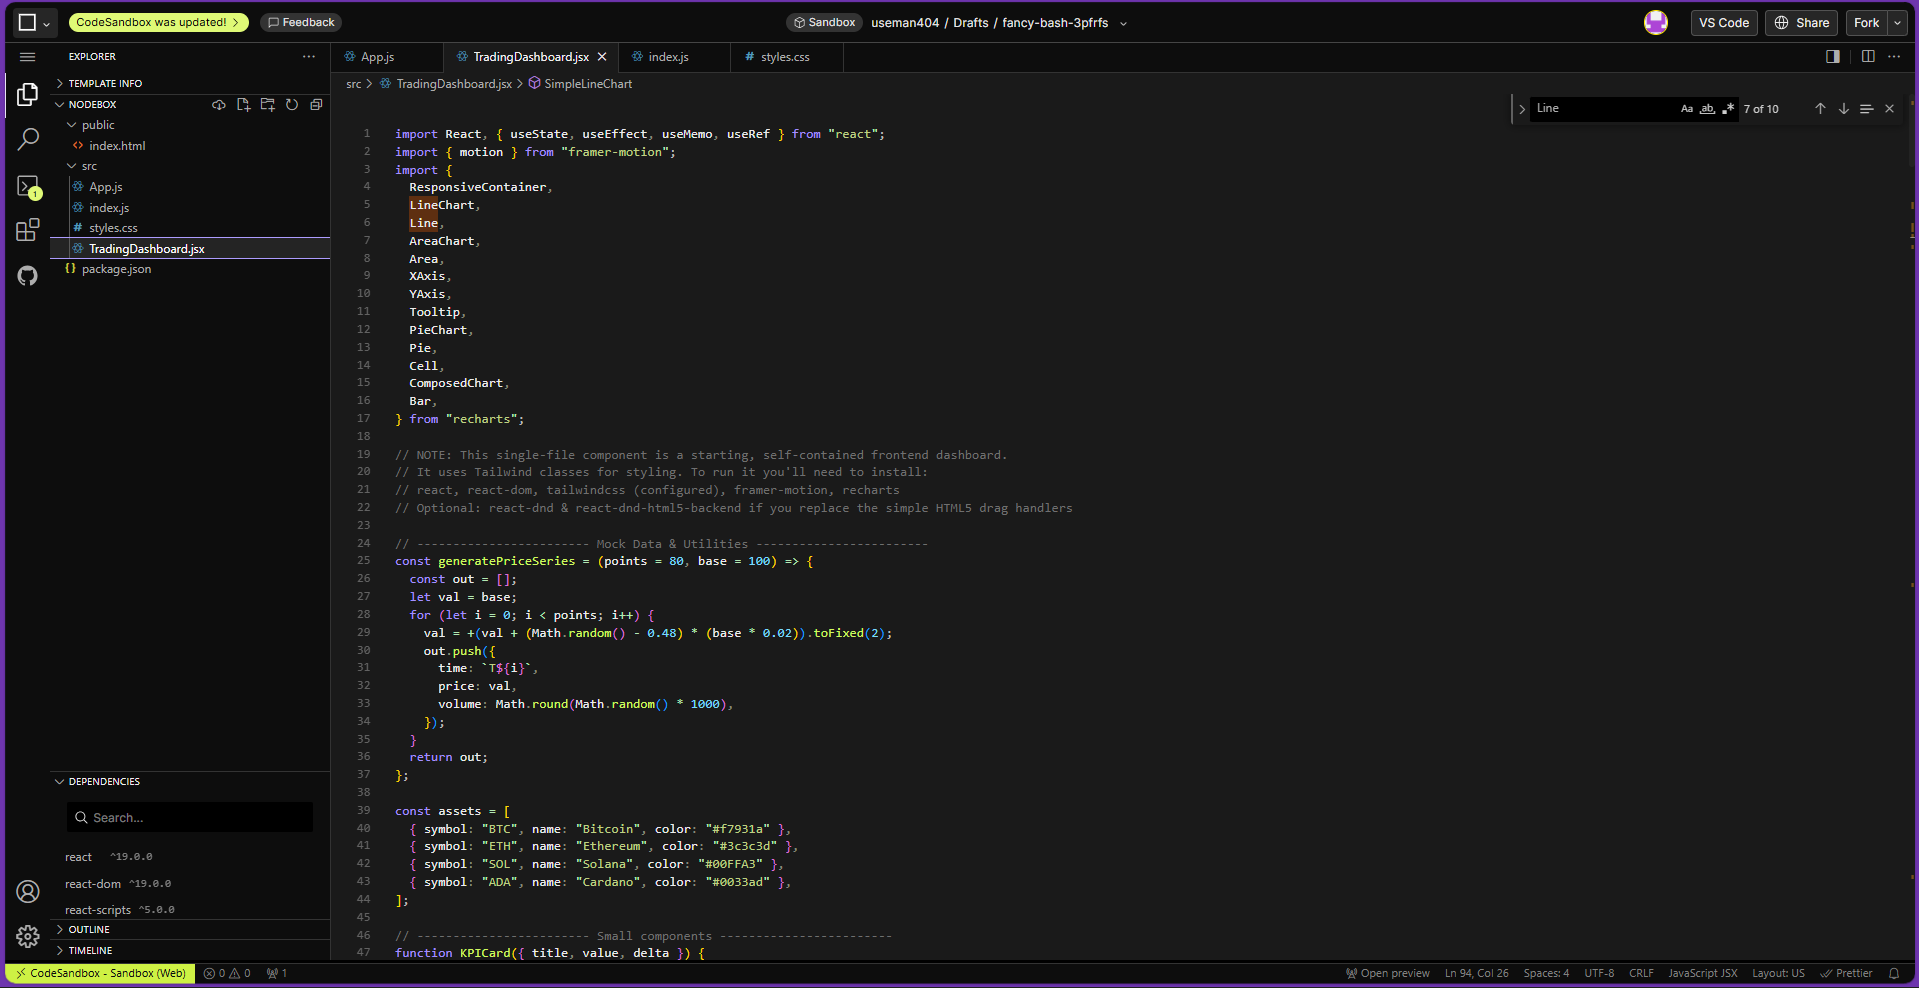
Frontend: React.js + Chart.js for dynamic trading visualizations.
Backend: Node.js and Python for API data aggregation.
eBPF integration: C and BPFtrace scripts for capturing system calls, socket events, and latency metrics.
Visualization: Collected eBPF data is sent to the frontend to display performance charts and alerts.
🚧 Challenges we ran into
Understanding how to attach eBPF programs safely without affecting system performance.
Integrating kernel-level metrics with the frontend in real time.
Debugging permission and security restrictions when loading eBPF programs.
Synchronizing market data with performance data streams.
🏆 Accomplishments that we're proud of
Successfully integrated eBPF metrics with a live trading dashboard.
Created a clean and responsive UI for traders to visualize both financial and system metrics.
Learned to use eBPF tools like BCC and bpftool to trace kernel events efficiently.
📚 What we learned
How eBPF can be used beyond security — in performance monitoring and system observability.
The power of combining low-level kernel tracing with web visualization tools.
The importance of optimizing data flow between the kernel, backend, and frontend layers.
🚀 What's next for Block (the project)
Add more advanced eBPF probes for CPU and memory profiling.
Integrate alerts for abnormal network latency that could affect trading performance.
Use Cilium for secure container networking if the dashboard is deployed in a cloud or microservices environment.
Extend the dashboard with AI-powered trading recommendations.

Log in or sign up for Devpost to join the conversation.