-
-
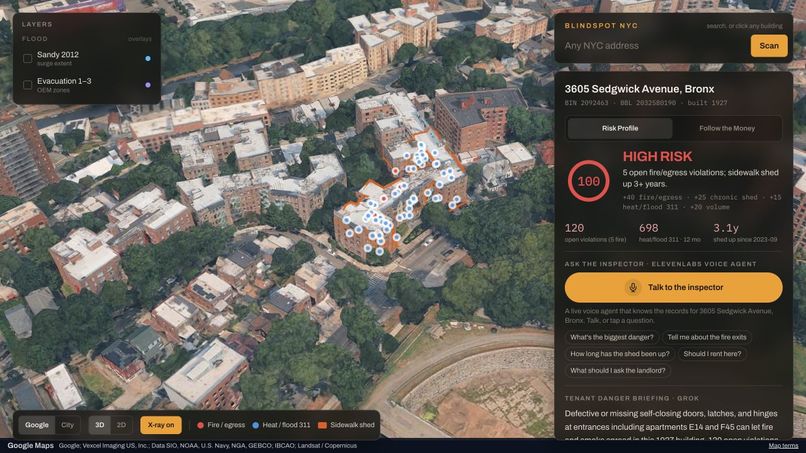
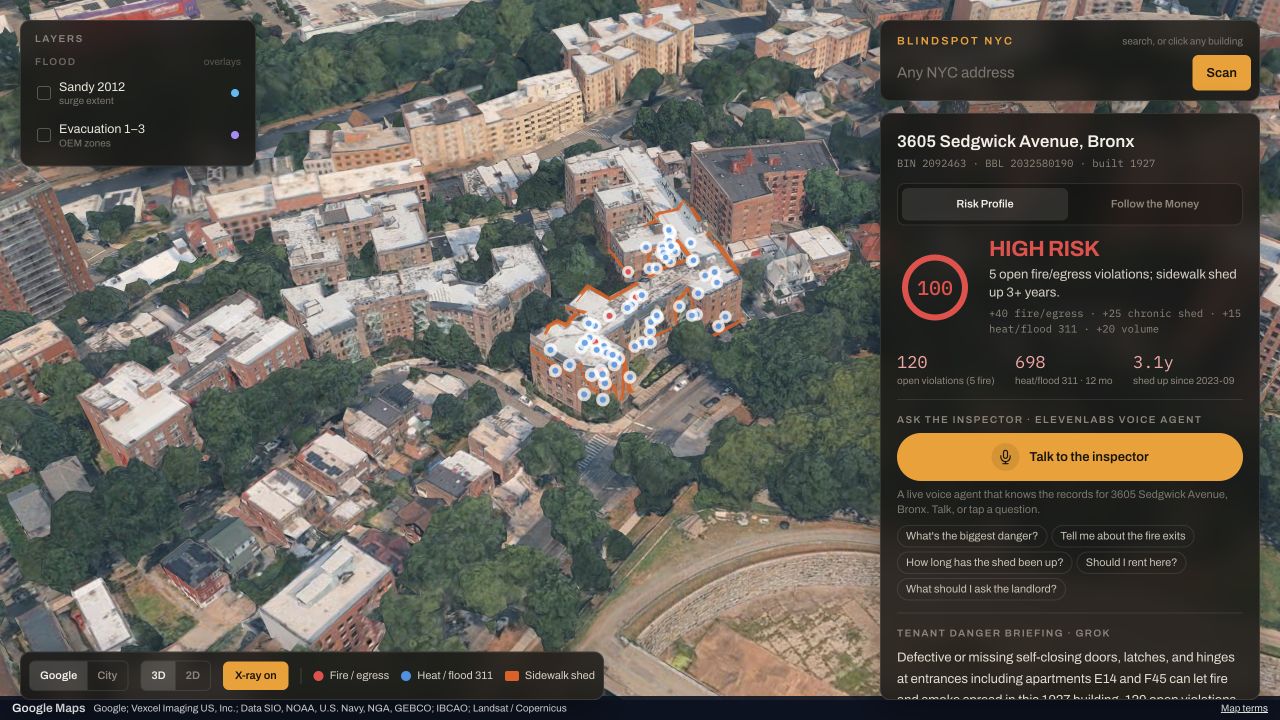
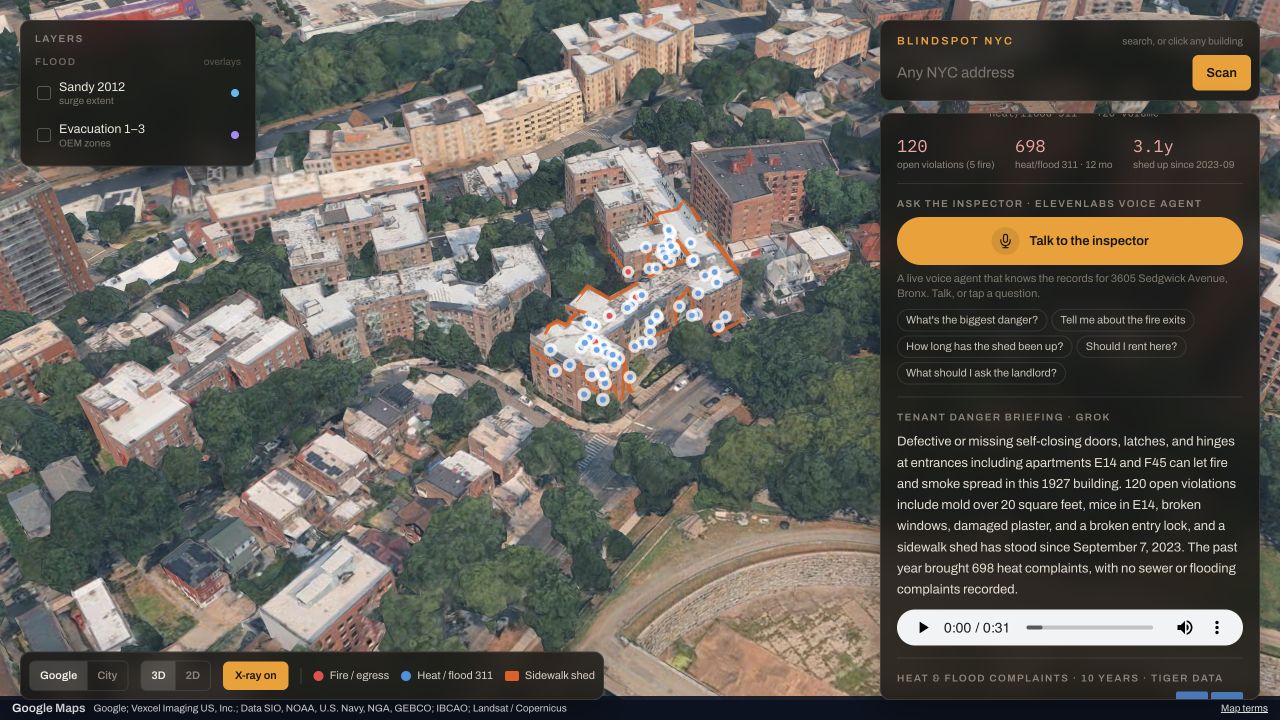
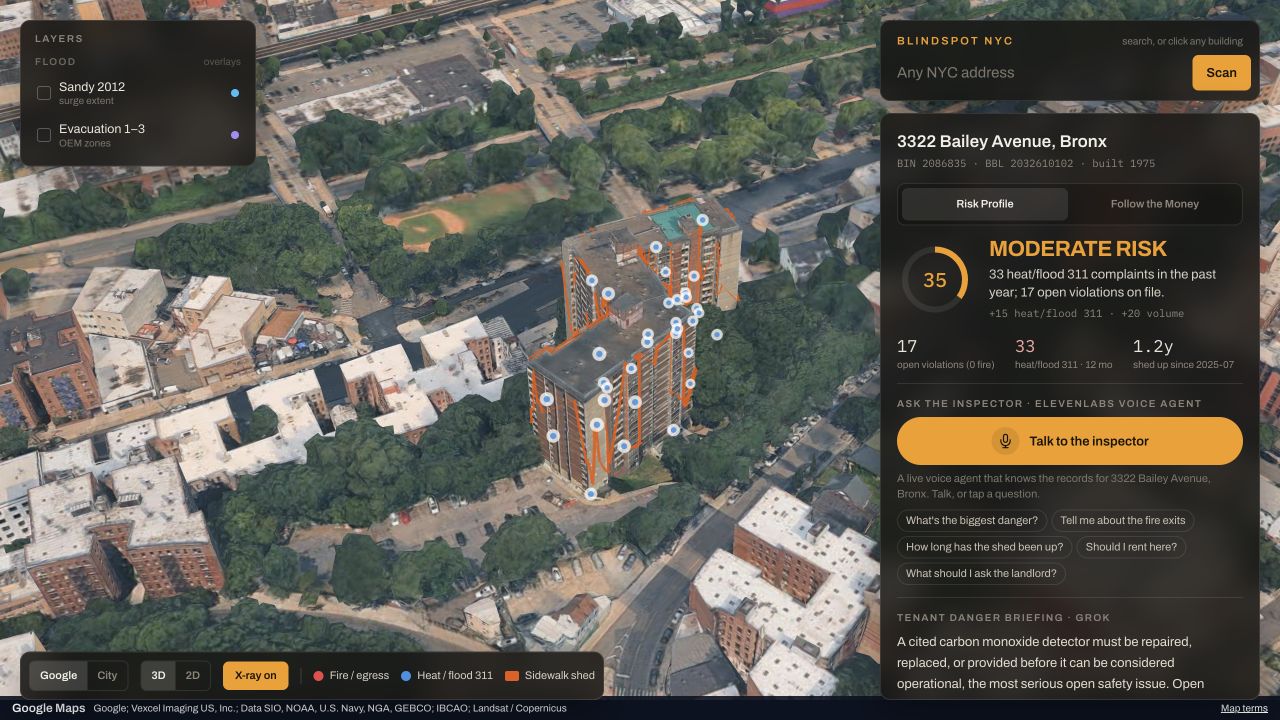
Google 3D X-ray: an explainable score, public-record markers, and an active shed for the selected building.
-
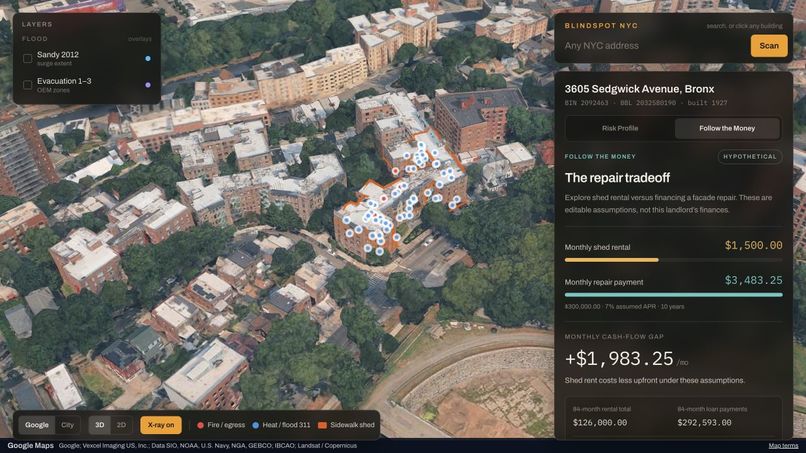
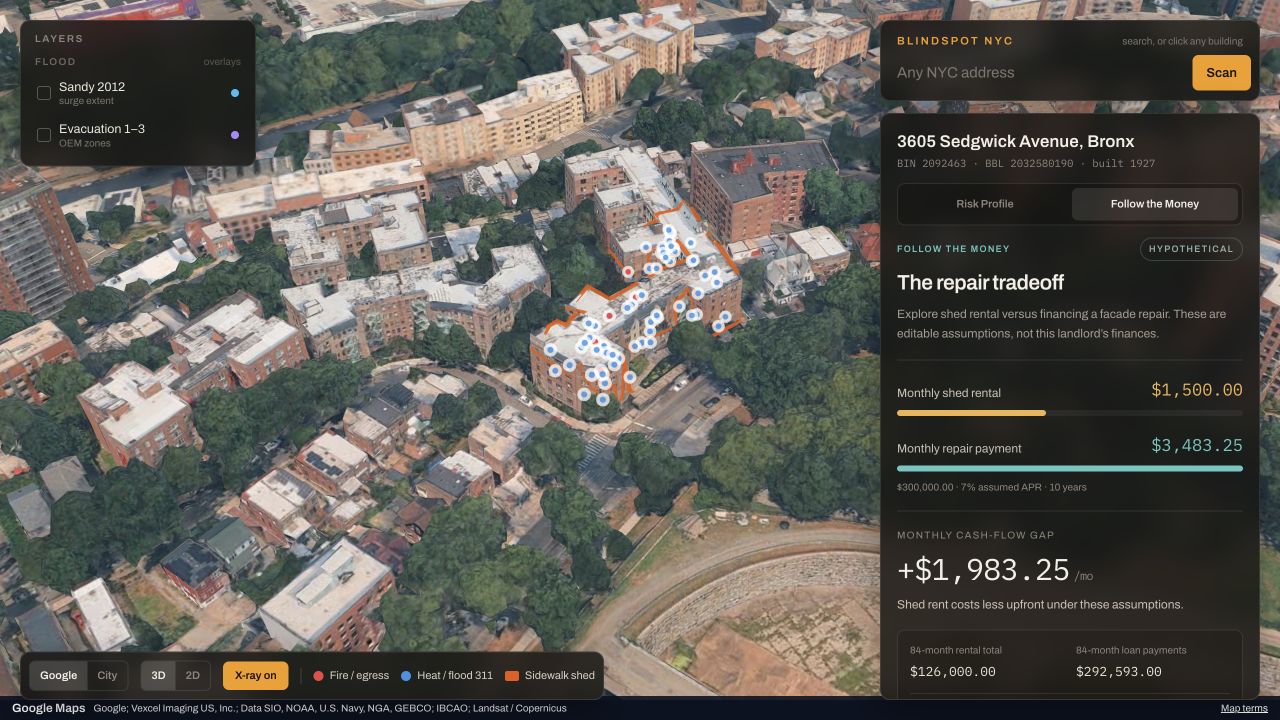
Follow the Money compares assumed monthly shed rent with a locally calculated facade-repair loan payment.
-
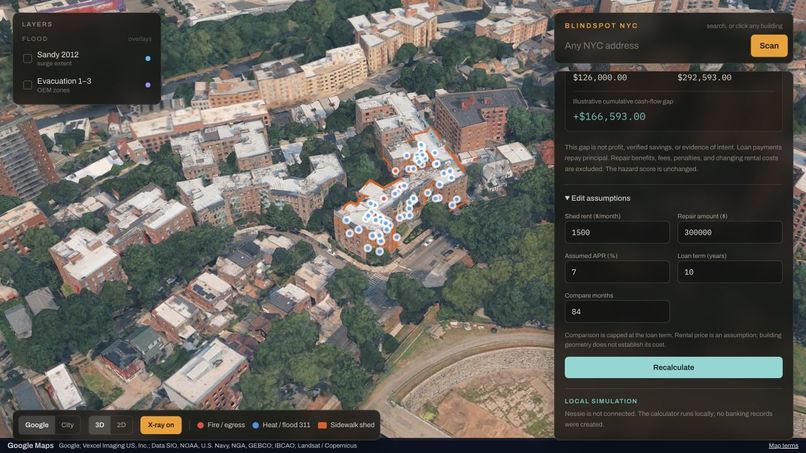
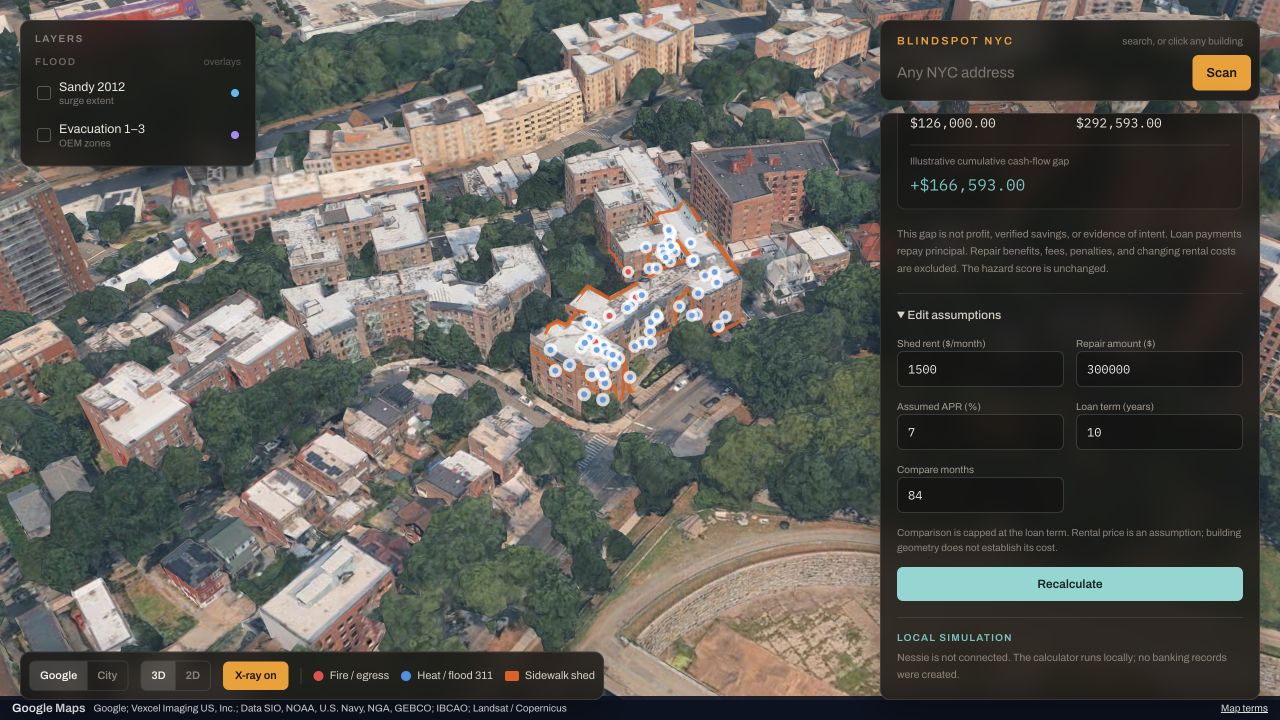
Edit rent, repair amount, APR, term, and comparison months. Figures are hypothetical; Nessie is not connected.
-
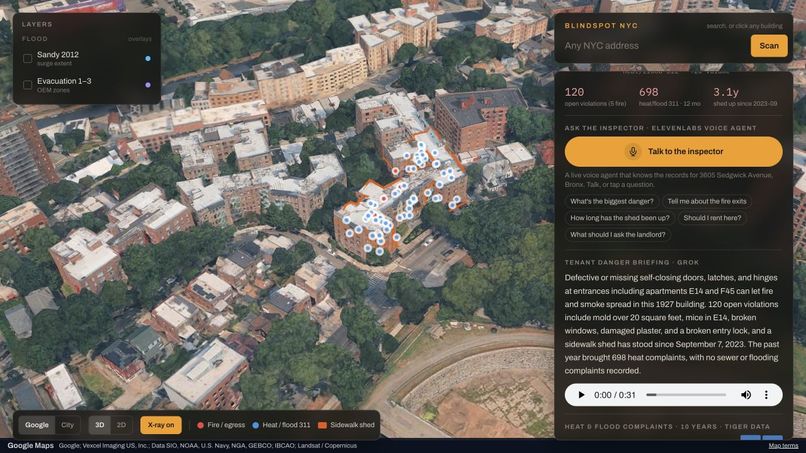
Grok explains retrieved records. ElevenLabs supplies the briefing audio and the inspector voice-session interface.
-
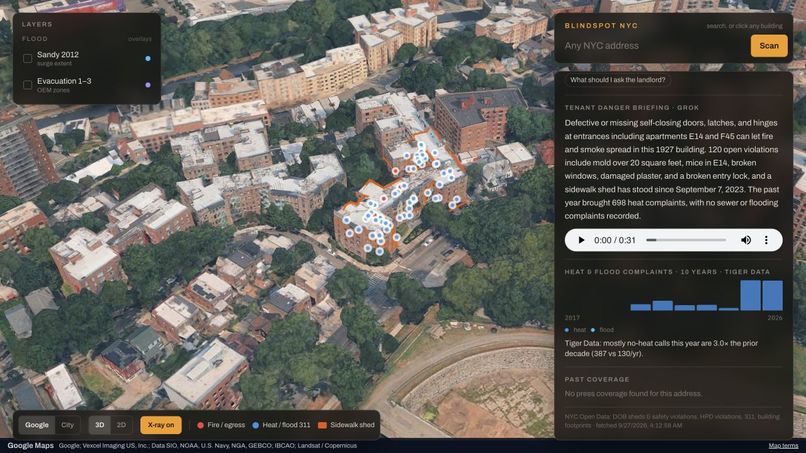
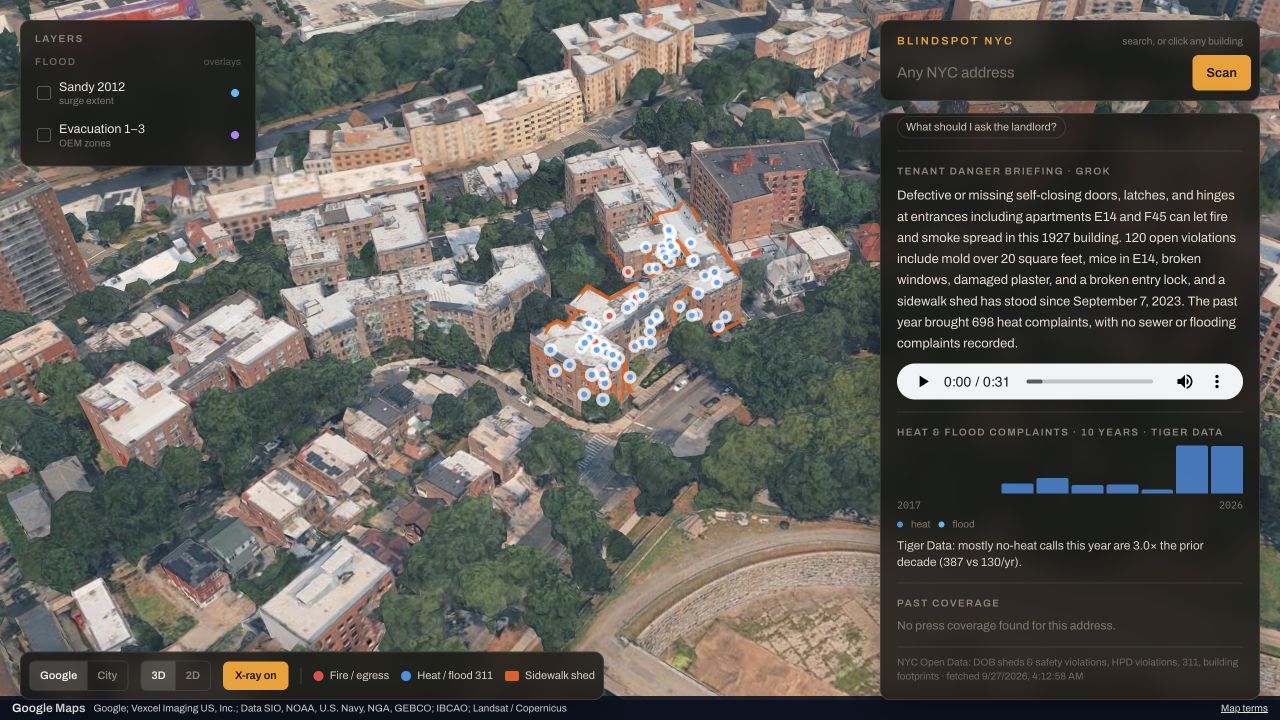
Tiger Data charts ten years of heat/flood complaints alongside the source and snapshot timestamp.
-
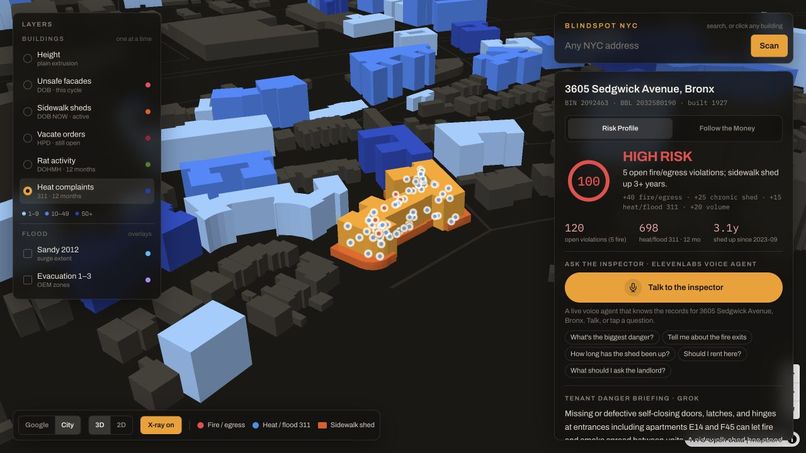
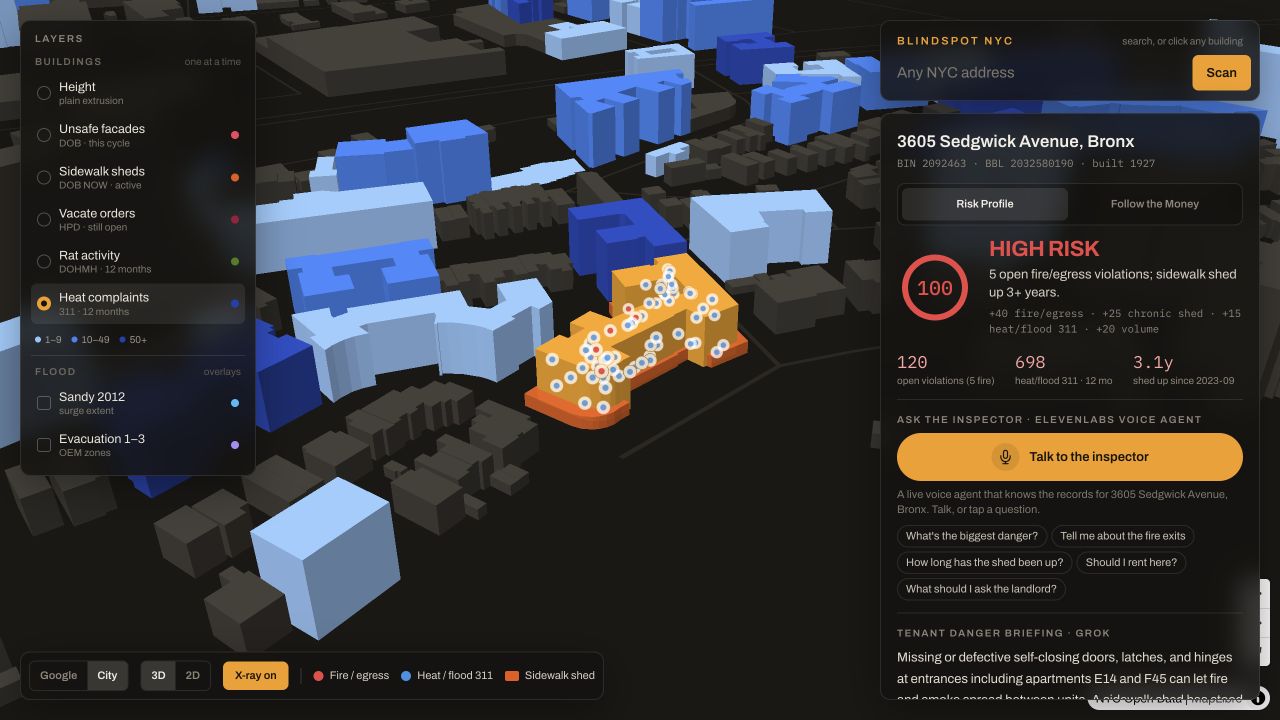
City view links heat-complaint counts to NYC building footprints, with selectable civic layers and the same risk report.
-
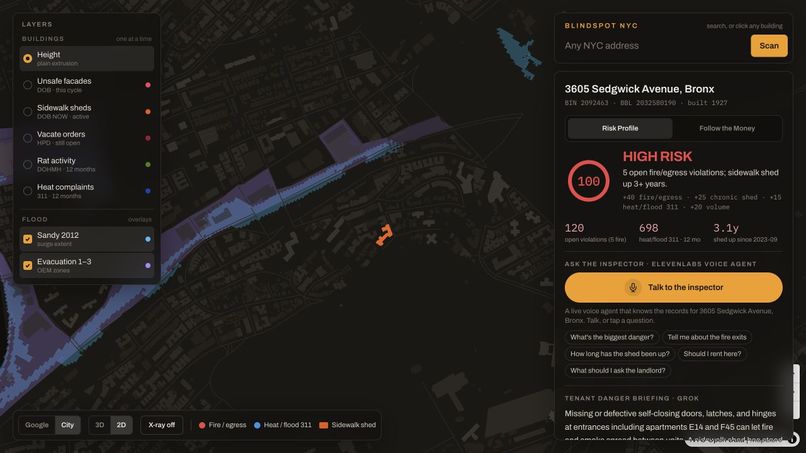
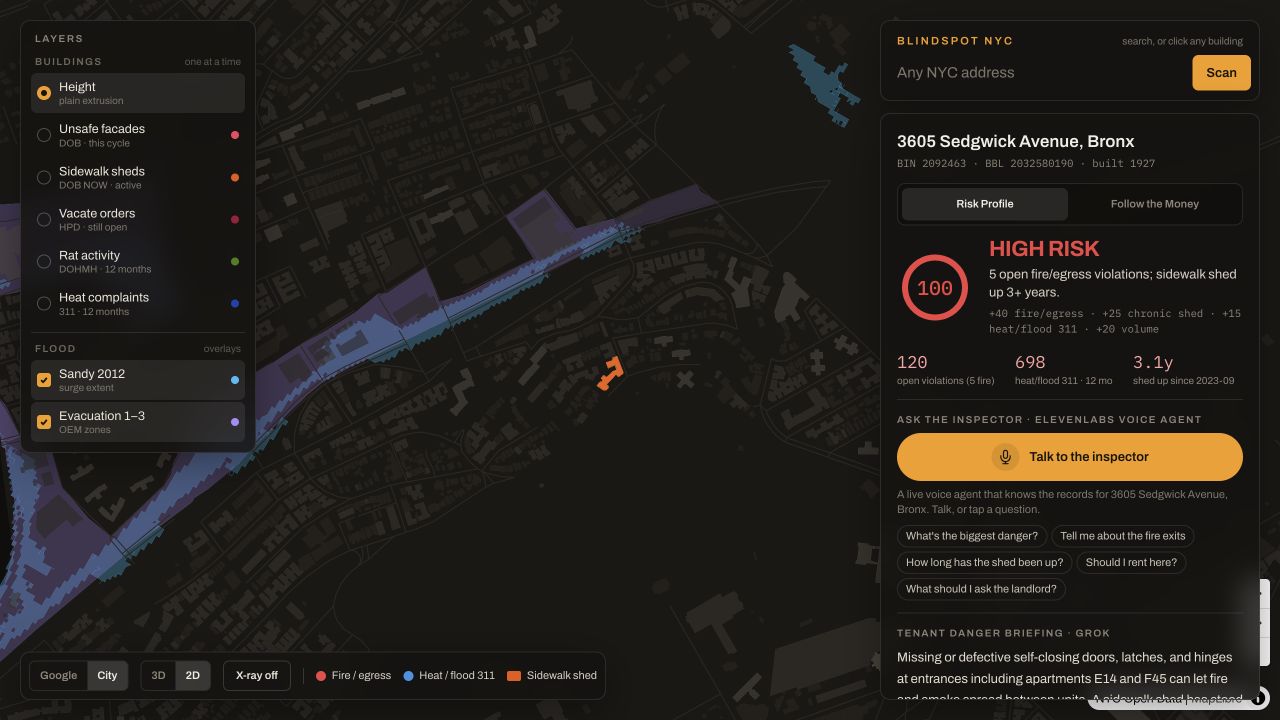
Sandy 2012 inundation and evacuation zones add geographic context. These overlays do not add points to the current hazard score.
-
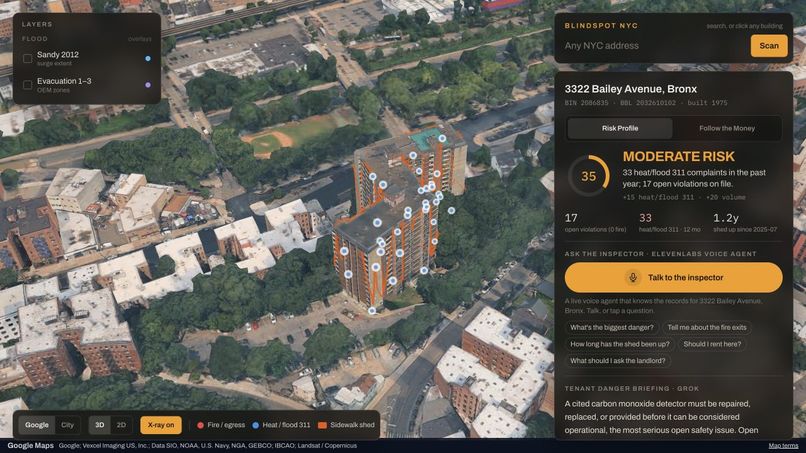
3322 Bailey Avenue scores 35: complaint volume contributes points, while no flagged fire records or chronic shed term appear.
-
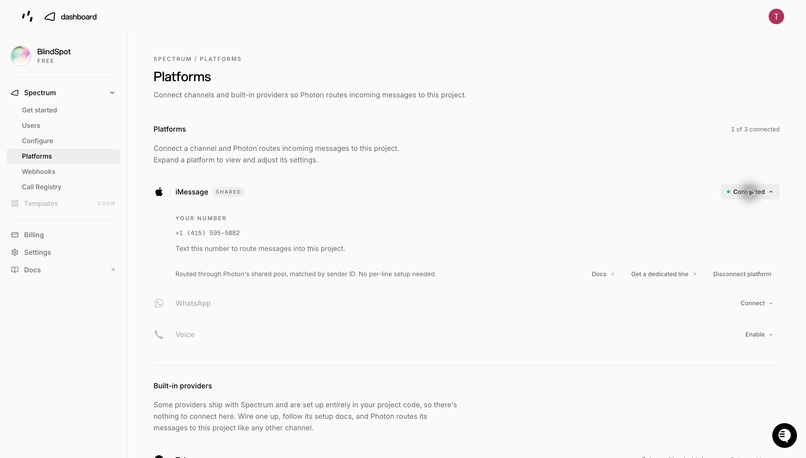
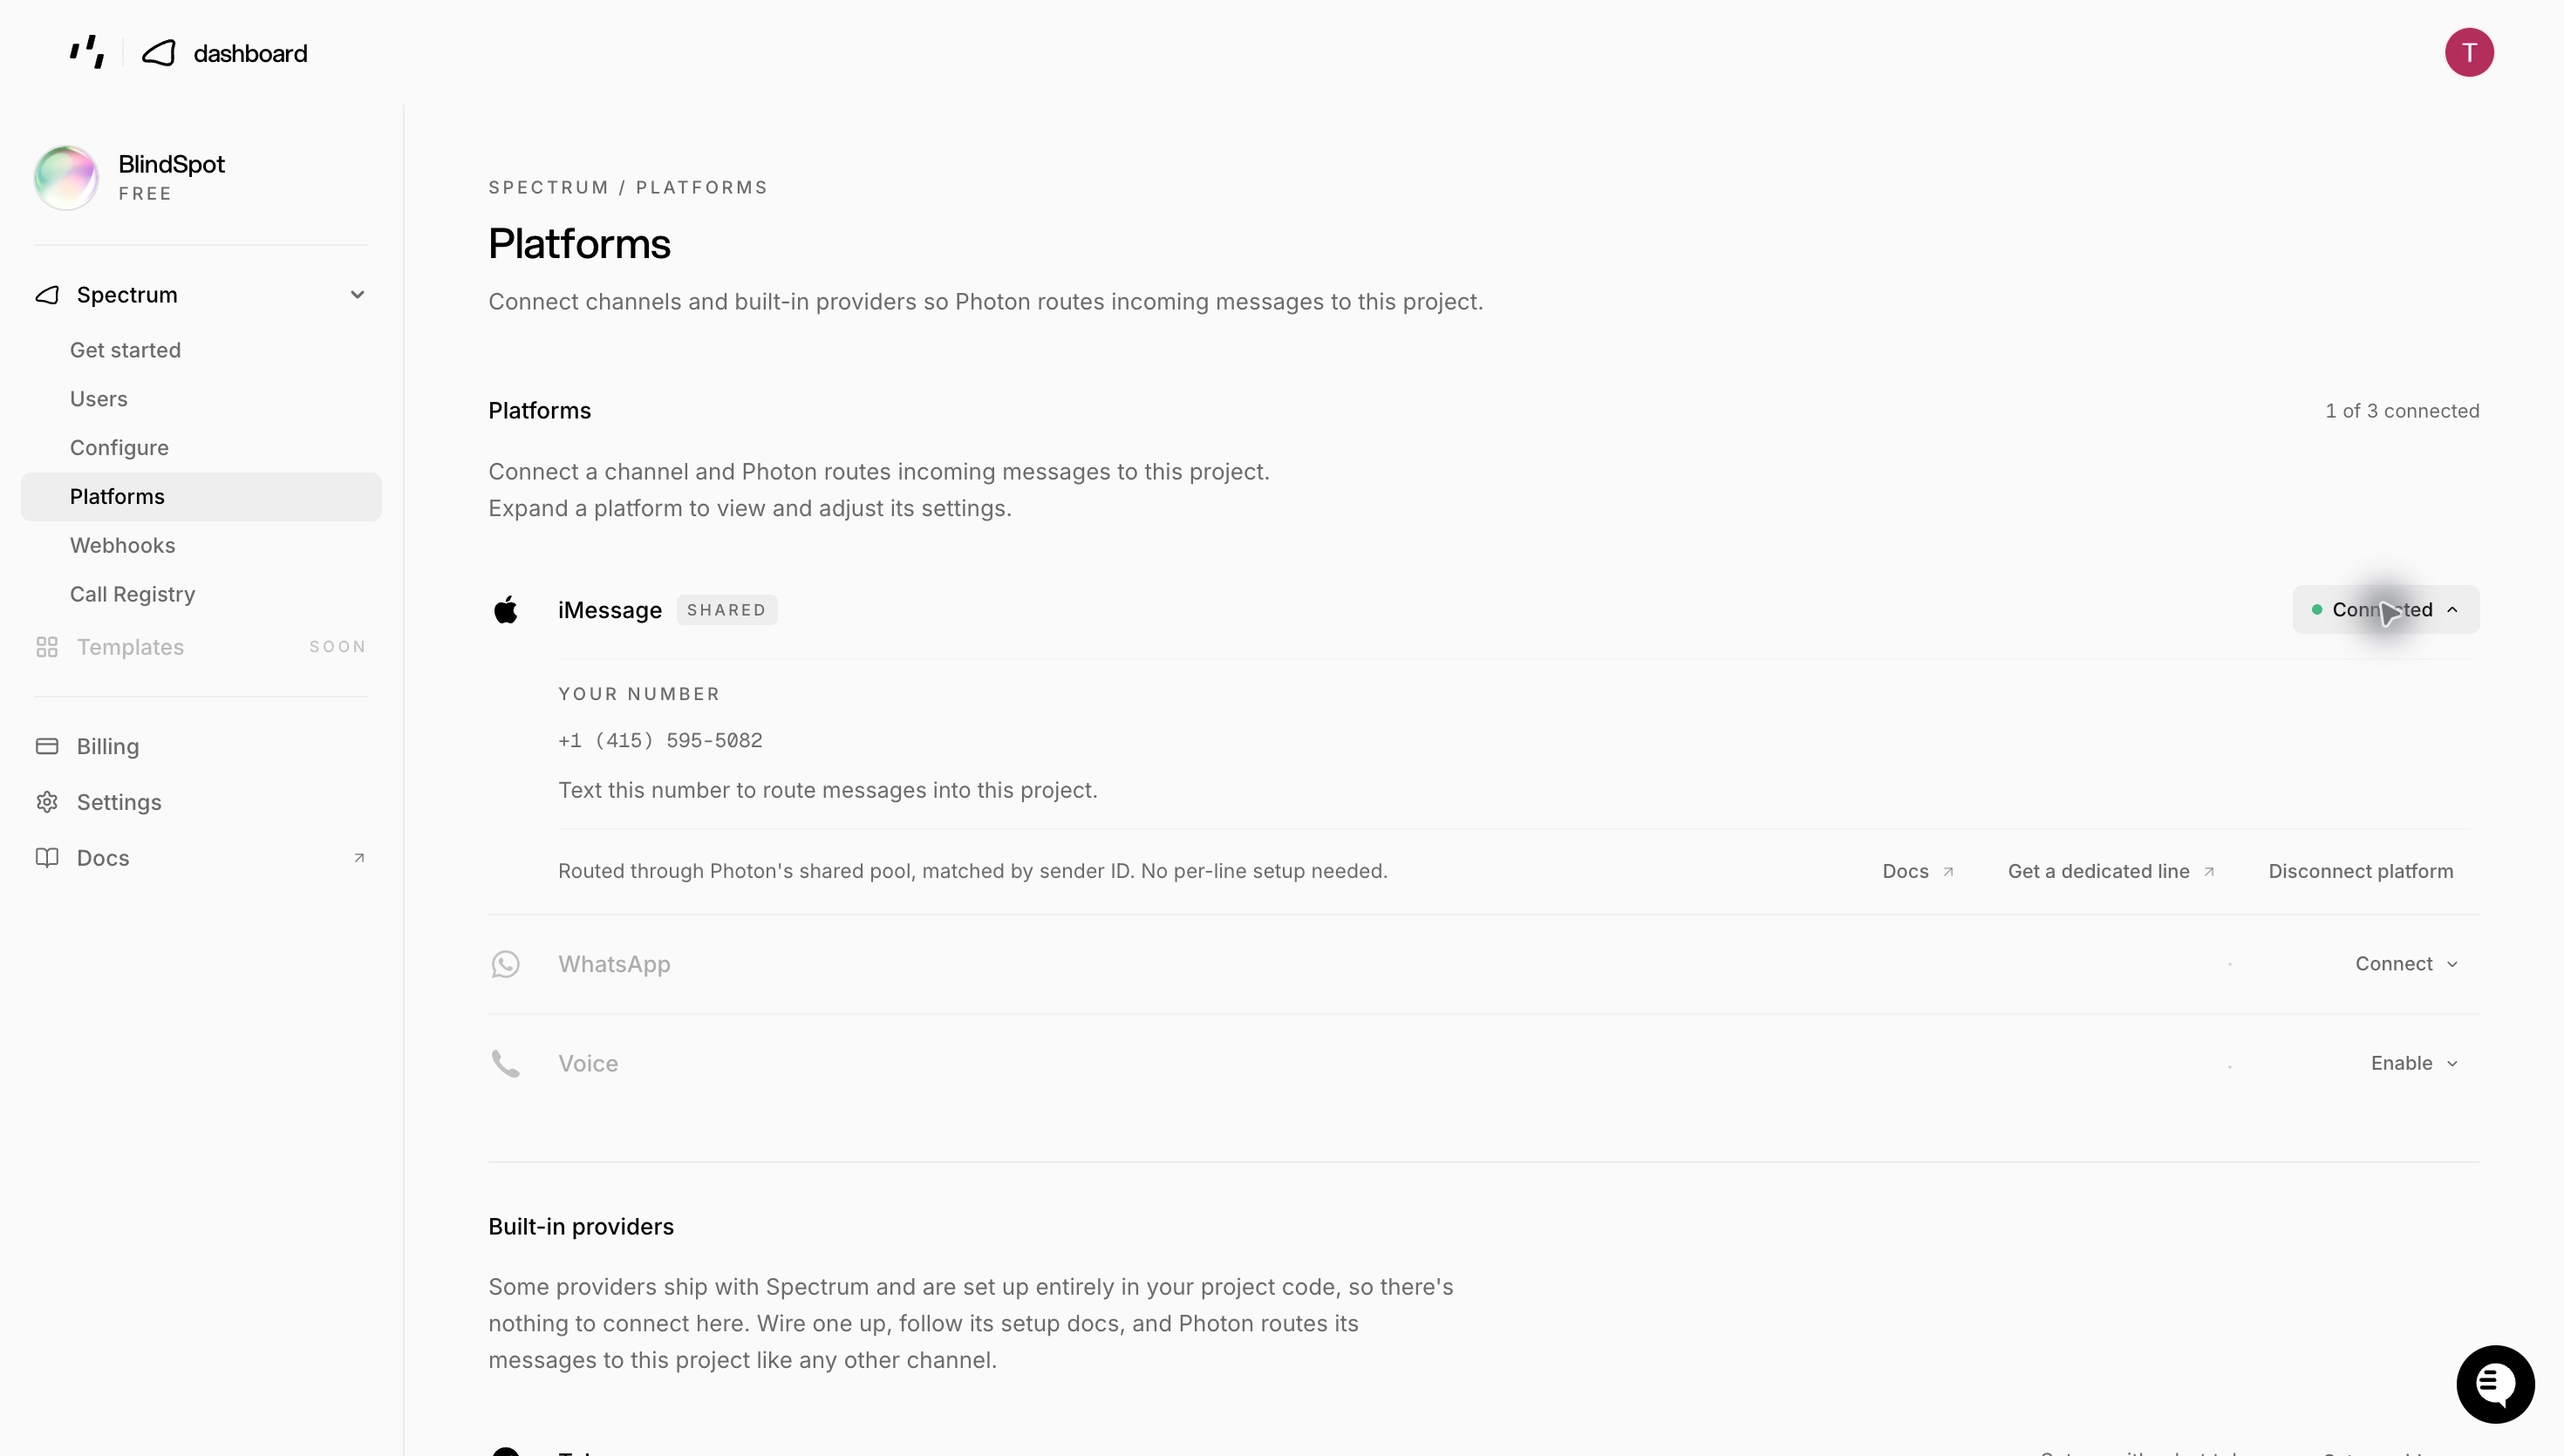
Photon Spectrum shows the connected shared iMessage line. Terminal report lookup passed; phone delivery verification is pending.
Inspiration
A rental listing shows the apartment. It rarely shows the broken fire doors, years of heat complaints, or sidewalk shed that has become a permanent part of the block. Those records exist, but they are scattered across city datasets and difficult to interpret together.
BlindSpot makes that hidden history visible at the address where someone needs it. Our aim is to help tenants, neighbors, and civic researchers ask better questions using public evidence.
What it does
Search an NYC address, or click a building, to open a report tied to its Building Identification Number (BIN). Explore Google Photorealistic 3D Tiles or the City map, then inspect fire and egress records, heat and flood-related 311 complaints, and the age of an active sidewalk shed.
The sidebar explains a 0–100 project-defined hazard score, shows each contributing term, and provides a short Grok briefing grounded in the retrieved records. ElevenLabs reads the briefing aloud and powers an interactive voice inspector supplied with the selected building's report. Ten years of complaint history and matching news add context beyond a single score.
Follow the Money adds an editable repair-cost scenario: compare monthly shed rent with the payment on a fixed-rate facade-repair loan, then examine the cash-flow difference over a chosen period. The calculation is explicitly hypothetical. It does not reveal an owner's actual finances or establish their motives. The live demo computes the scenario locally using Python Decimal. A legacy Nessie API adapter is included for fictional banking records, but live Nessie transactions have not been verified. A compatible self-hosted mock service is a future integration, not a dependency of the calculator.
How we built it
- Frontend: React, TypeScript, Vite, Tailwind CSS, and a Watermelon UI Shimmer Button adapted for the voice inspector.
- Maps: deck.gl and loaders.gl stream Google 3D tiles and render the X-ray overlays. Blocklight and MapLibre provide the alternate City view, including building layers and flood overlays.
- Backend: Python and FastAPI resolve addresses with NYC GeoSearch and join NYC Open Data records by building identifiers and location.
- MongoDB Atlas: the backend uses document snapshots, analysis caching, and geospatial indexes. We implemented GridFS storage for serverless briefing audio; the initial Vercel verification encountered an Atlas connection failure and fell back to in-memory caching and temporary audio storage.
- Tiger Data / TimescaleDB: stores 311 history in a hypertable and supplies the annual complaint trends.
- xAI Grok: writes plain-English briefings from retrieved records, with a deterministic rules-based fallback.
- ElevenLabs: produces the audio briefings and supplies the conversational inspector's voice session.
- Tavily: searches for address-matched coverage.
- Finance: Python Decimal computes fixed-rate amortization locally. An optional legacy Nessie REST client can create and read back fictional banking records; it is not verified against a live banking service.
- Deployment: GitHub Actions checks the code. Vercel hosts the Vite frontend and FastAPI backend as two services under one HTTPS origin.
We used Cursor and Gemini during hackathon development, alongside OpenAI Codex for implementation, debugging, documentation, tests, and deployment preparation. The project's runtime briefing provider is Grok; ElevenLabs provides its audio and conversational voice features. Our separate Photon Spectrum agent forwards NYC addresses from iMessage to the same deployed report API. We connected the project's shared iMessage line and started its listener on a Mac. The terminal-provider address test returned the live report, but Photon rejected the outbound phone test with “Target not allowed for this project,” so end-to-end phone delivery is not yet verified. The listener runs outside Vercel and requires its host to remain awake.
Explainable scoring
The shipped backend computes:
Hazard Score = min(100, S_fire + S_shed + S_env + S_repeat)
| Term | Points | Trigger |
|---|---|---|
| Fire / egress | 40 | A qualifying critical fire/egress violation flag |
| Chronic shed | 25 | Active shed age exceeds 730 days |
| Heat / flood complaints | 15 | At least three qualifying sewer, catch-basin, or no-heat 311 complaints in the past year |
| Repeat volume | 20 | Included violations plus complaints exceed five |
The dial uses green for 0–20, yellow for 21–59, and red for 60–100. The detailed README documents the current record filters and scoring rules.
Our conceptual roadmap is Disaster Vulnerability = w1(Hazard / Flood Zone) + w2(Building Age & Type) + w3(Active Violations & 311s). Today, the violations/complaints component is live; flood exposure and building age remain contextual map/report layers rather than additional score weights. The score is a screening index, not an official city rating or a probability of harm.
Challenges we ran into
Joining datasets consistently required working with BINs, tax lots, addresses, and footprints while preserving missing-data signals. The Google renderer also required careful tile authentication, surface-aligned overlays, and marker placement within concave footprints and outside courtyards. We fixed map gestures so zooming the map does not enlarge the floating report controls.
Serverless hosting introduced another constraint: a generated MP3 cannot depend on the local disk of one function instance. We added Atlas GridFS storage for deployed briefing audio and pinned a supported Python runtime. The finance feature also needed clear separation between assumed costs, locally calculated payments, and optional verified mock API records.
Accomplishments we're proud of
The live app connects an address to a readable report, a spatial view, a transparent score, a ten-year trend, and an audio explanation. Users can inspect the score's components instead of relying on an unexplained number. The repair-cost scenario gives the project an economic dimension while keeping the assumptions visible and editable.
What we learned
Public records become more useful when their location, time window, provenance, and limitations travel with them. A striking 3D view helps people orient themselves, but explainable scoring and a concise briefing help them understand what to ask next. We also learned that production audio, database connections, and map credentials must be verified on the deployed origin.
What's next for BlindSpot
Add a weighted flood-exposure component and richer building-age/type inputs, expand landlord-registration links, and include more DOB complaint context. Add a compatible self-hosted banking sandbox, resolve the remaining Atlas and Photon deployment issues, improve caching and accessibility, and evaluate the screening rules against additional buildings and tenant feedback.
Current demo boundaries
The score is a transparent screening aid, not an official inspection or a prediction of harm. Counts can change as city records refresh. X-ray markers illustrate records within a building footprint; they do not identify exact incident coordinates, floors, or apartments. Financial inputs are editable estimates, not owner financial records. Flood overlays and building age provide context but do not add points to the current score.
The deployed lookup, Grok analysis, ElevenLabs briefing audio, voice-session endpoint, finance calculator, and Tiger Data trend were verified. Atlas durability and end-to-end Photon phone delivery remain unverified because of the connection and routing failures described above.
Try it
- Live app: https://blindspot-nyc.vercel.app/
- Source and local setup: https://github.com/7dracoder/BlindSpotNYC
- High-score walkthrough: https://blindspot-nyc.vercel.app/?q=3605%20Sedgwick%20Avenue%2C%20Bronx
- Contrast walkthrough: https://blindspot-nyc.vercel.app/?q=3322%20Bailey%20Avenue%2C%20Bronx
Open the live app, search an address, switch between Google and City, and toggle X-ray. In the report, inspect the score breakdown, scroll to the briefing/audio and historical chart, then open Follow the Money and edit its assumptions. Dataset counts can change as public records refresh. X-ray dot locations and floor assignments are illustrative placements within a footprint, not exact apartment or incident coordinates.
Screenshot walkthrough
- Google 3D risk report: The selected building is shown in context with its score and component points. Red dots represent qualifying fire/egress records, blue dots represent heat/flood complaints, and the orange outline marks an active shed. These are illustrative record placements.
- Follow the Money: A hypothetical $1,500/month shed rental is compared with a $300,000 repair financed at 7% over ten years. The locally computed payment is $3,483.25/month, giving a $1,983.25 monthly cash-flow difference under those assumptions.
- Editable financial assumptions: Users can change rent, repair amount, APR, loan term, and comparison months. The comparison is capped at the loan term; it is not a quotation or a statement about an owner's savings.
- Briefing and voice: Grok summarizes the retrieved building records, while the ElevenLabs inspector button and audio player provide two ways to hear or discuss the report. The screenshot shows the interface rather than claiming a recorded live conversation.
- Historical complaints: The annual chart uses Tiger Data to put this year's heat and flood-related complaints in a ten-year context. The footer identifies the public sources and snapshot time.
- City map layers: The alternate map connects civic datasets to building footprints and provides selectable building layers. It offers another way to explore the same city when photorealistic imagery is not needed.
- Flood context: Sandy 2012 inundation and hurricane evacuation overlays add geographic context. They are independent toggles and do not currently contribute additional points to the hazard score.
- Contrast building: 3322 Bailey Avenue scores 35 in this snapshot, with complaint and volume terms but no flagged fire/egress or chronic-shed points. The result differs from the 100-point Sedgwick report because the retrieved records differ.
- Photon connection: The Spectrum dashboard shows the project’s shared iMessage line connected. The separate listener uses the same deployed report API. A terminal-provider address test passed; actual phone delivery remains unverified after a project-routing rejection.
Built With
- cursor
- deck.gl
- elevenlabs
- fastapi
- gemini
- google-maps
- grok
- maplibre
- mongodb-atlas
- openai
- photon
- python
- react
- spectrum-ts
- tailwind-css
- tavily
- tiger-data
- timescaledb
- typescript
- vercel
- vite
- xai


Log in or sign up for Devpost to join the conversation.