Inspiration
Many rural and lower-income counties have little staff time to look across their own data. A county official may know the landfill and the old schools, but not how those sit against flood risk, air quality, heating costs and broadband, or which federal funding could pay for a fix. We wanted to show the blind spots: the gaps a county has not looked at, and the local places that could help close them.
What it does
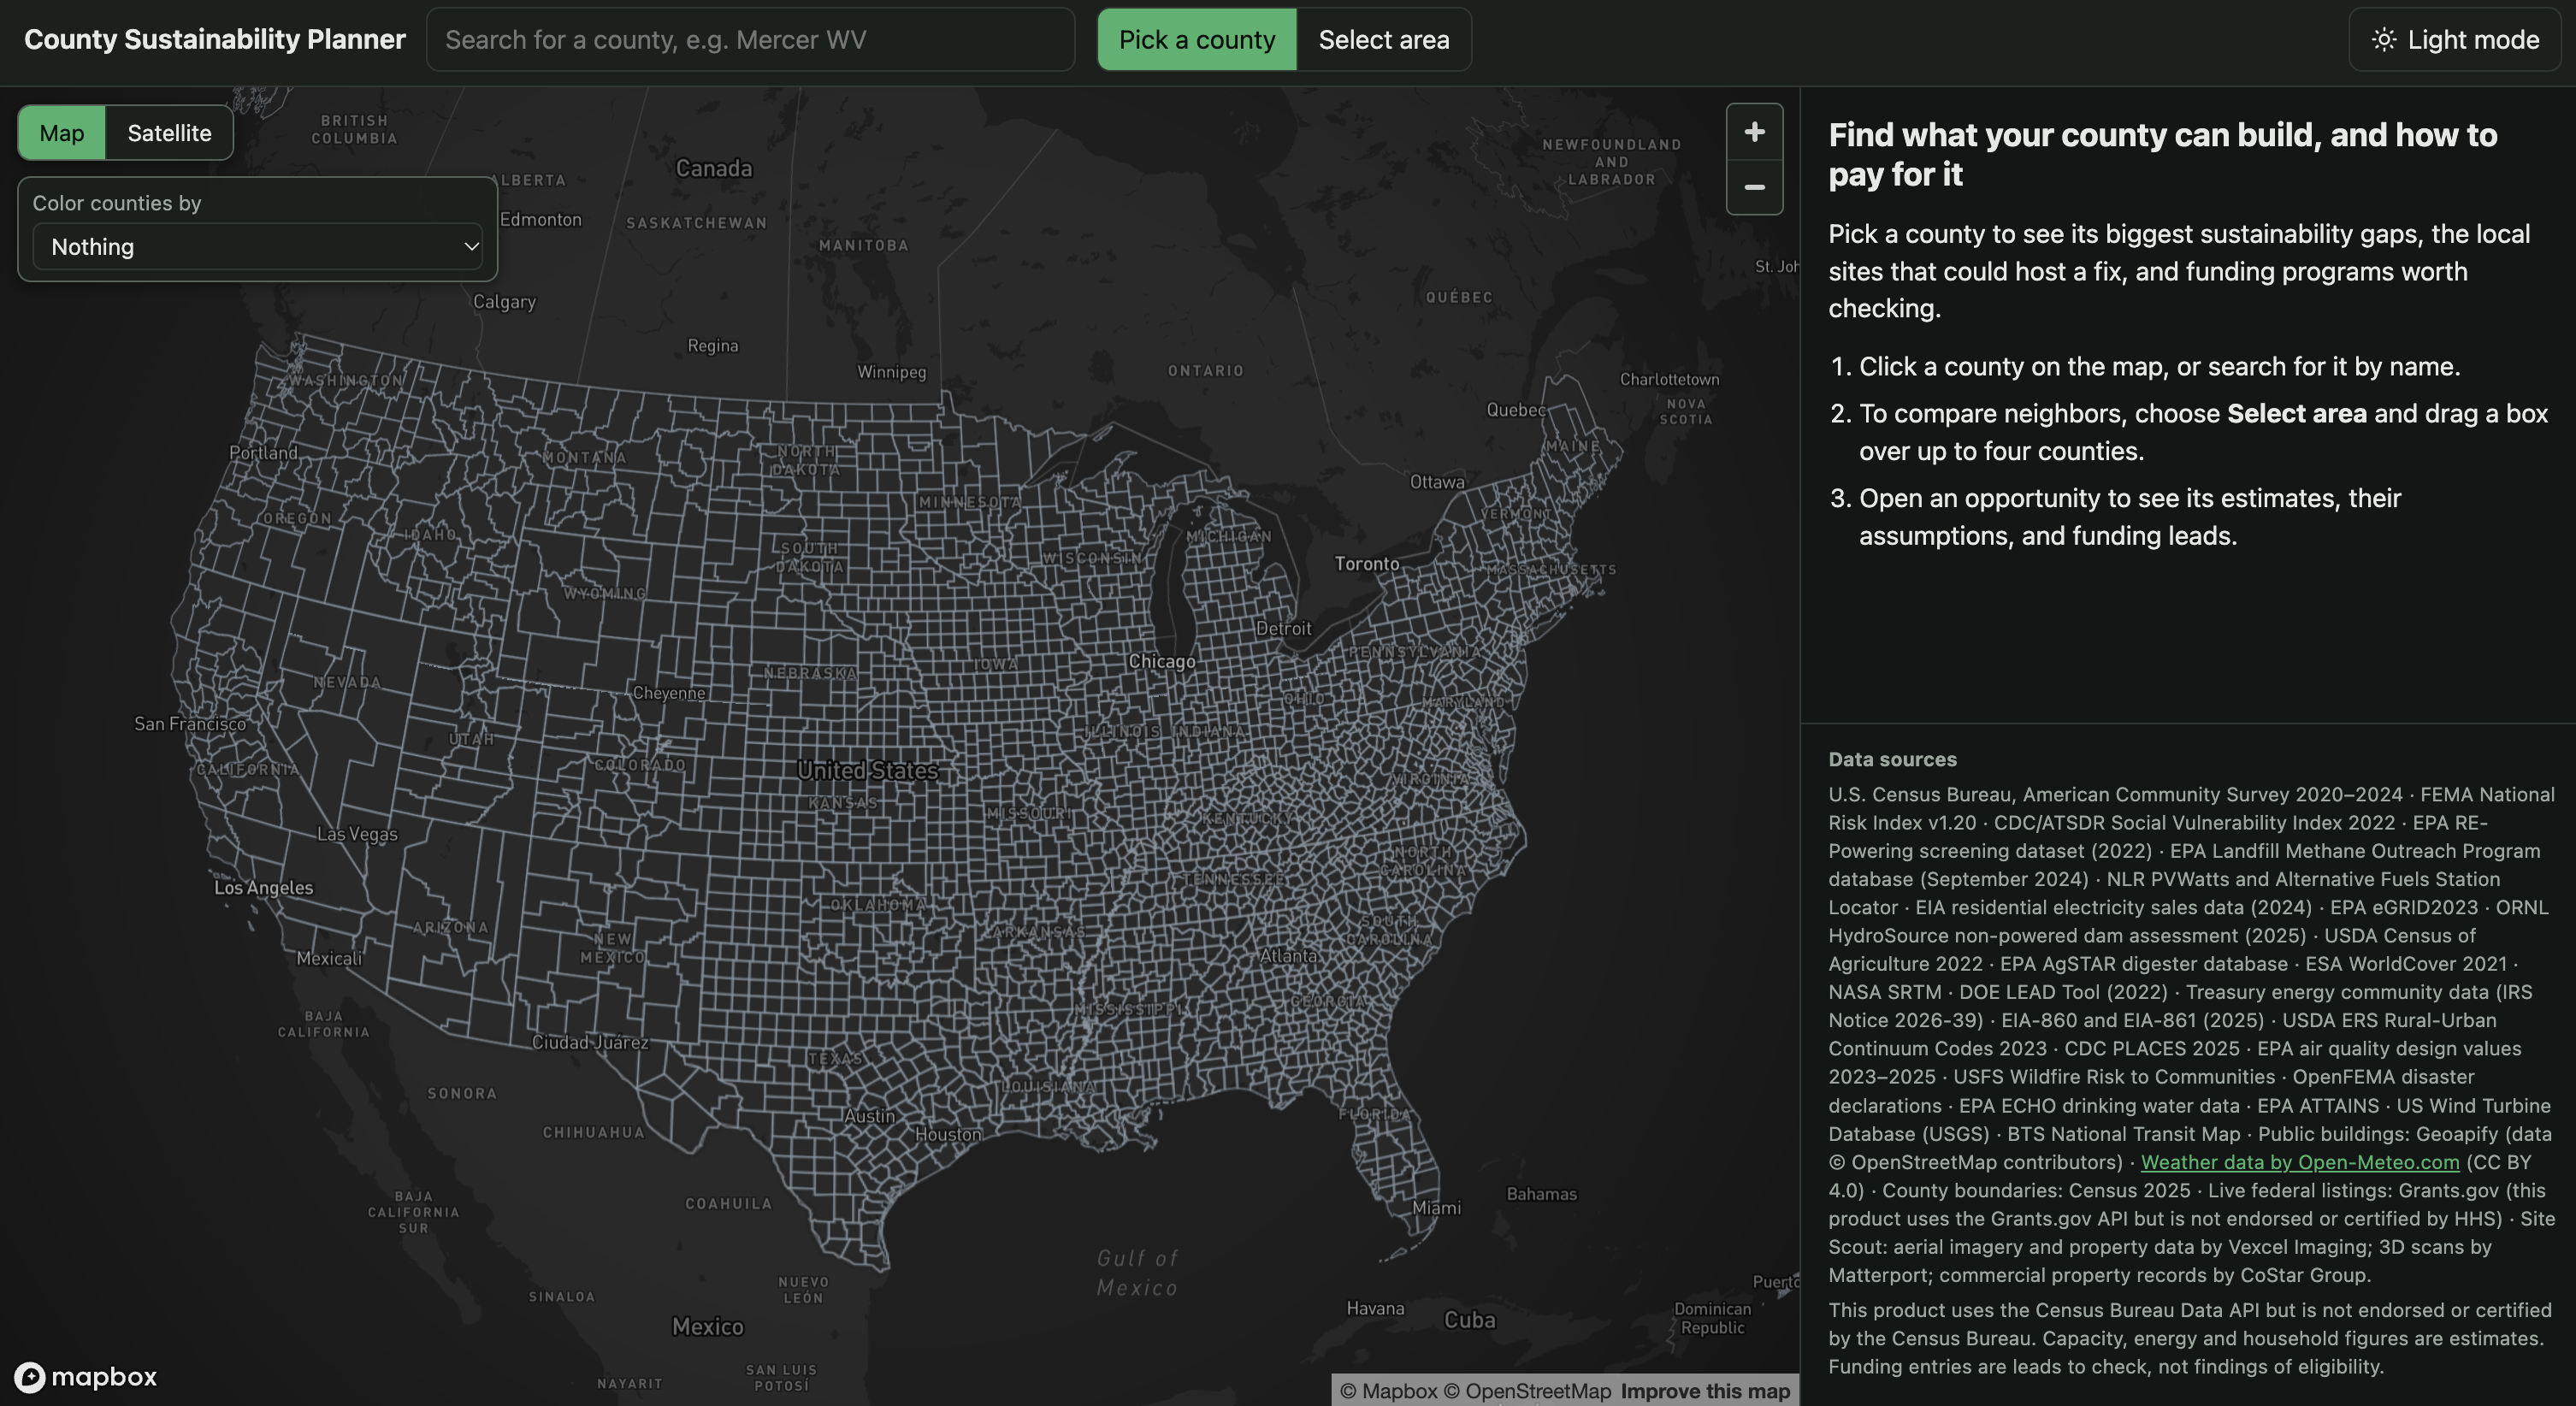
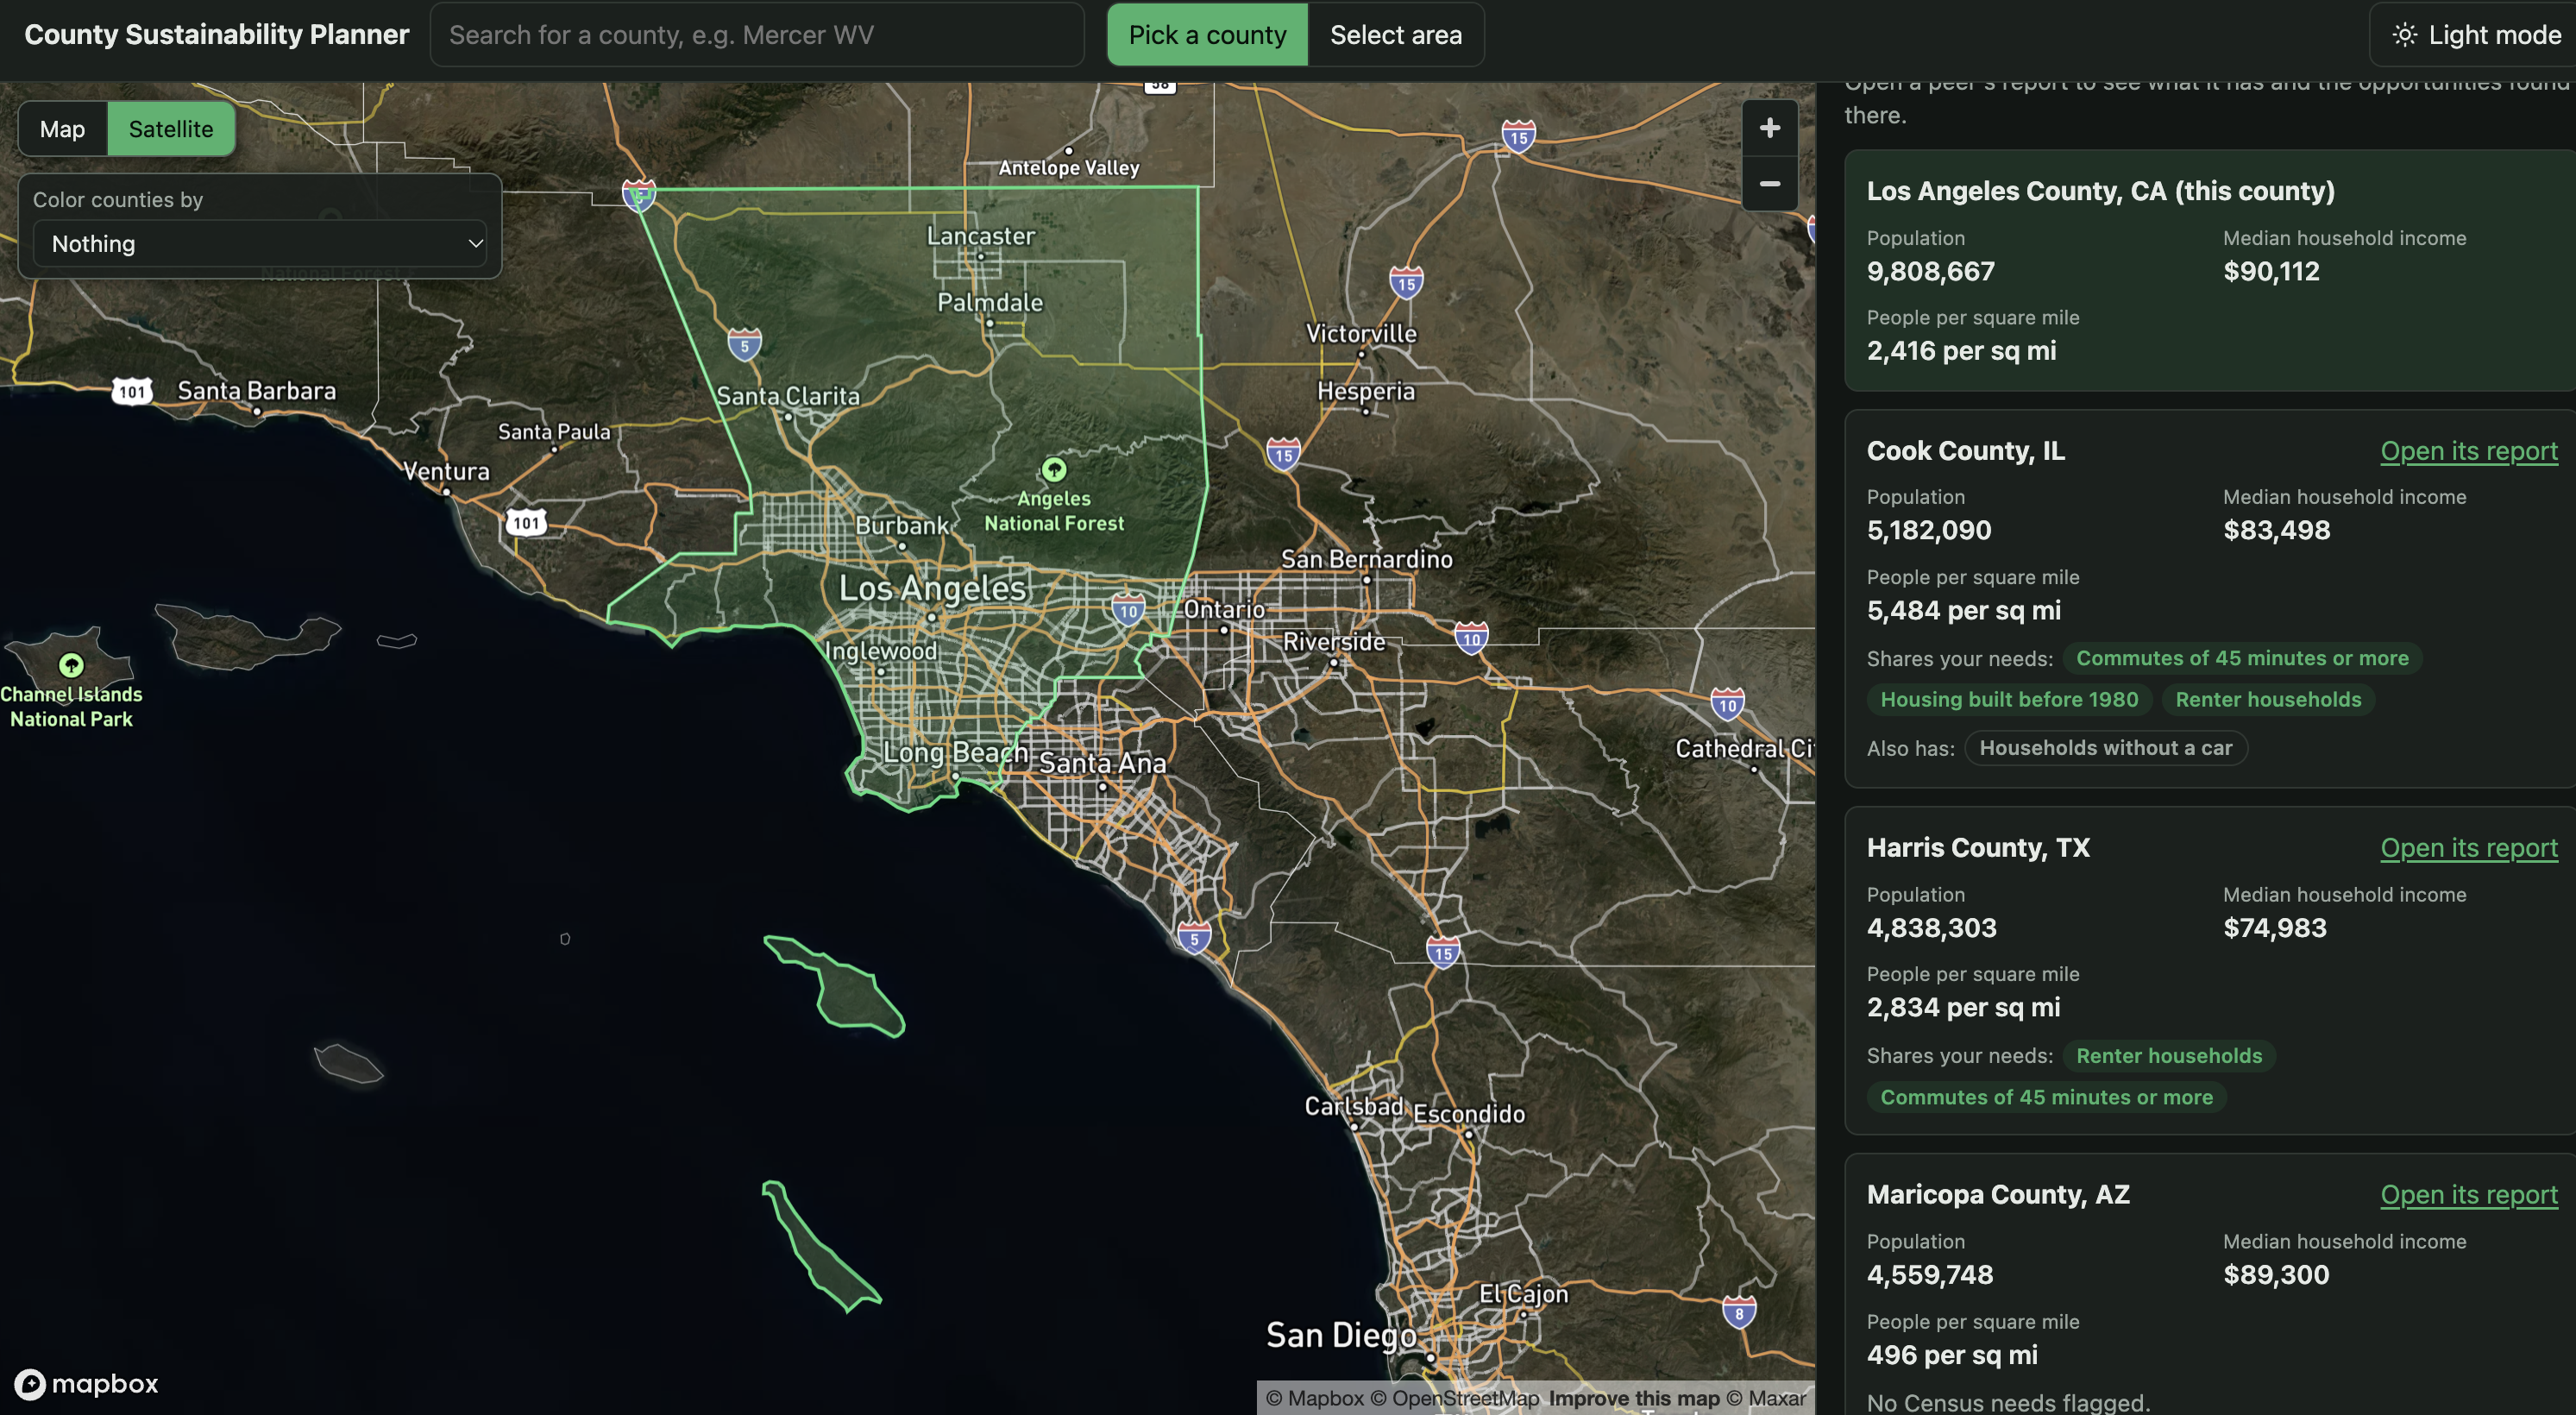
Blindspot lets a county official pick a county on a map, or draw a box over up to four neighboring counties, and get a report with four parts:
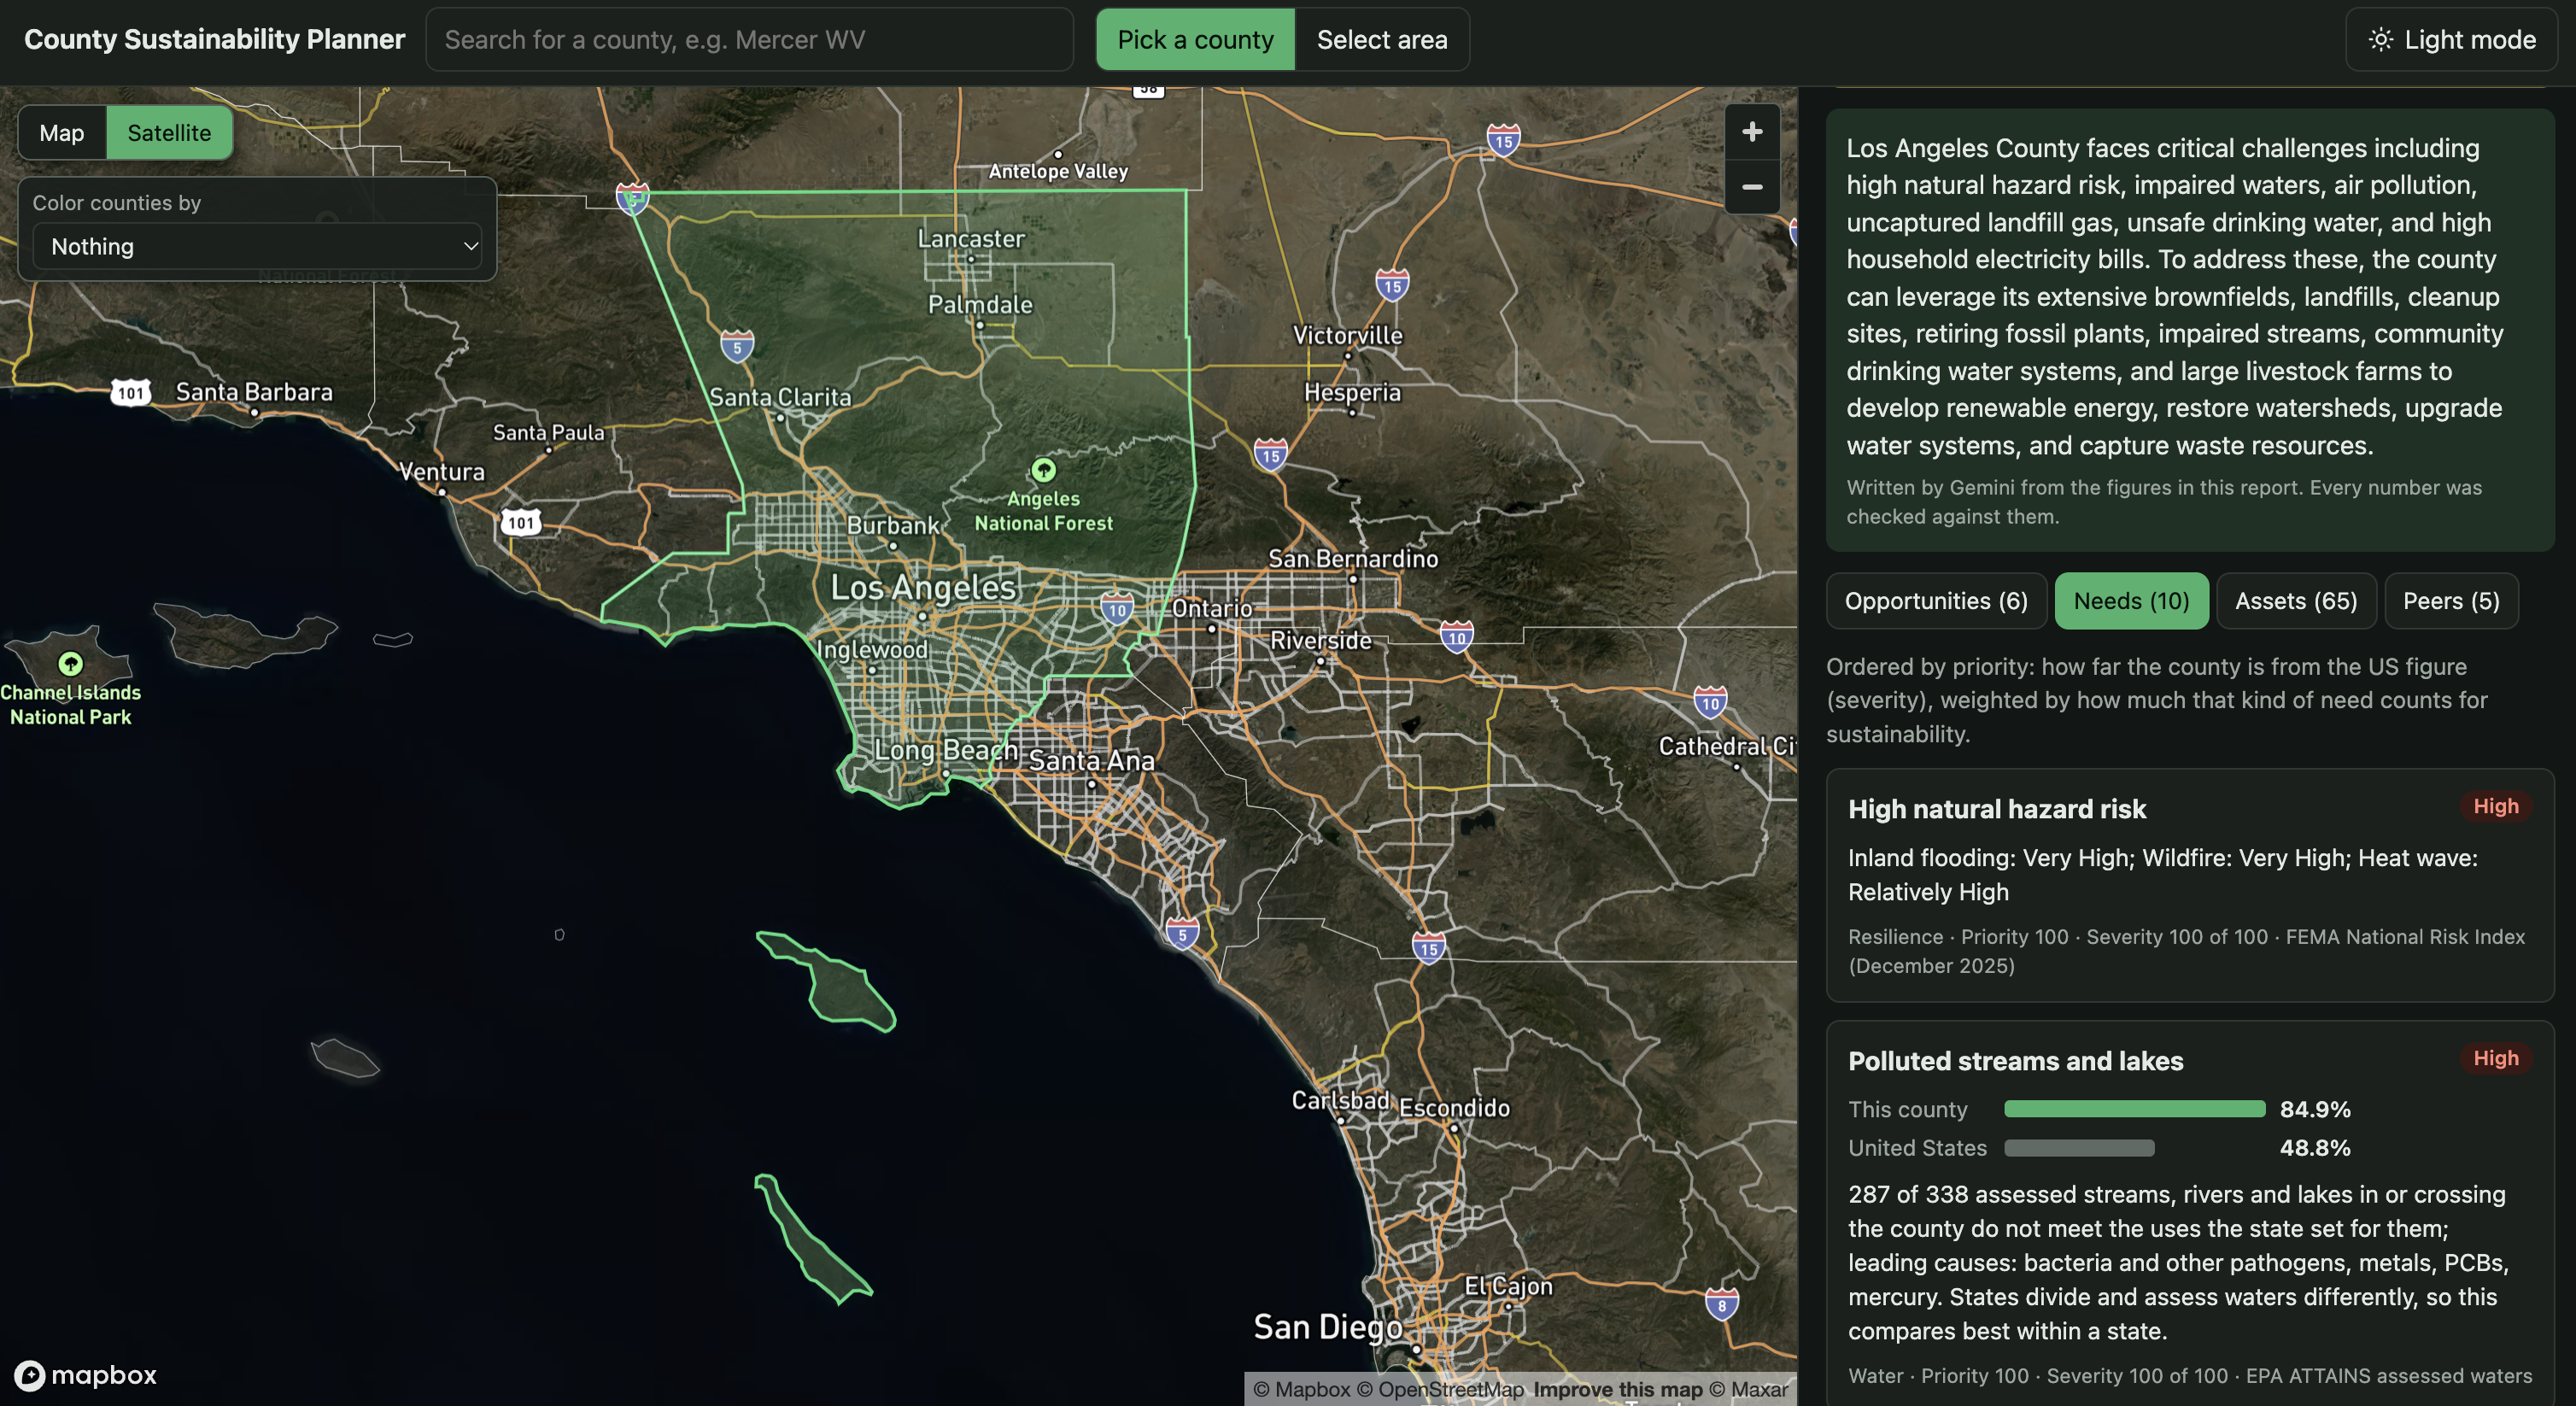
- Needs: the sustainability gaps in that county, each measured against the US figure from the same source. Examples include old housing, fuel-oil heating, renters, long commutes, polluted waterways, and flood or heat risk.
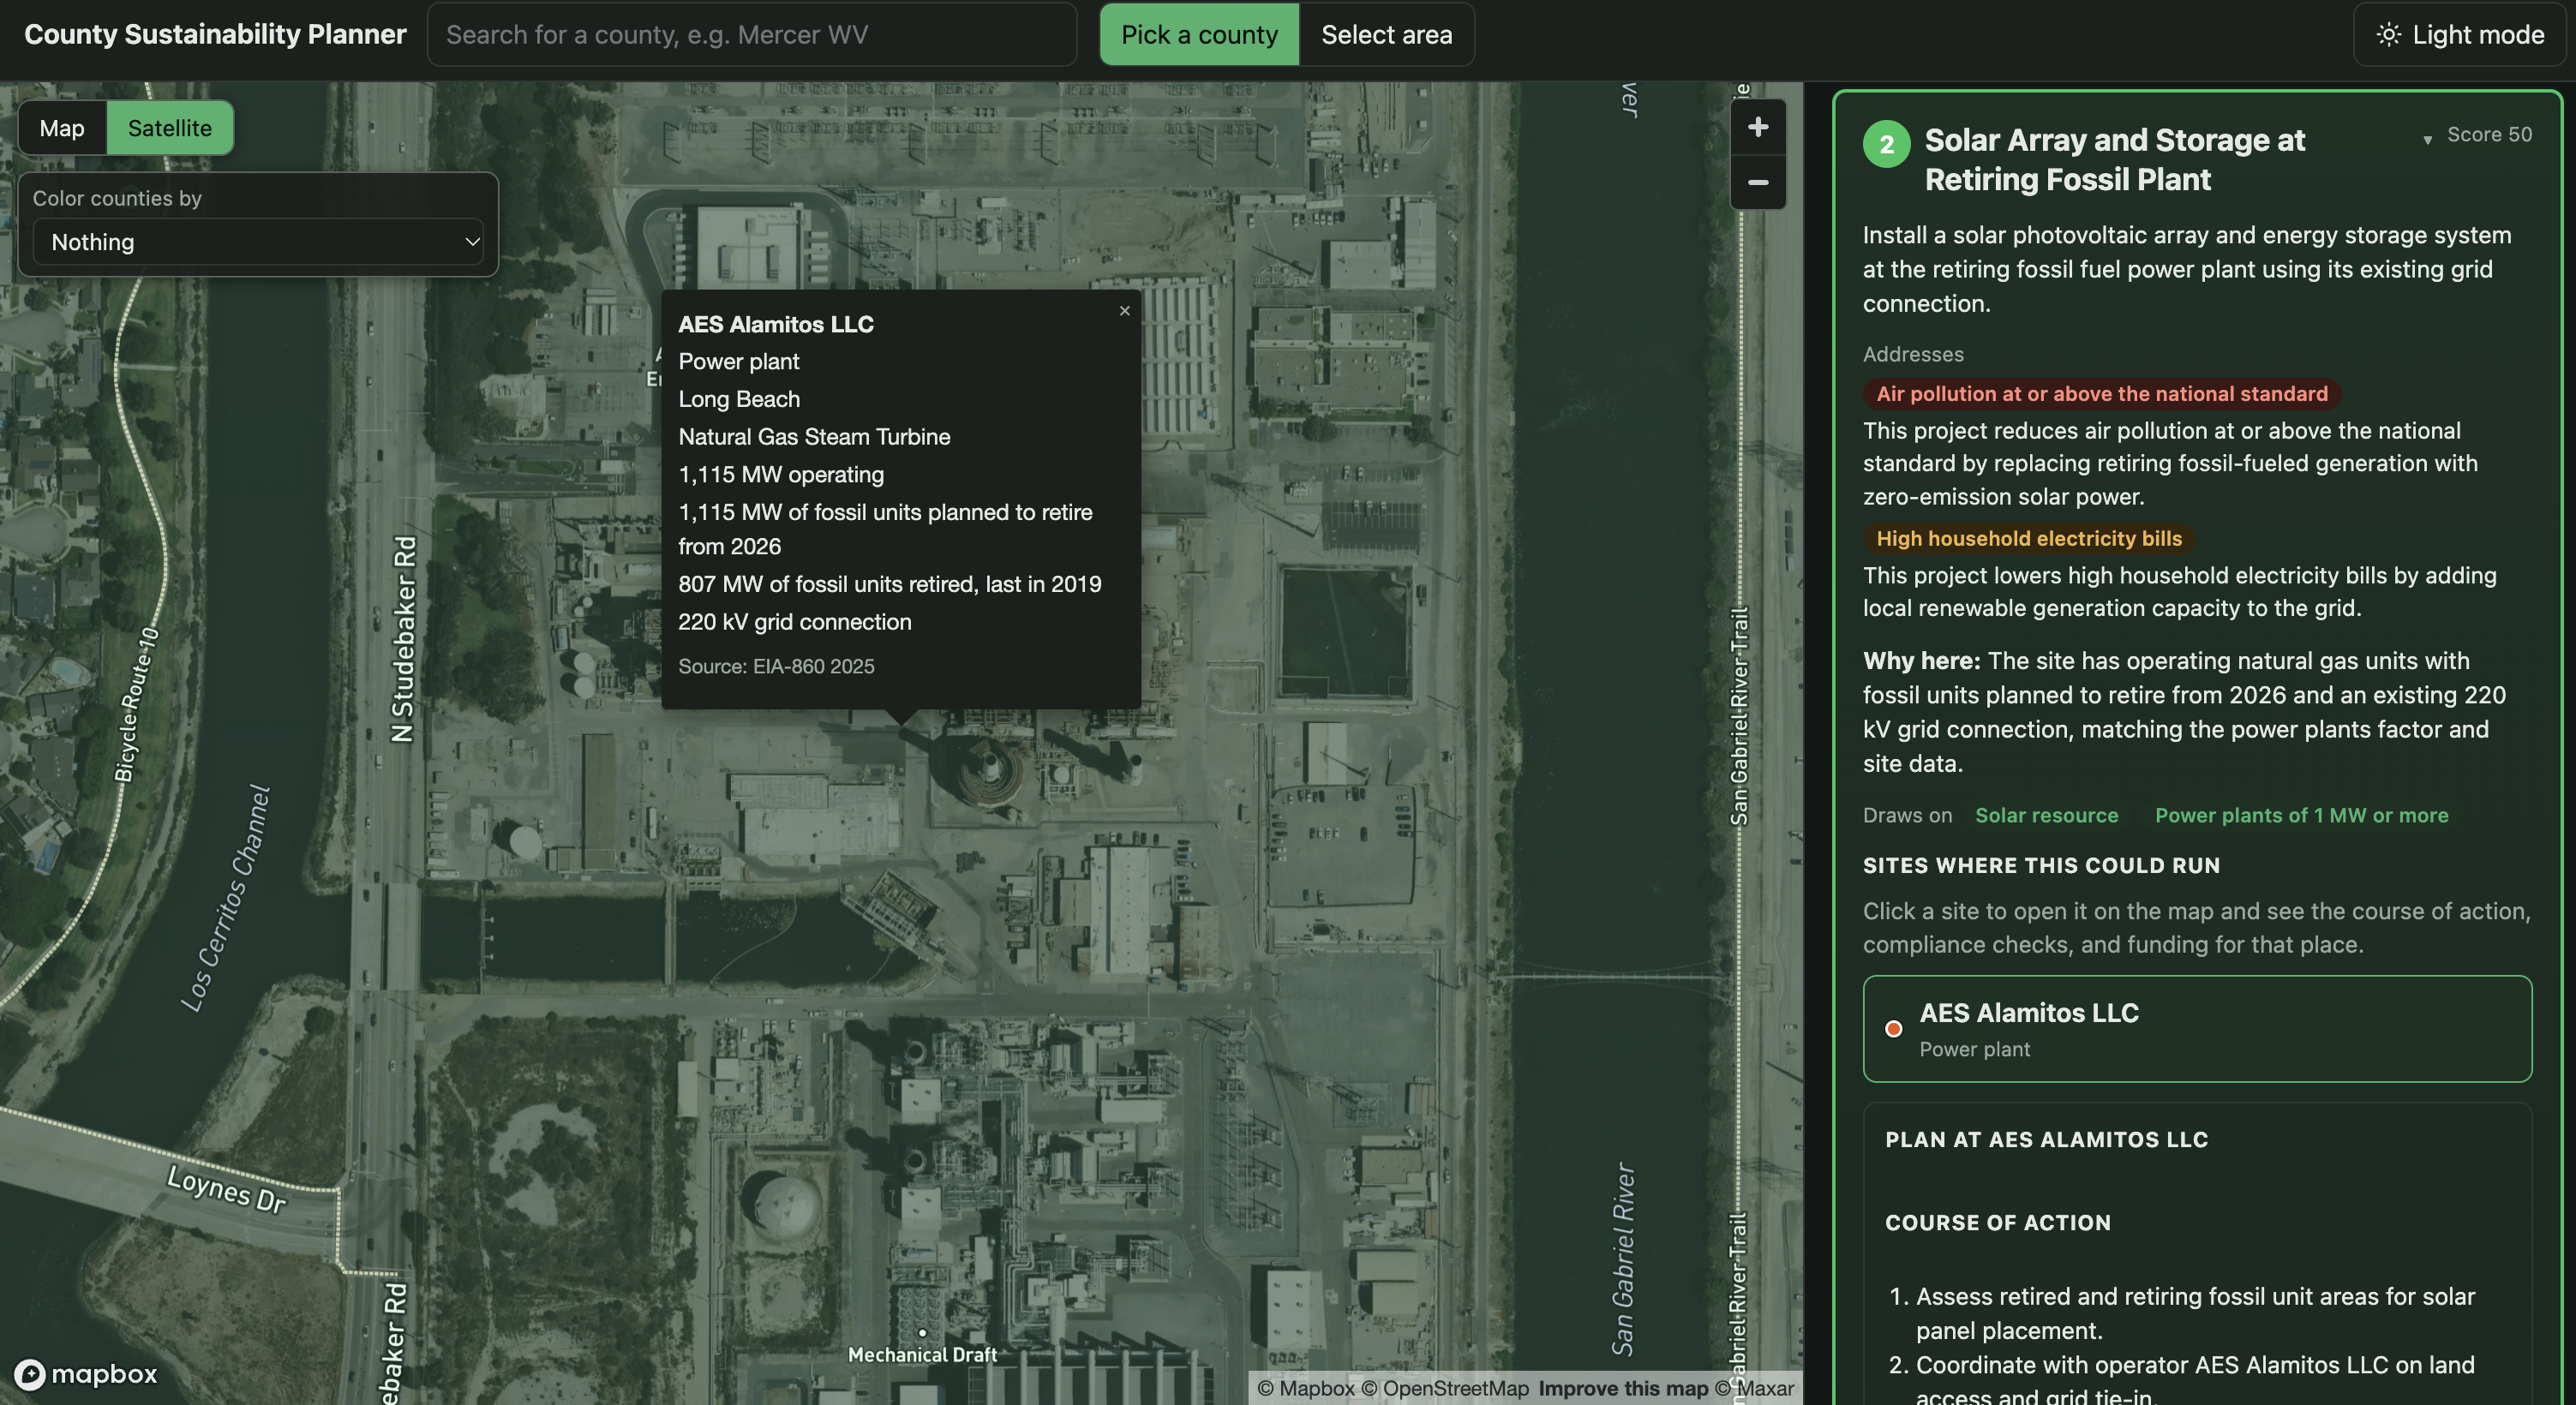
- Assets: the real sites that could host a fix, such as brownfields, closed landfills, mine lands, dams, power plants, schools, libraries and colleges, with their sizes and solar screening where the data has them.
- Opportunities: a ranked list. Each one names the needs it reduces and says how, the sites it could use, a plan, a list of checks and forms, and a size estimate with its assumptions shown. Where a funding program fits, it shows the program's status and the date we last checked it.
- A short county brief, written in plain language for a non-technical reader.
Every number on the page comes from a public dataset or is labelled as an estimate with its assumptions. The model writes the words. Code chooses the needs, scores, rankings, estimates and funding leads.
How we built it
- Backend: Python with FastAPI and Pydantic. One request runs about 20 public data sources concurrently, with a 15 s timeout each. A source that fails is reported in a status list, and the rest of the report still loads.
- Data: the US Census American Community Survey, NLR PVWatts and station data, EPA RE-Powering, LMOP and air quality, FEMA's National Risk Index, DOE's LEAD energy-burden tool, EIA power plant and utility data, CDC PLACES and Social Vulnerability Index, USFS wildfire risk, OpenFEMA, EPA drinking water and impaired-waters data, ORNL dams, USDA farm data, Open-Meteo climate history, Geoapify places, and Google Earth Engine land-cover and heat layers. Most are prepared once into local files. The rest are fetched and cached on demand.
- Model: Google Gemini, given one county's needs, factors and sites in a compact digest. Its answer is checked before use: every number must appear in the digest, every site and need must exist, and each opportunity needs its explanation. If the model fails or times out, the report falls back to fixed matching rules and a template brief.
- Frontend: React and TypeScript with Mapbox GL for the map, county search, box selection, and a results panel with tabs for opportunities, needs, assets and peer counties.
- Tests: 209 backend tests, including the number and site checks and the fallback paths.
Challenges we ran into
- Gemini was slow. One county took 77 to 86 seconds, mostly while the model reasoned before writing. Shrinking the prompt helped little. What fixed it was setting the thinking level to low, which brought a county to about 30 seconds in our runs.
- Ranking showed the wrong priorities. For Queens County, the top need was flood and heat risk, but the top opportunities were solar on a landfill, because each opportunity was ranked by the highest need it listed. We now credit an opportunity only with the needs its project type actually reduces, and the model must explain each one.
- The model made number and ID slips. It rounded figures, and once it miscopied one character of a 125-character site ID, which cost the whole opportunity. We check every number against the digest and send long site IDs as short stand-ins.
- Public data is messy. Column names differed from what the documentation suggested, and the NREL developer domain moved to NLR partway through the project. Our data-preparation script maps each file's columns explicitly, so changes stay in one place.
Accomplishments that we're proud of
- A county report that combines about 20 public federal and state datasets, nationwide, on demand.
- Opportunities that name the specific needs they reduce and explain how, with checks that stop invented numbers and sites from reaching the page.
- Each size estimate is labelled as an estimate with its assumptions shown beside it.
- A report still loads when any data source, or the AI model, fails.
What we learned
- Let the model write the words and let code supply every number. Checking the output against the source data is what made the AI useful for a public official.
- A ranking is only as good as the link it rests on. Ordering by the top need looked reasonable until we checked what the projects actually do.
- For a live demo, the fallbacks matter as much as the main path. Every part of the report has a plain version that still works.
What's next for Blindspot
- Expanding outside of just the US counties and finding data from out countries since this tool could be very useful to developing communities
