-
-
-
-
-
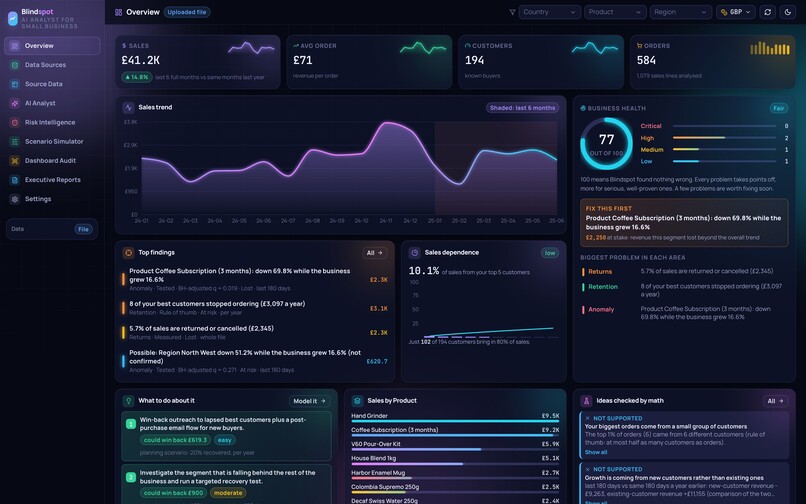
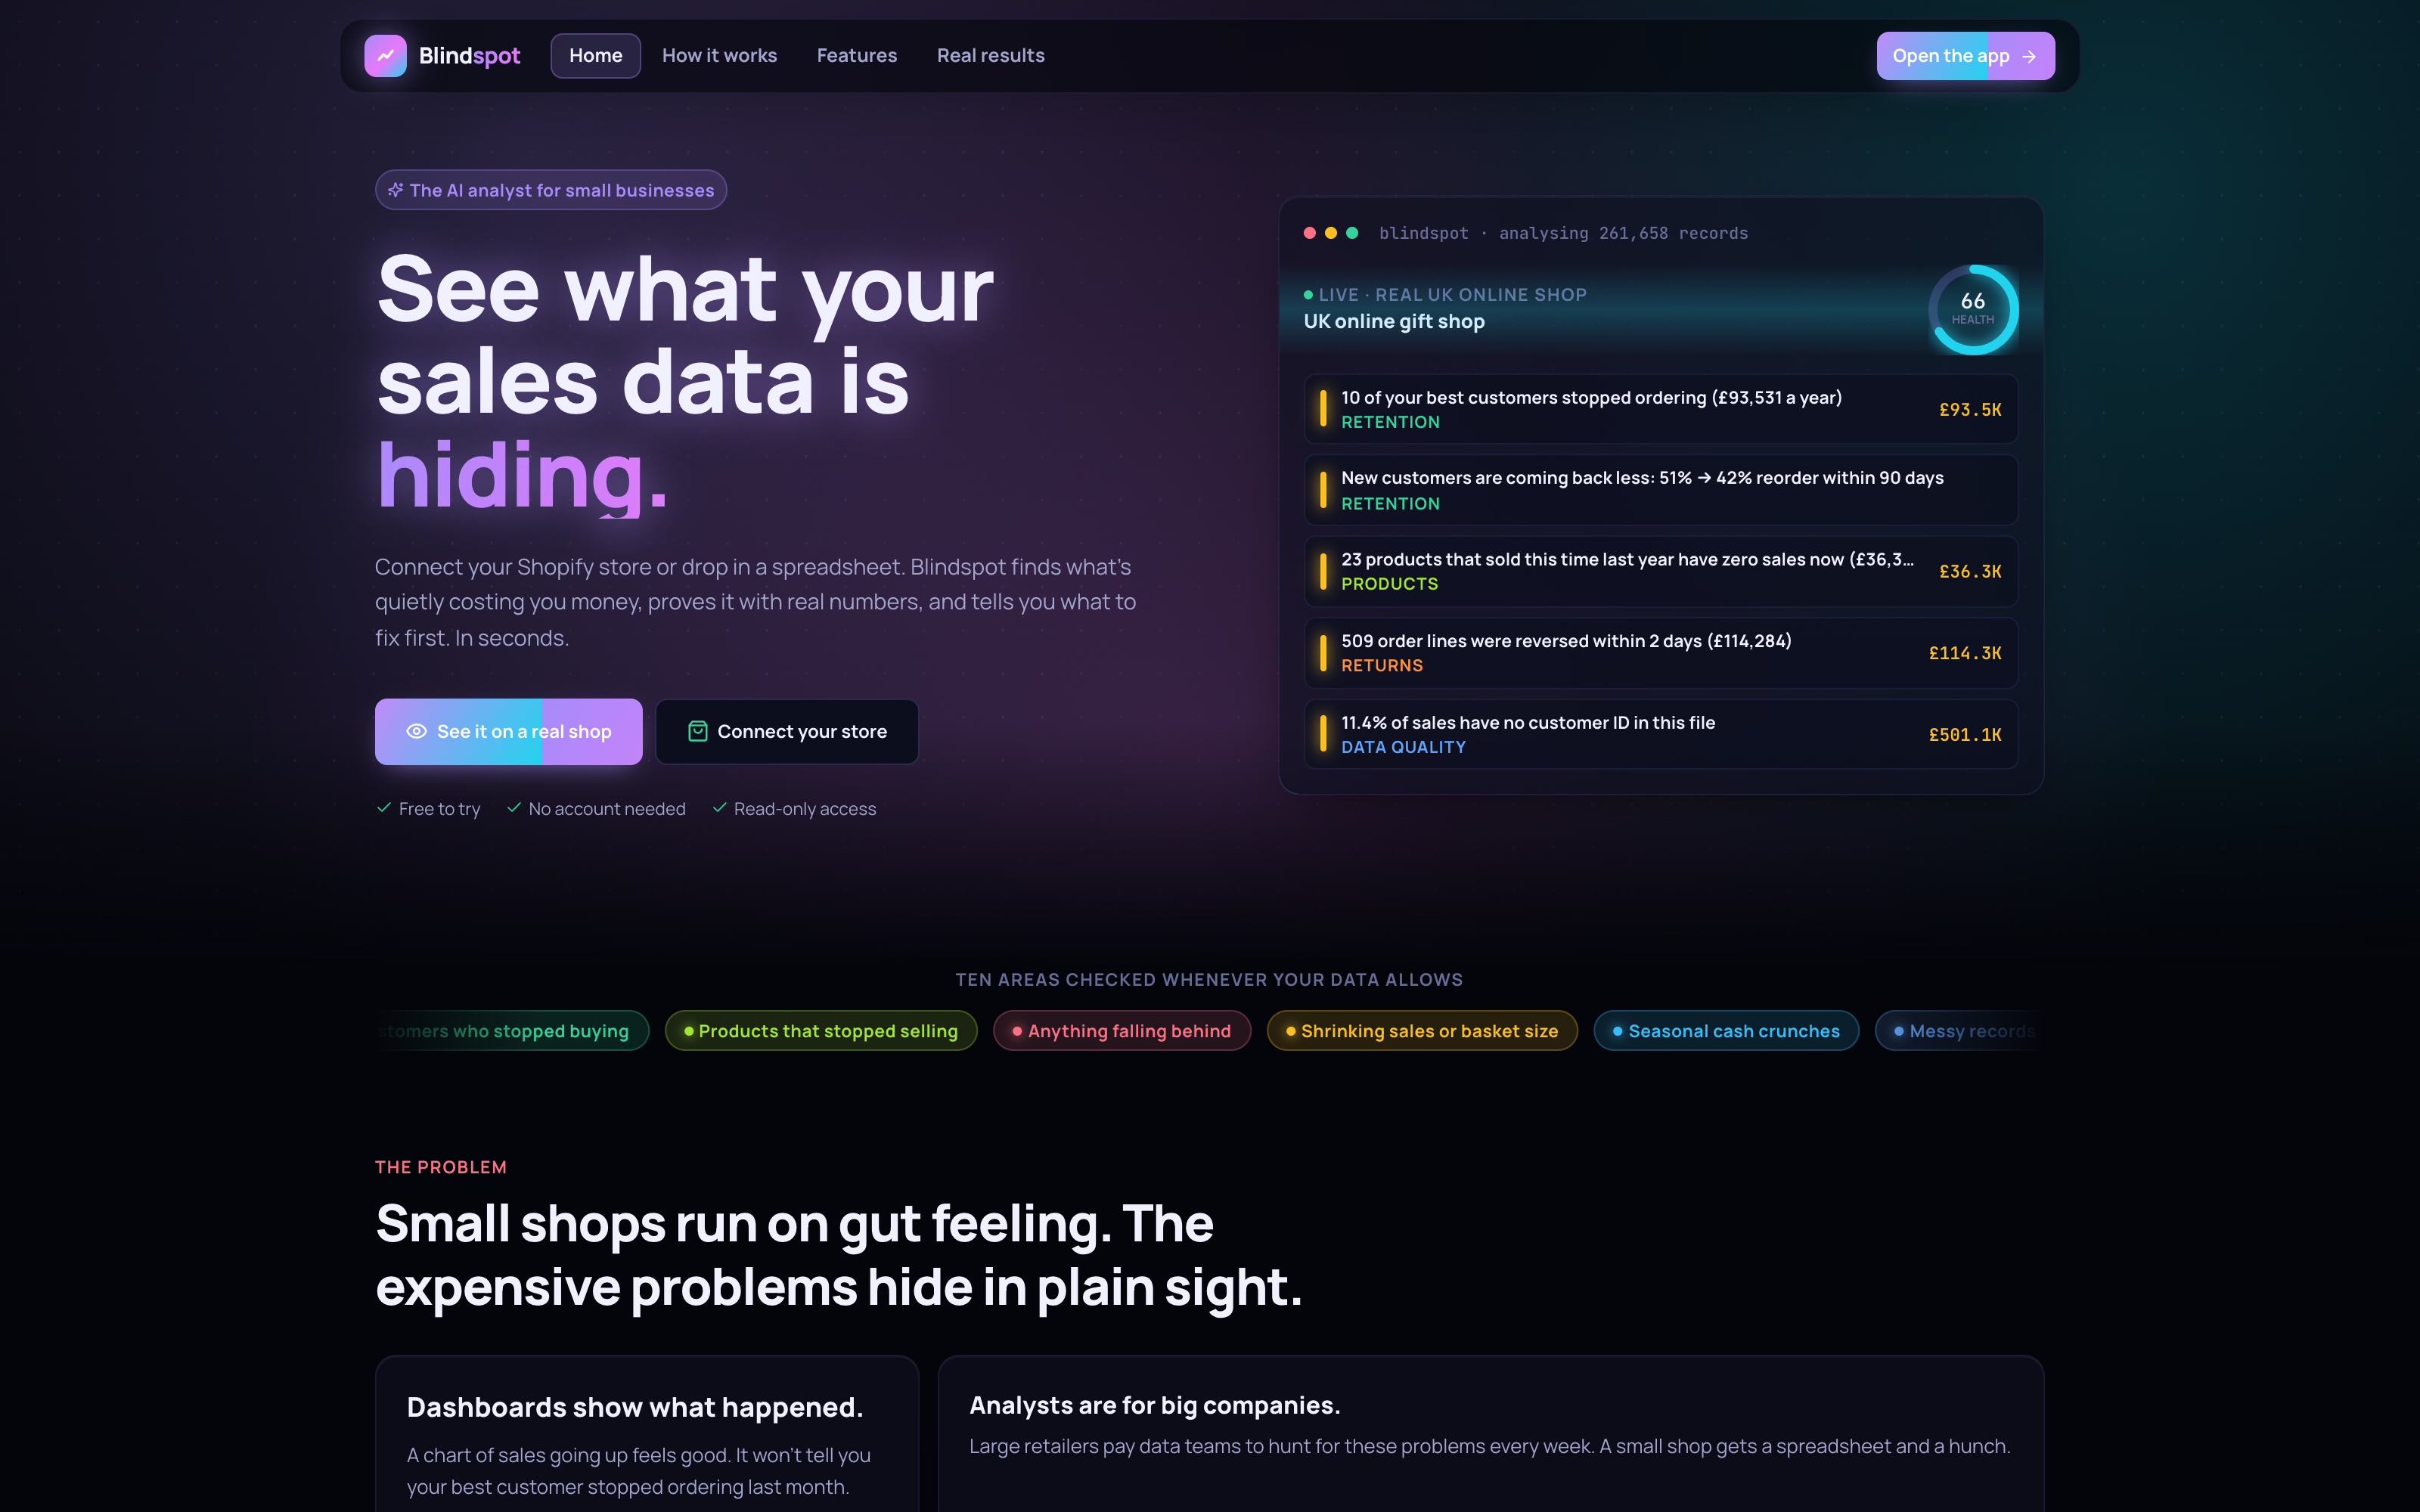
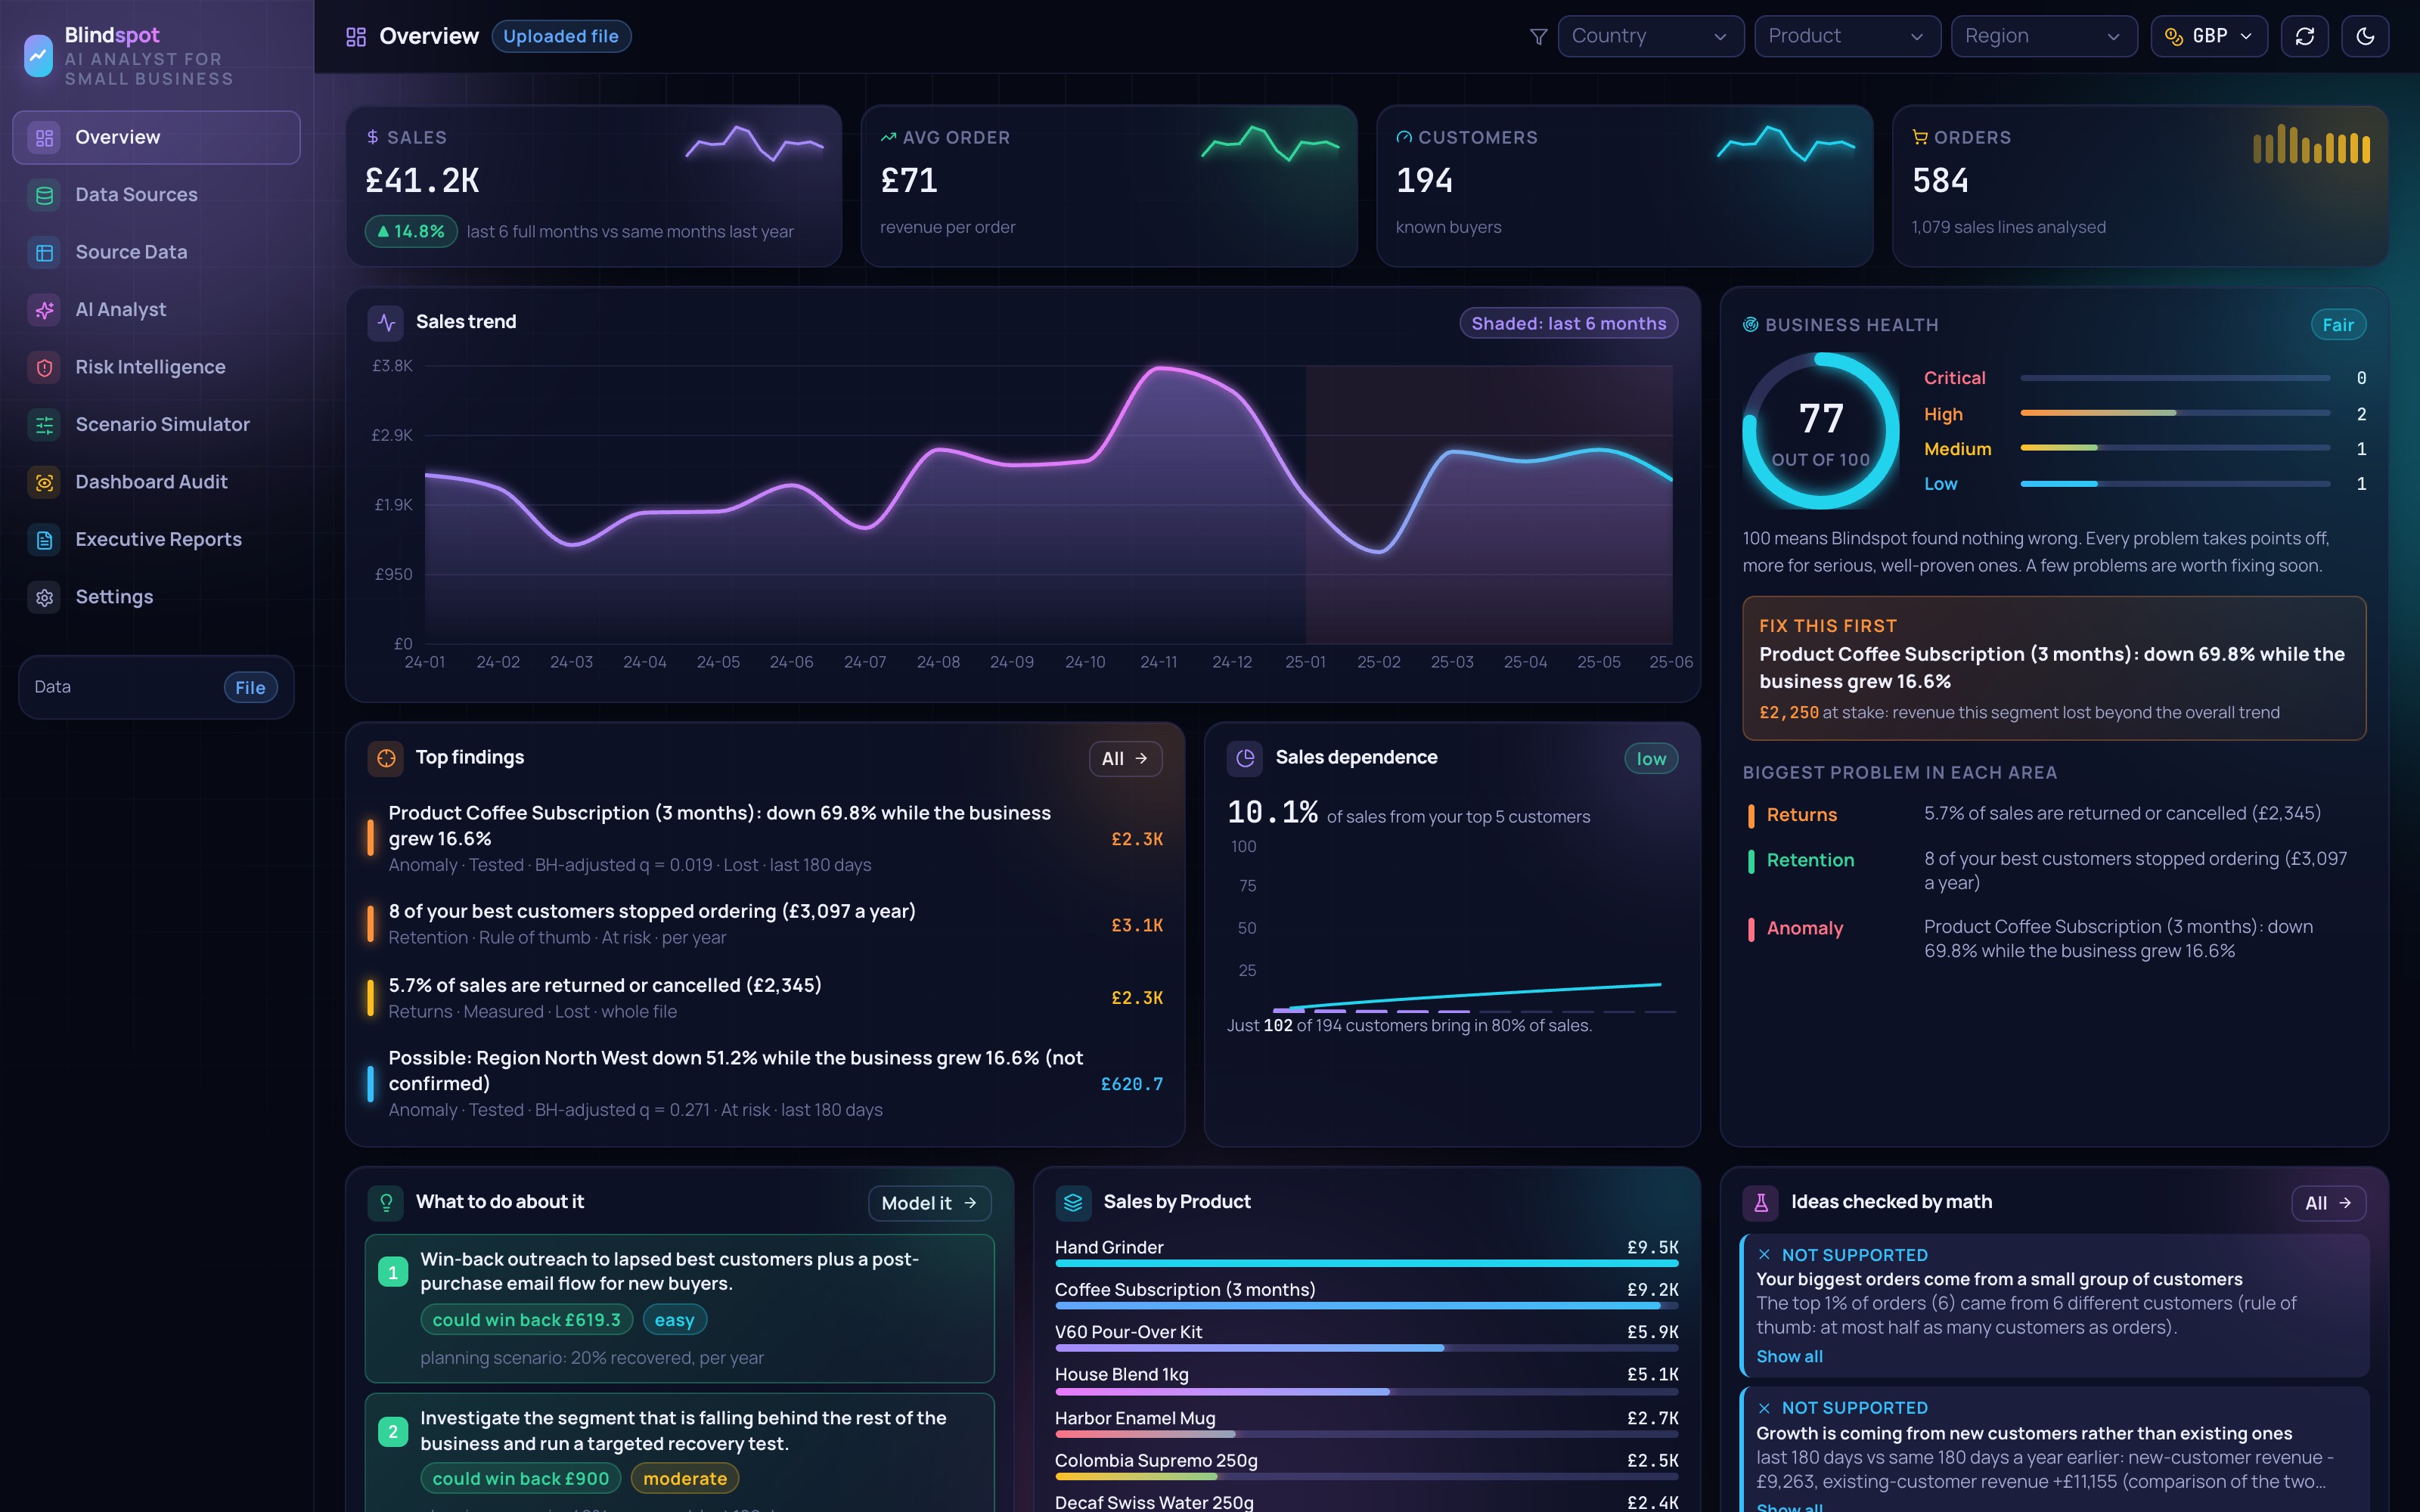
Overview: a health score, the problem to fix first, and findings ranked by money, labeled measured, tested or rule of thumb.
-
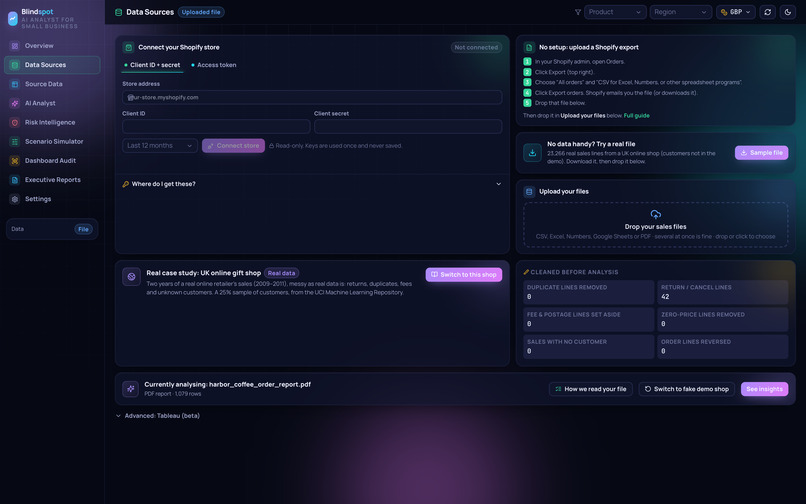
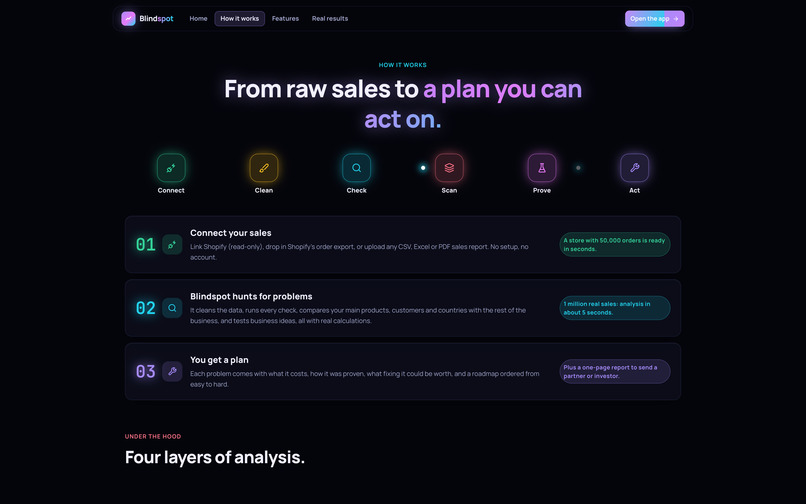
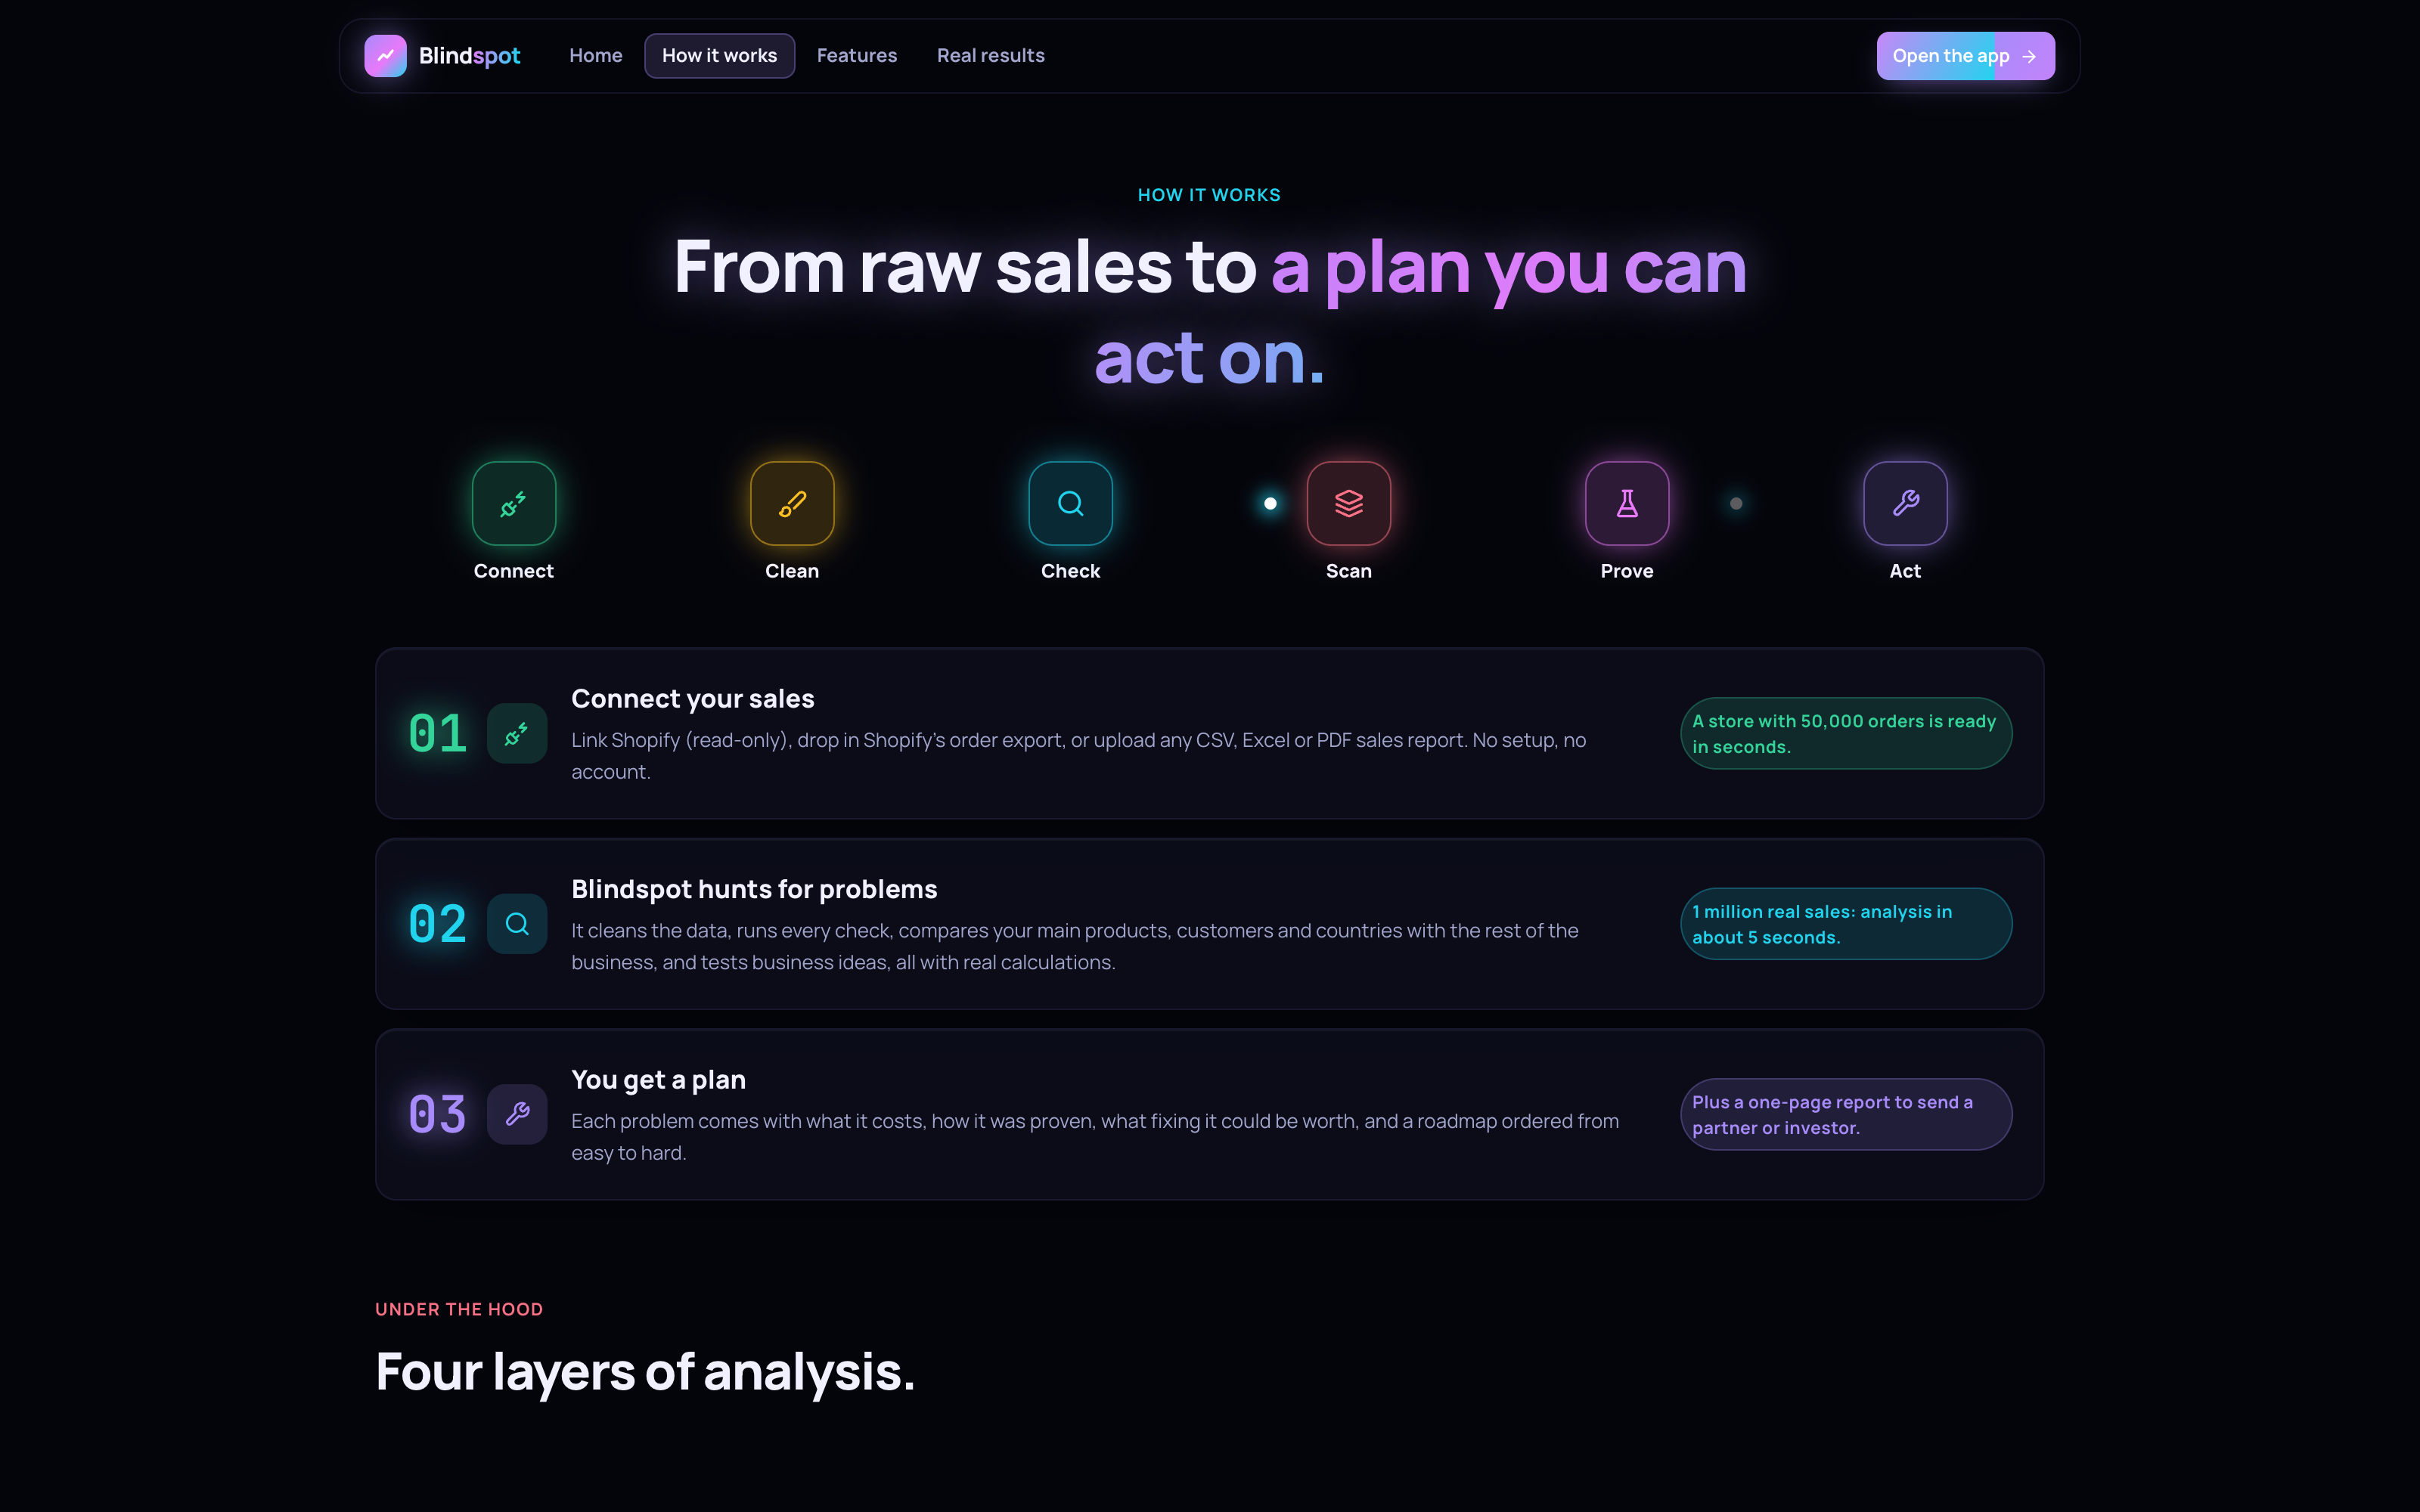
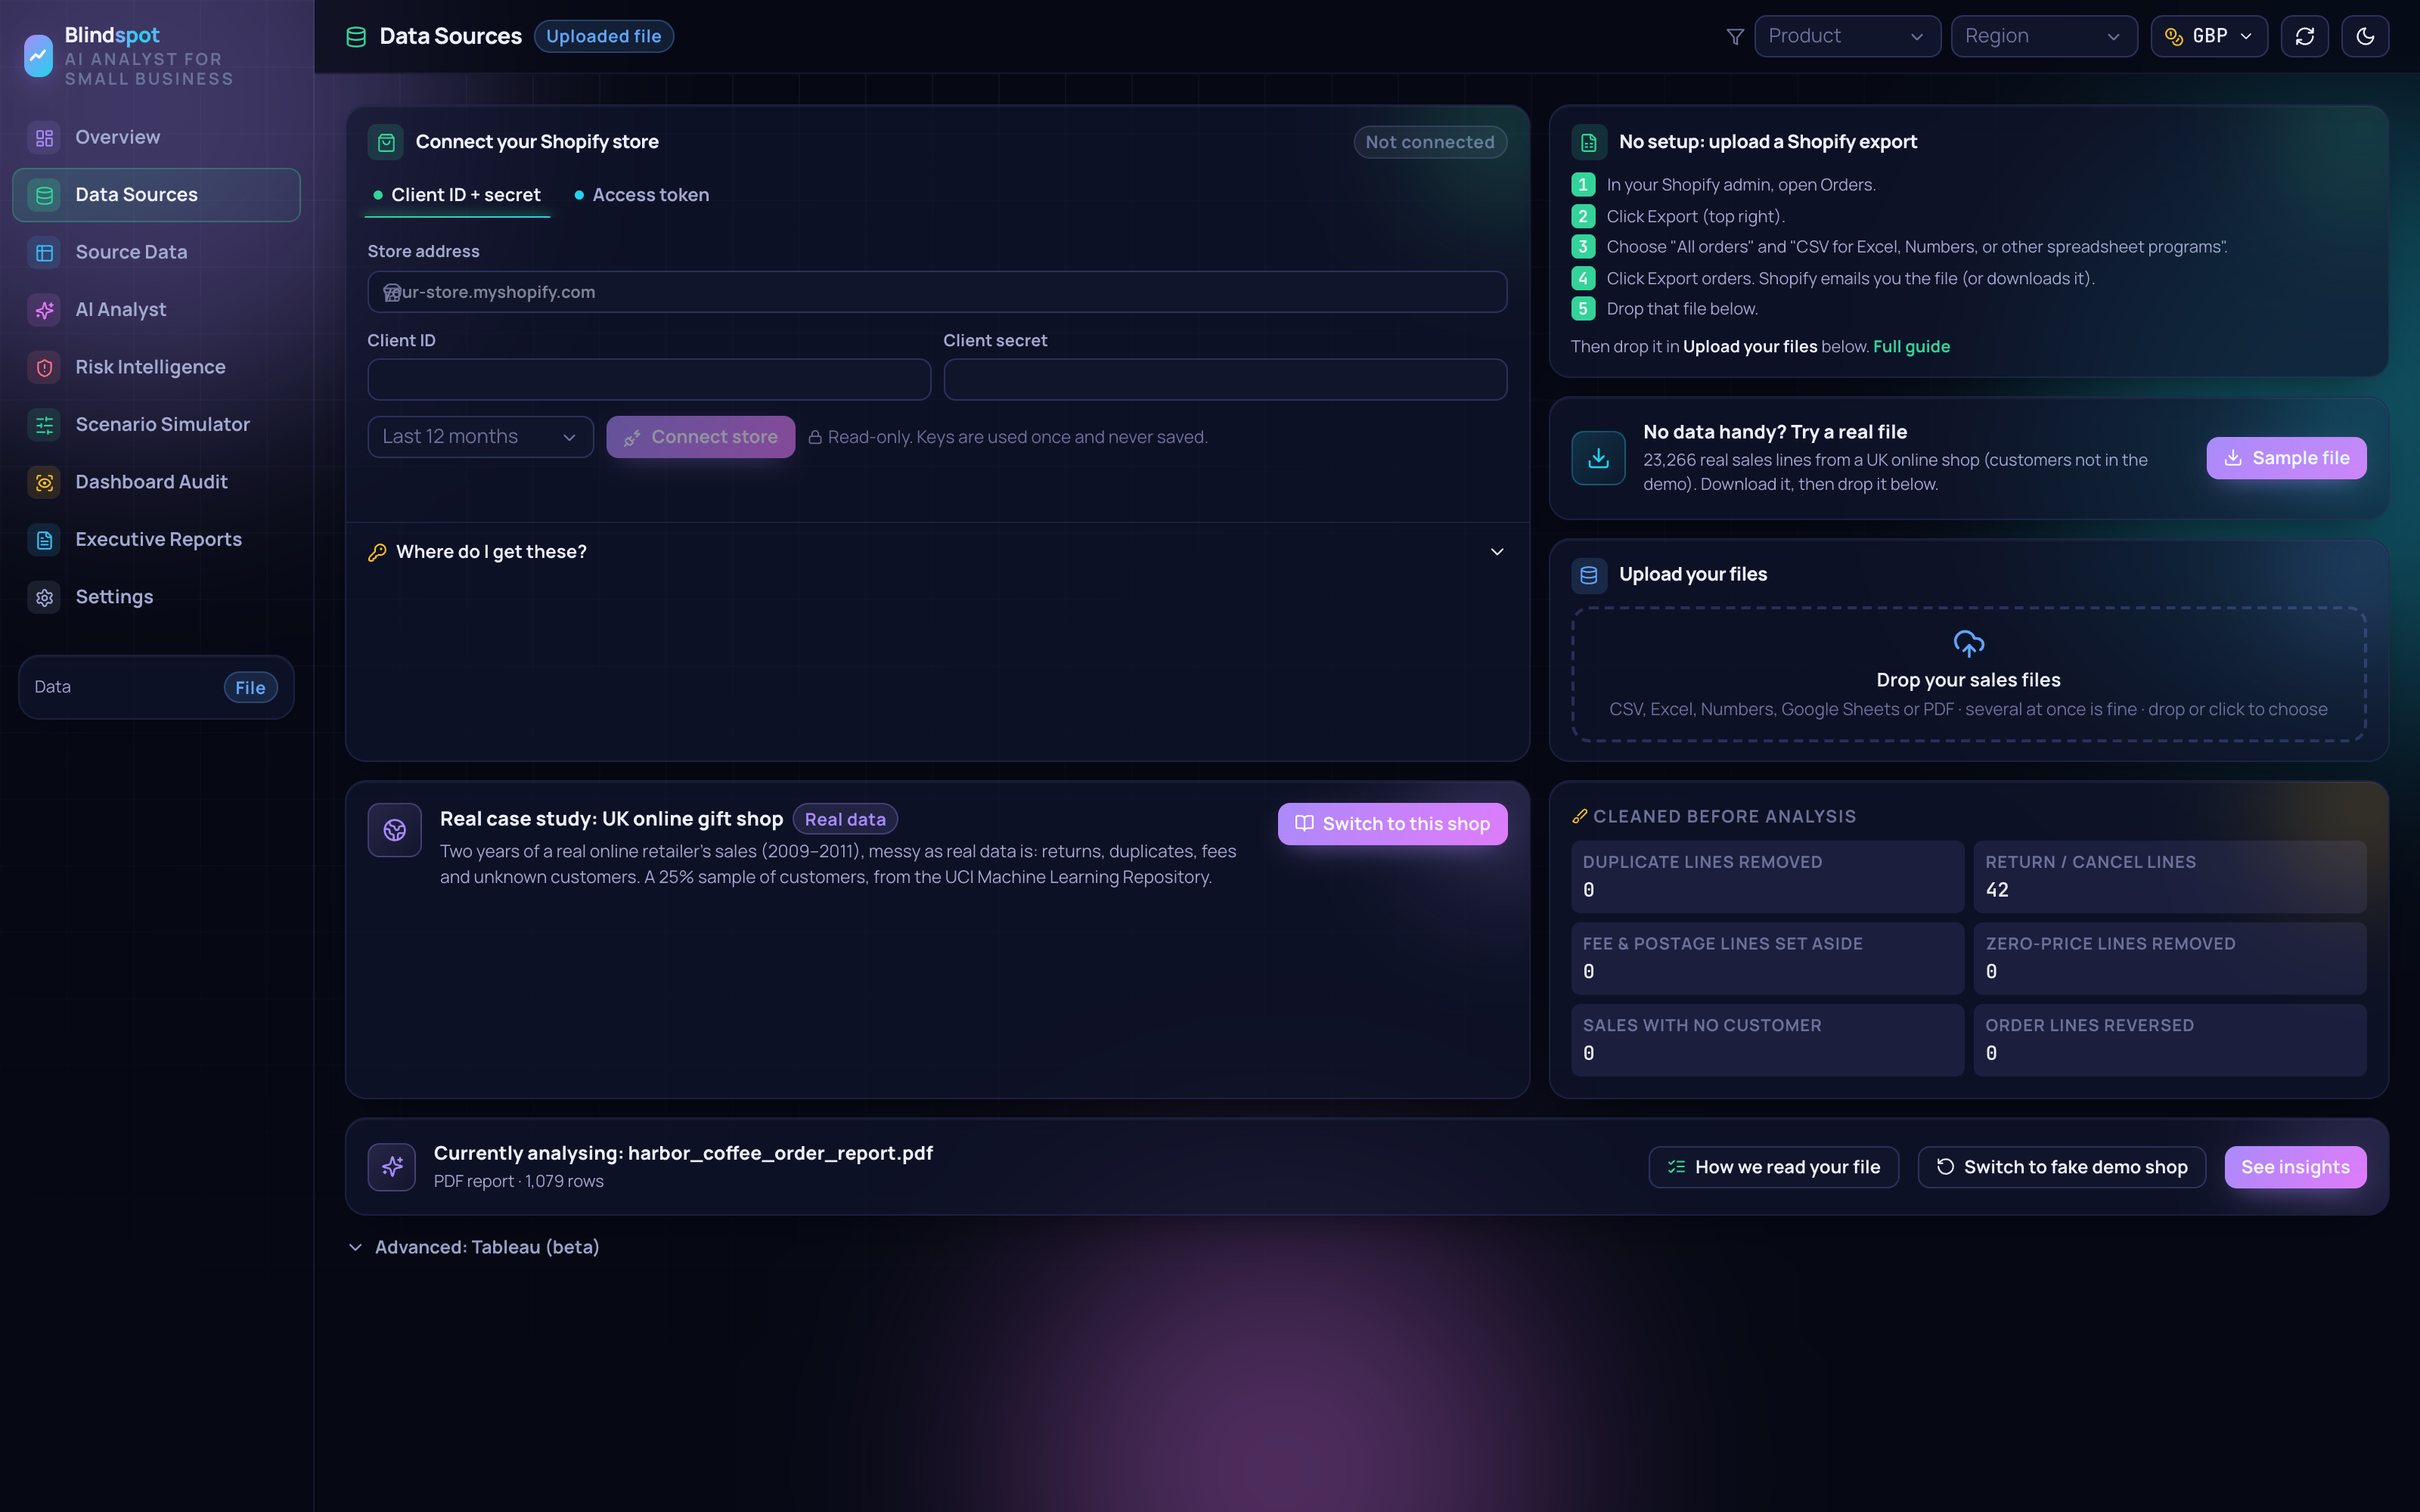
Connect Shopify read-only or upload CSV, Excel or a PDF report, and see exactly what was cleaned.
-
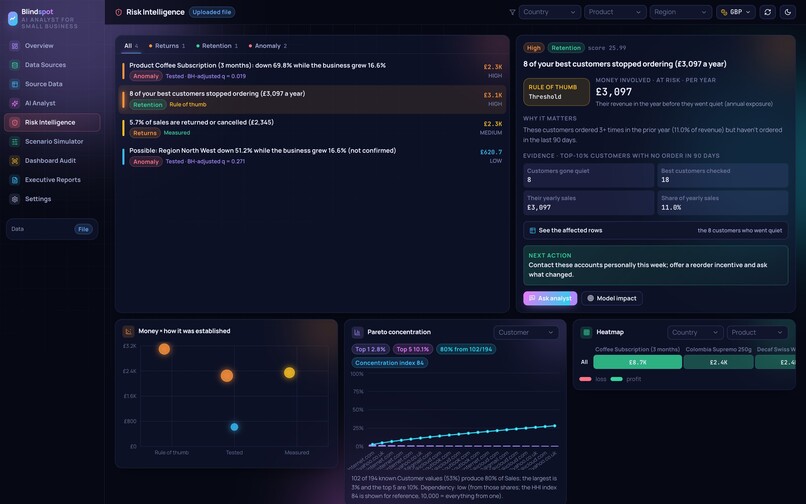
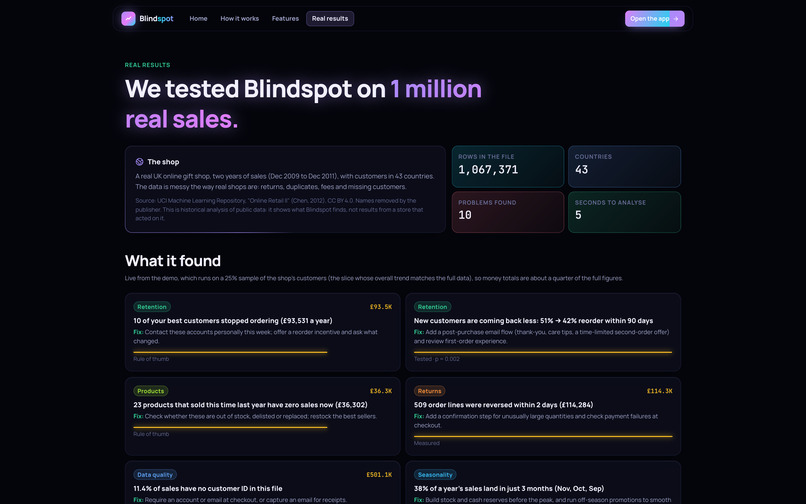
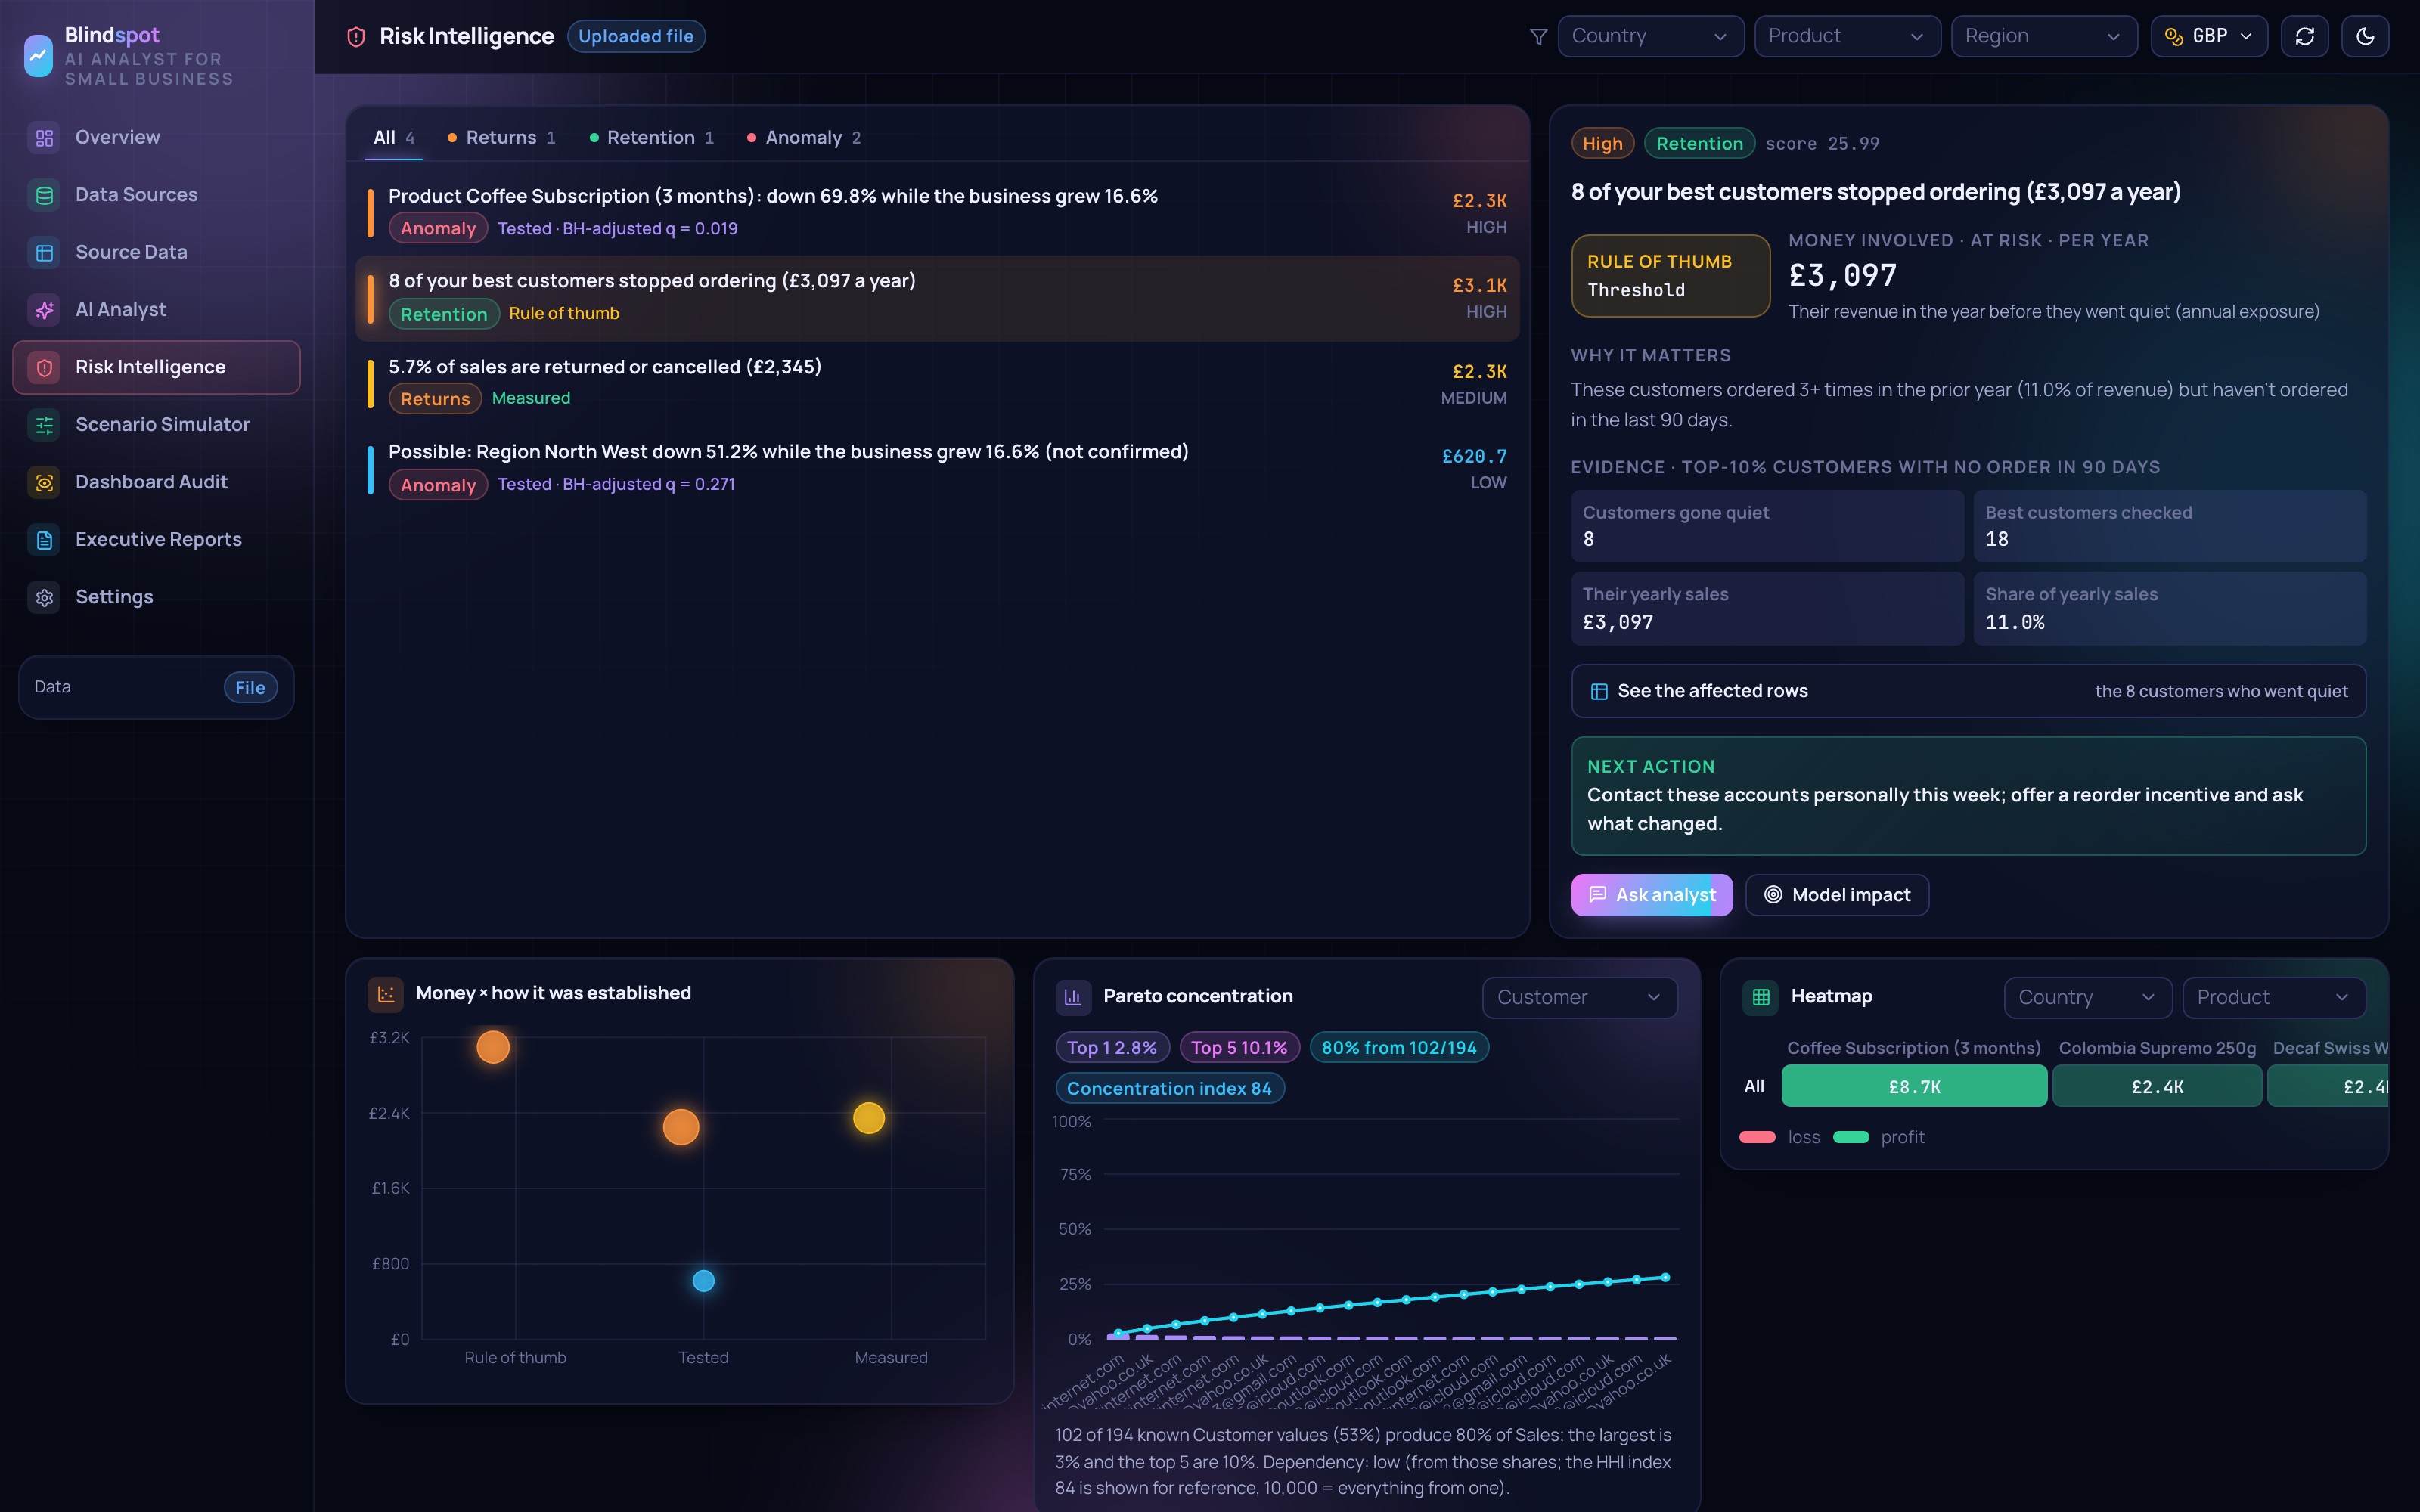
Each problem with its evidence, how it was proven, and a button to see the exact rows behind it.
-
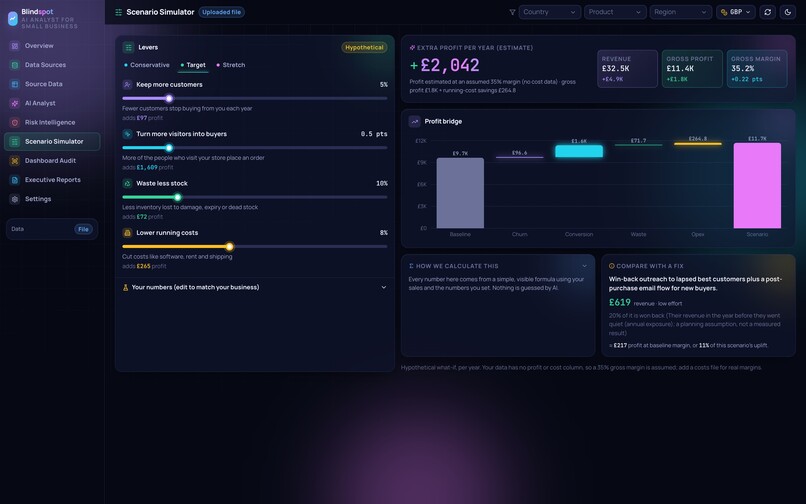
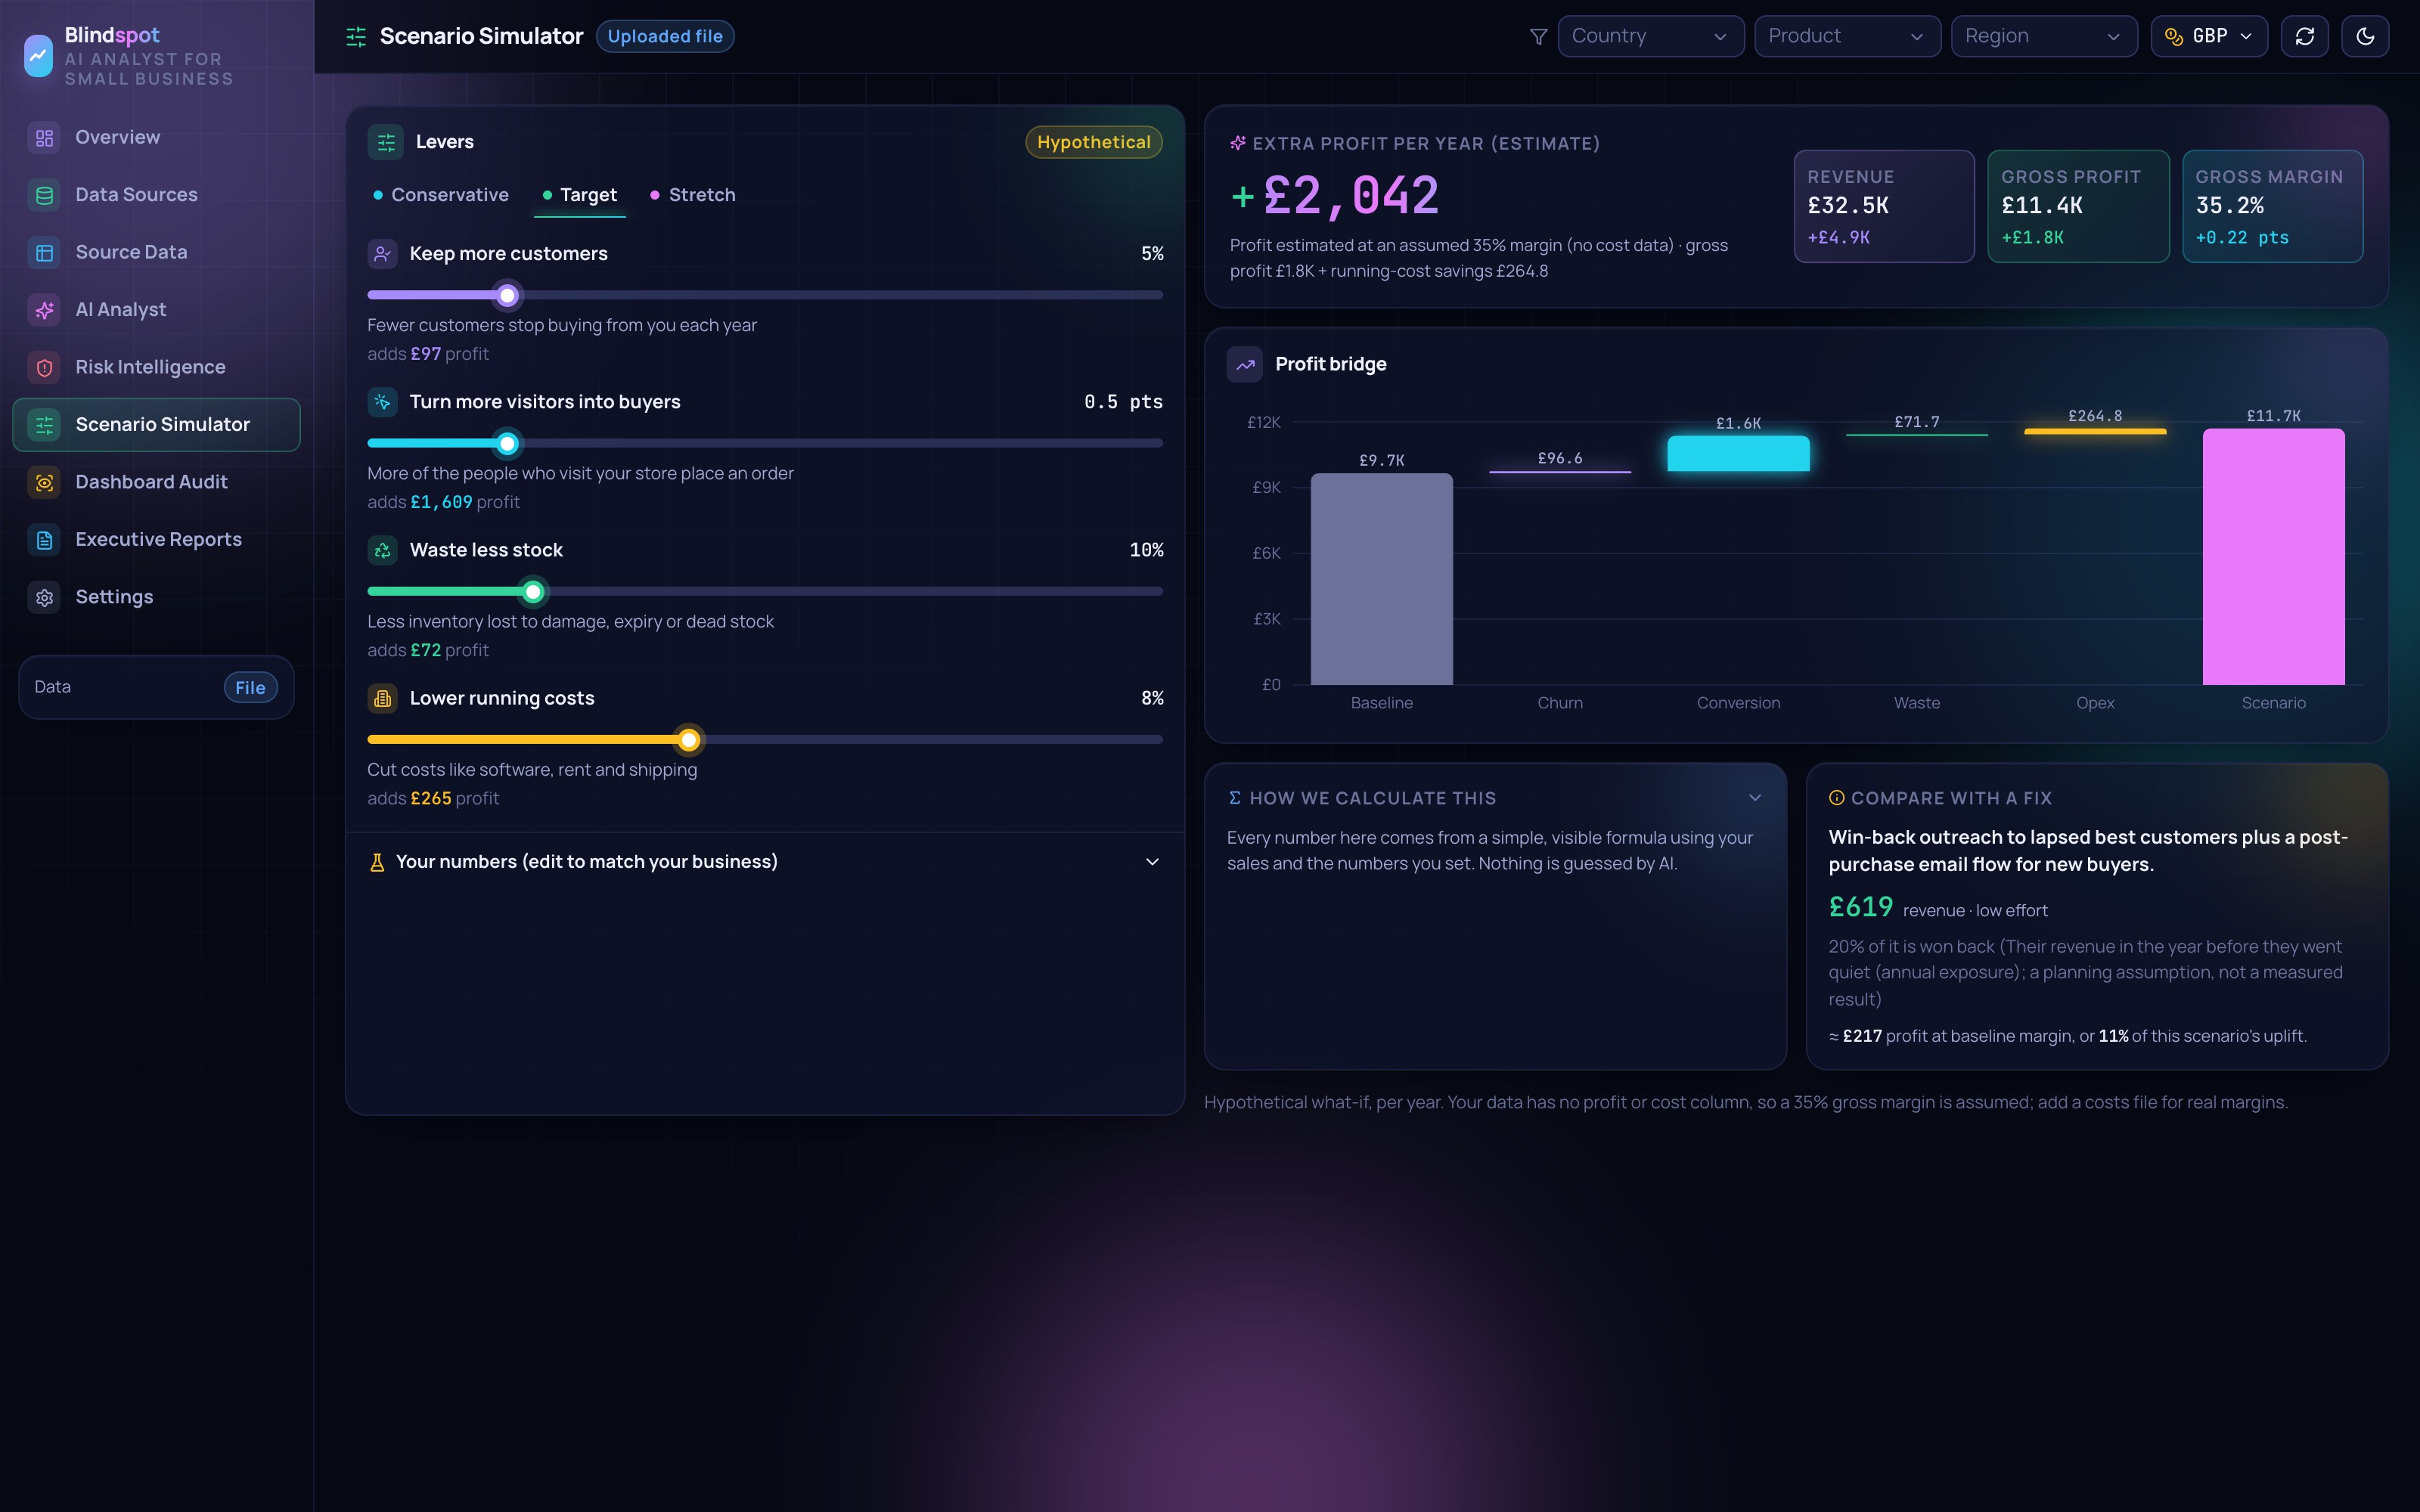
What a fix could be worth, with every assumption visible and editable.
-
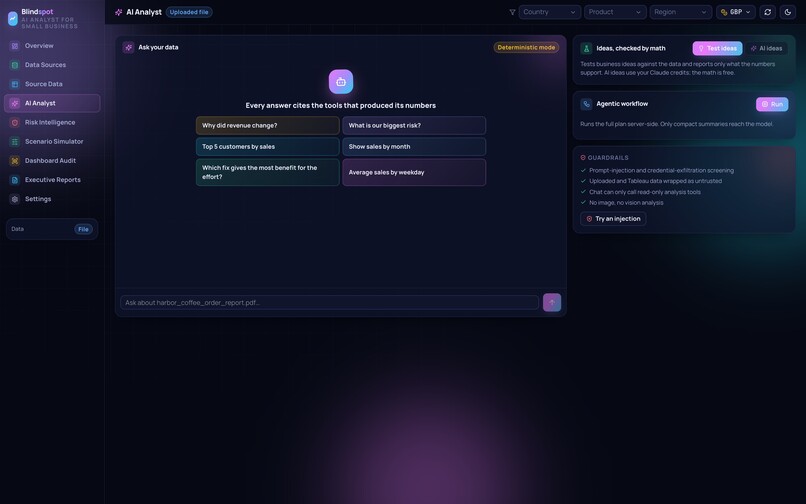
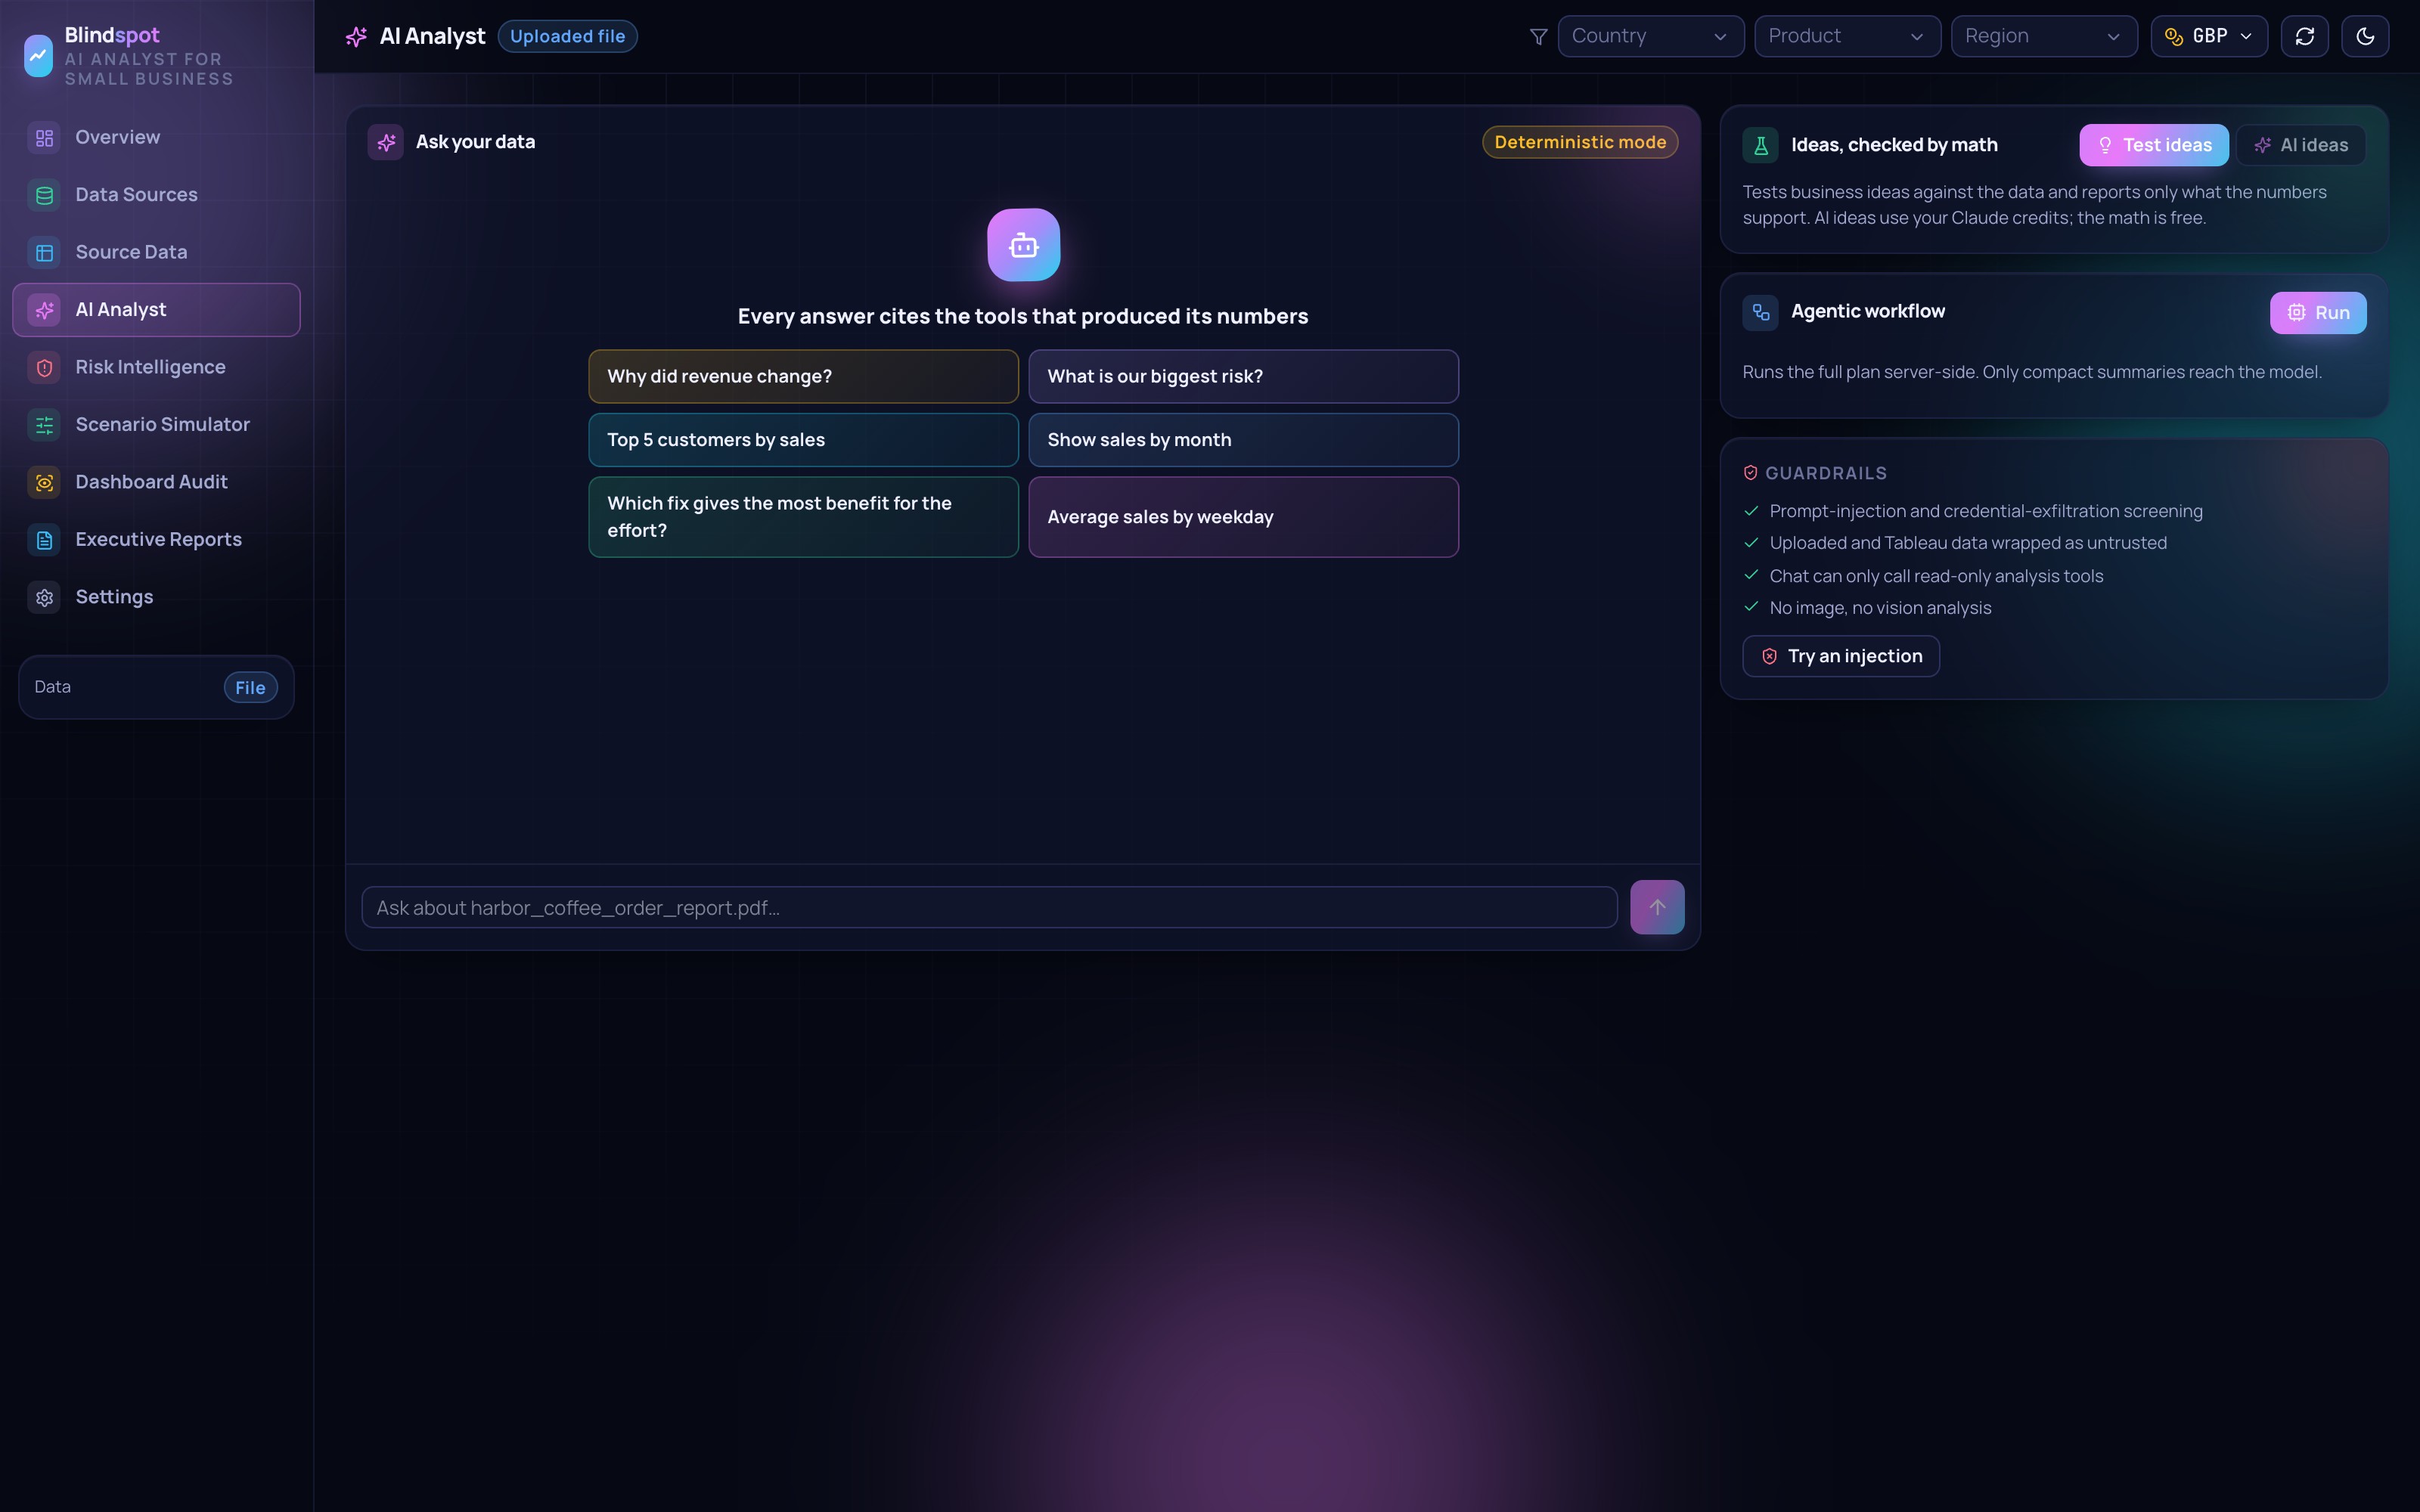
Ask in plain English. Claude picks from read-only analysis tools and explains the real results. AI suggests, math checks.
-
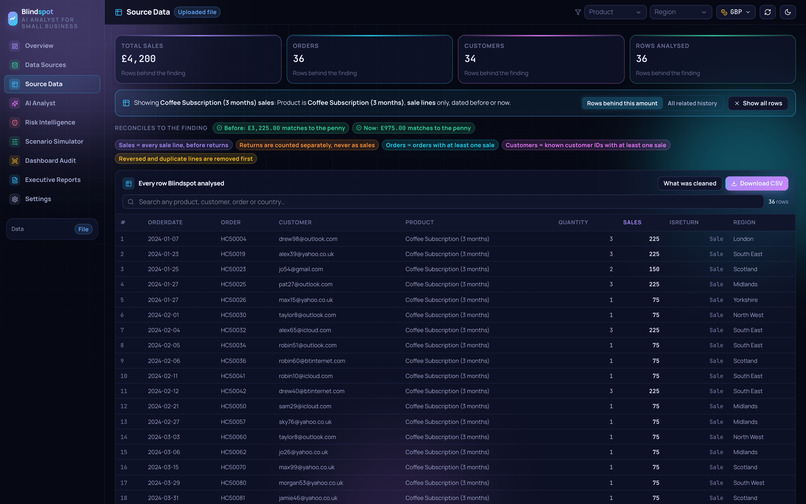
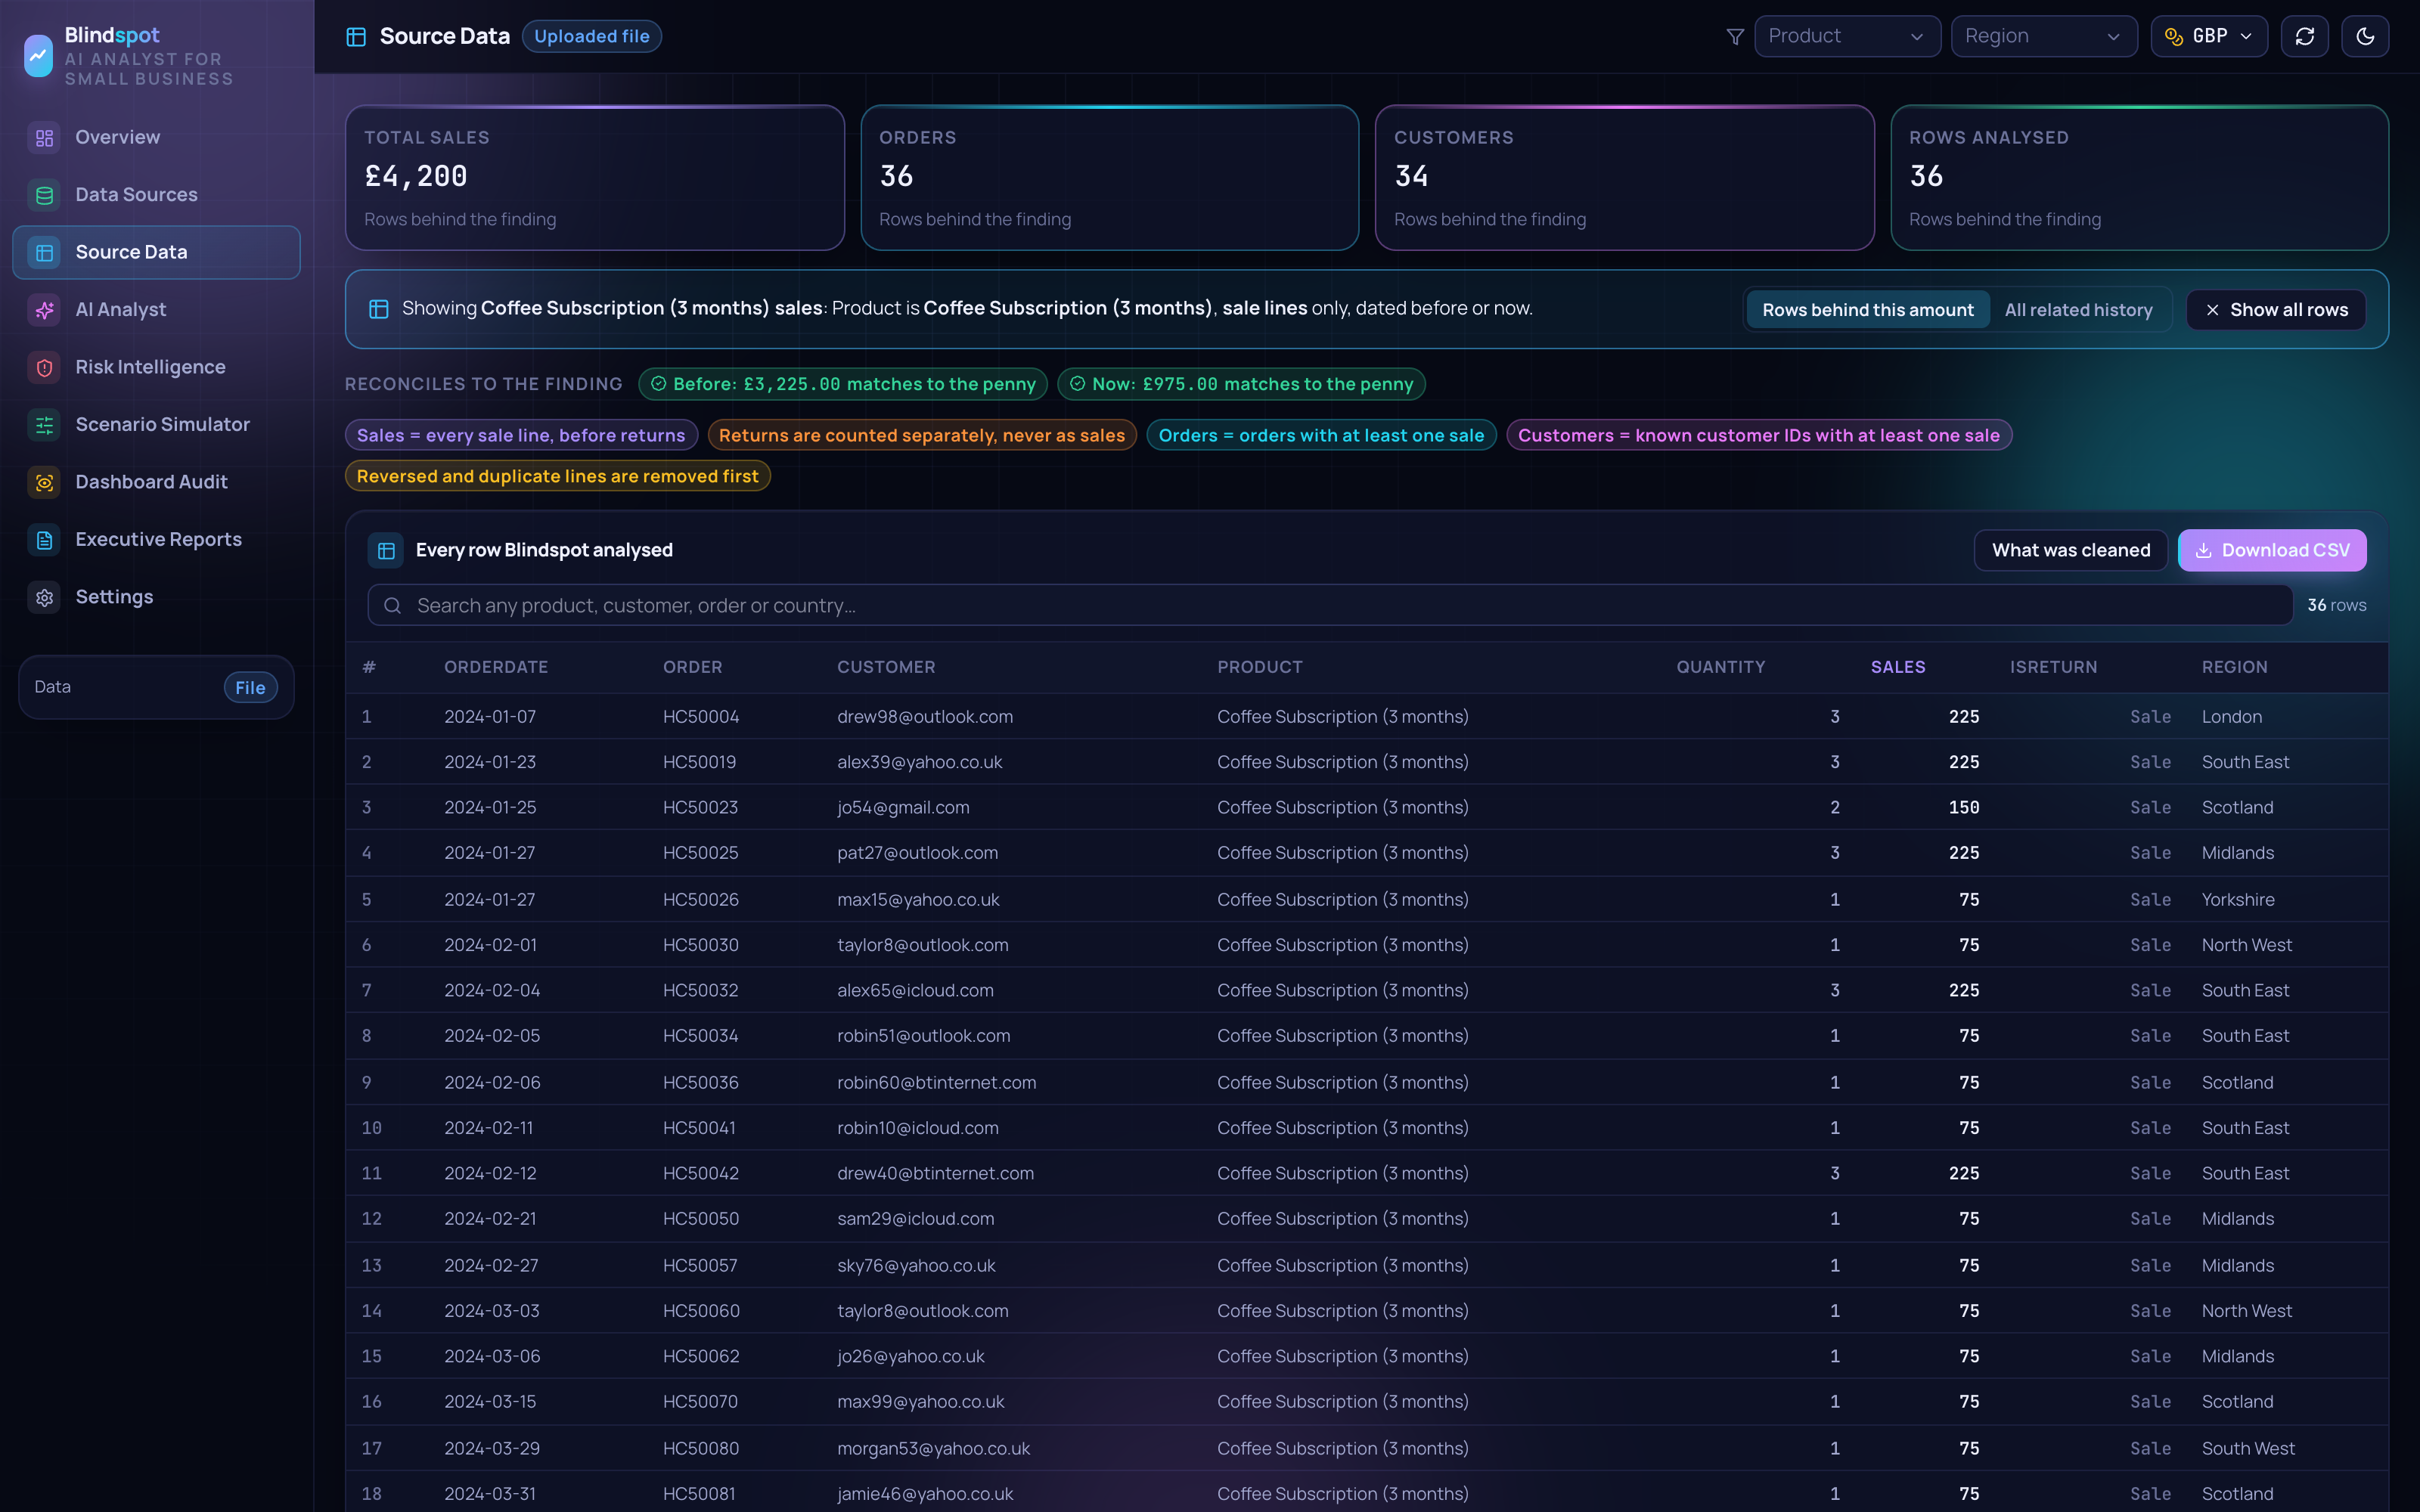
One click shows the exact rows behind a finding, reconciled to the penny.
-
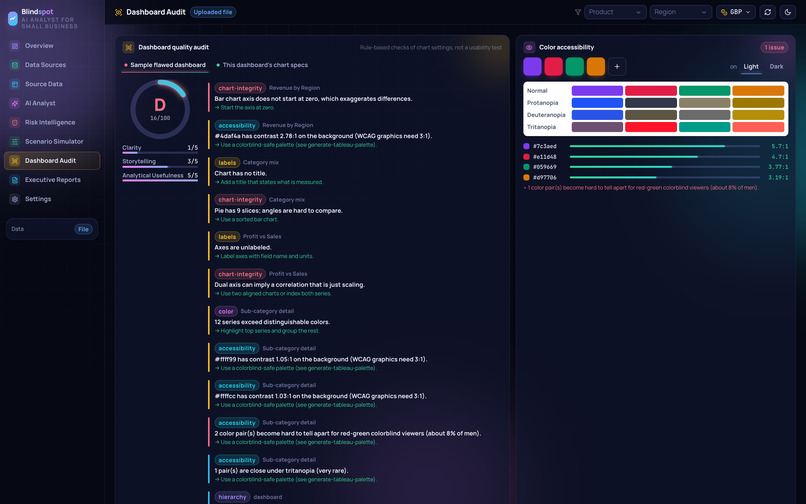
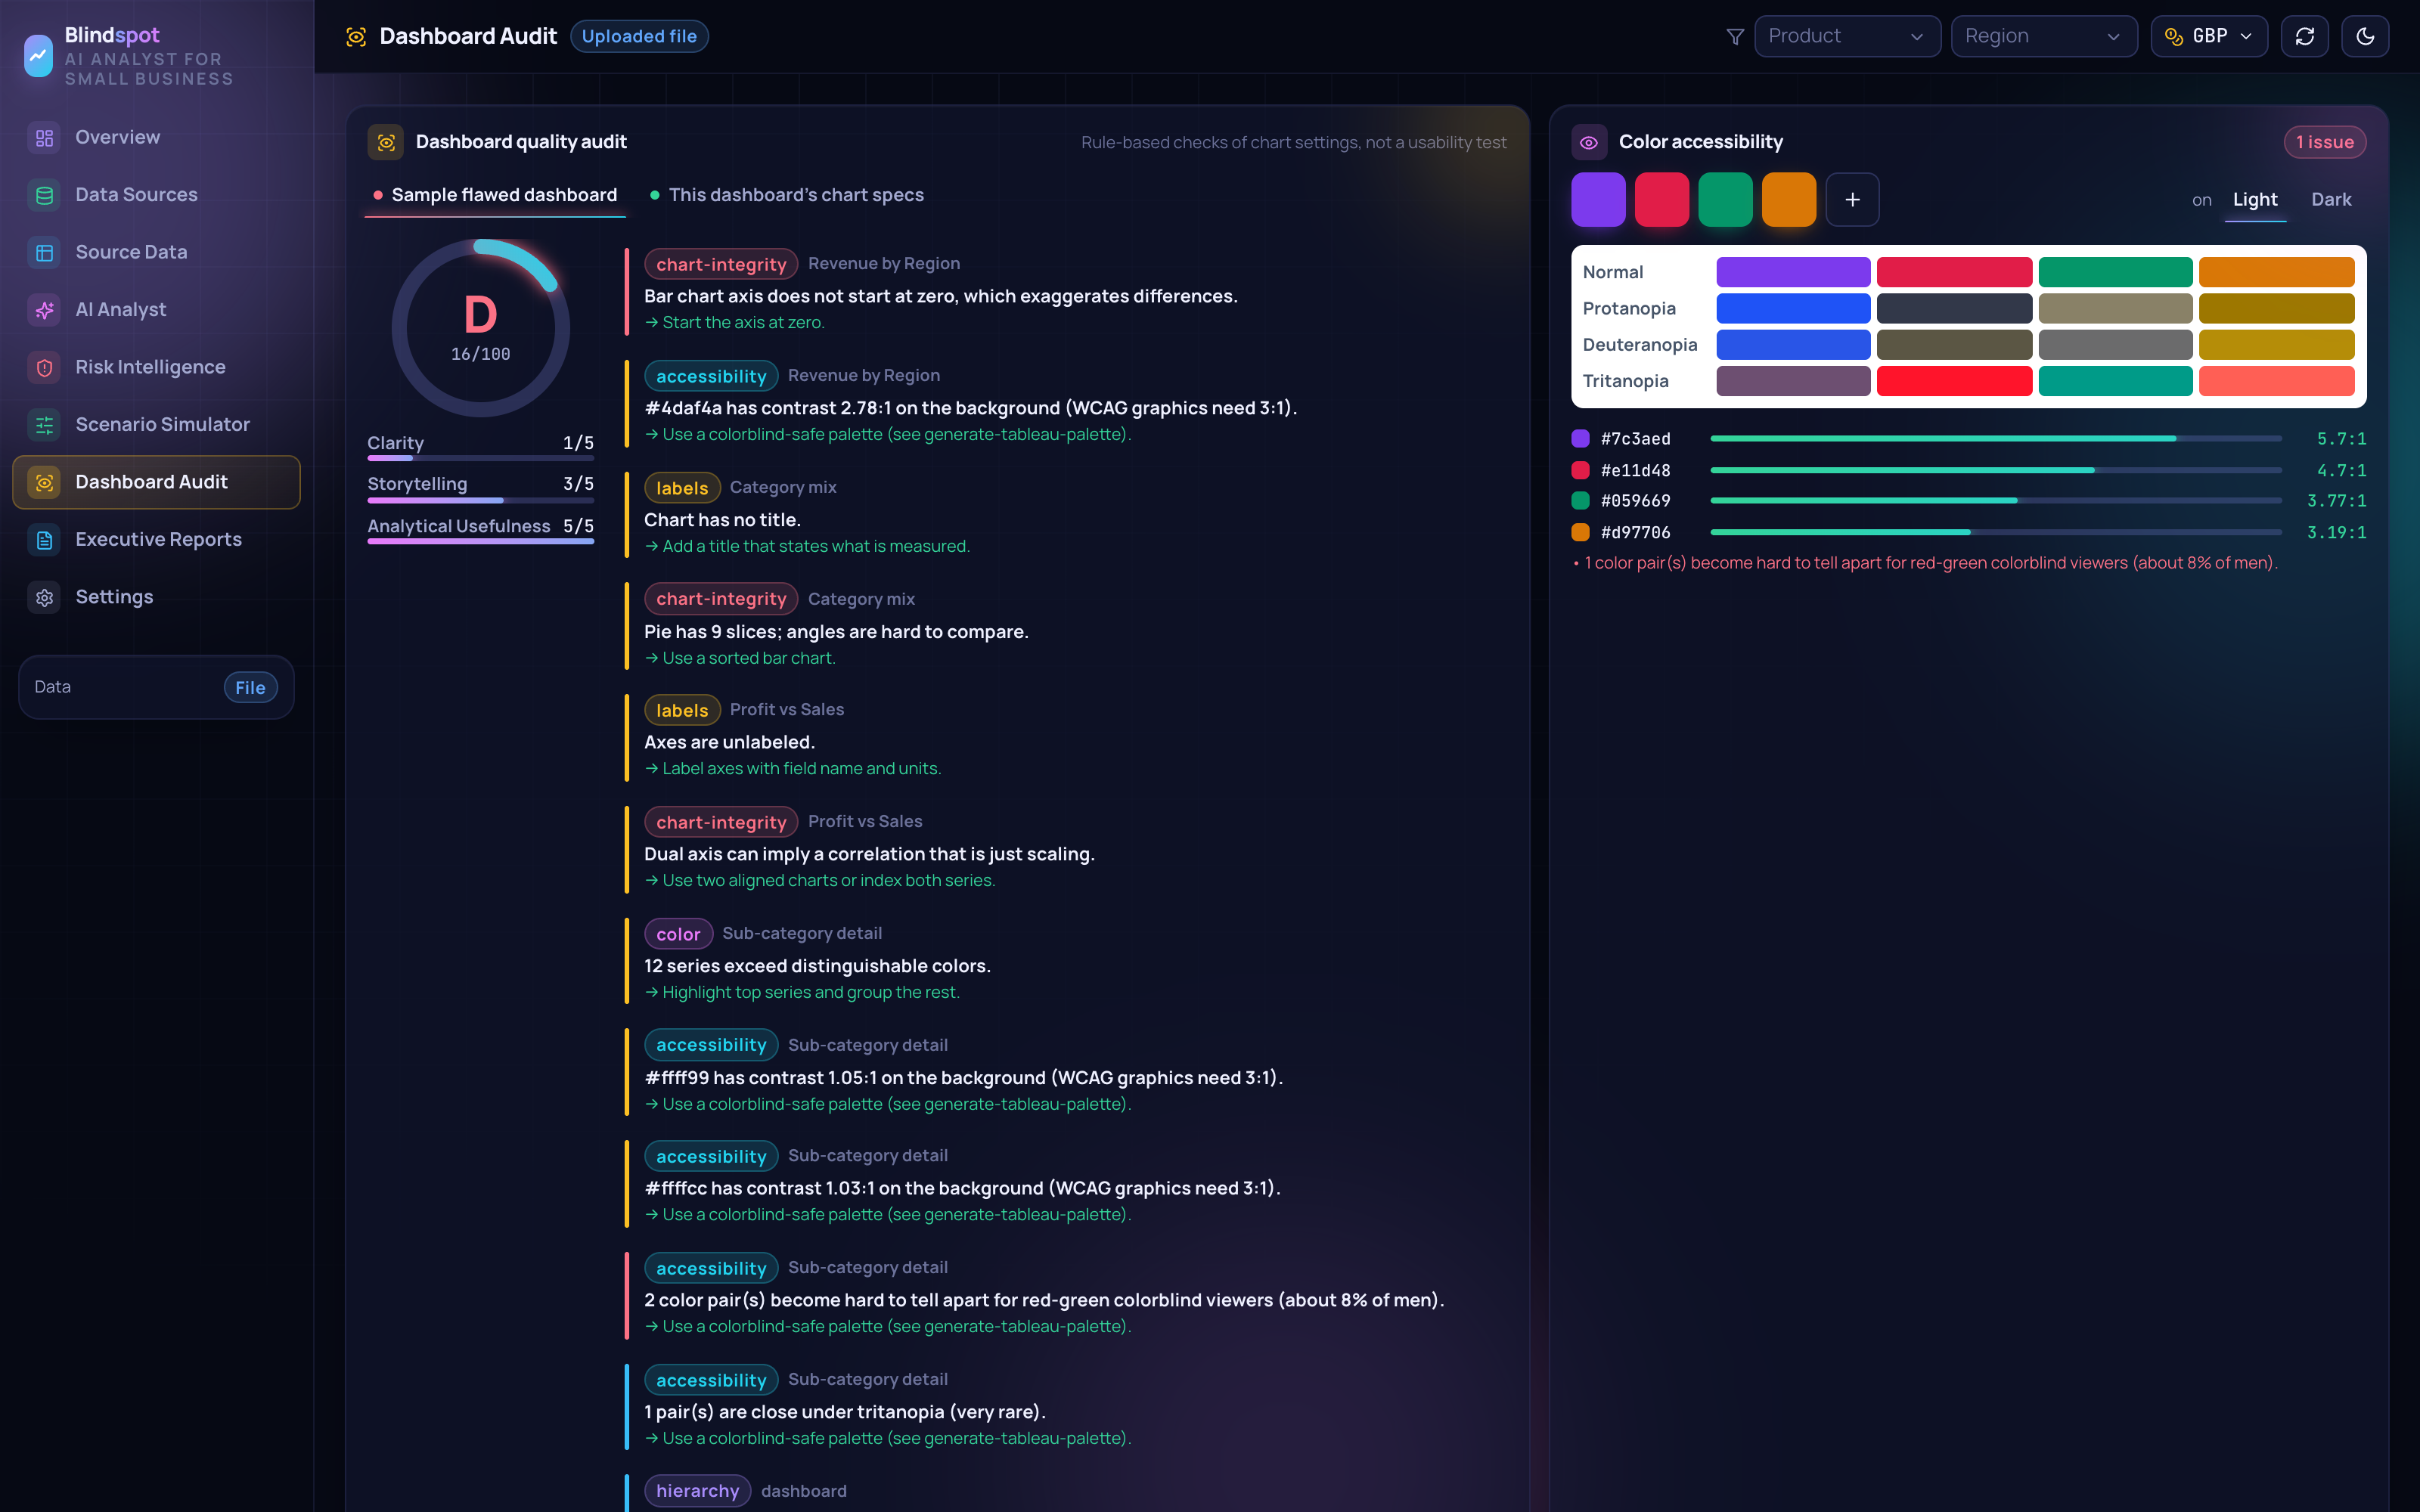
Grades dashboards for misleading charts and colors that color-blind viewers can’t tell apart.
-
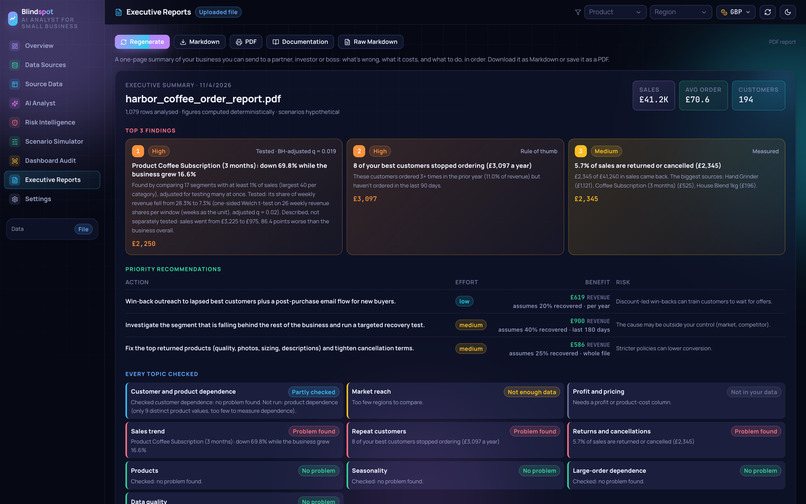
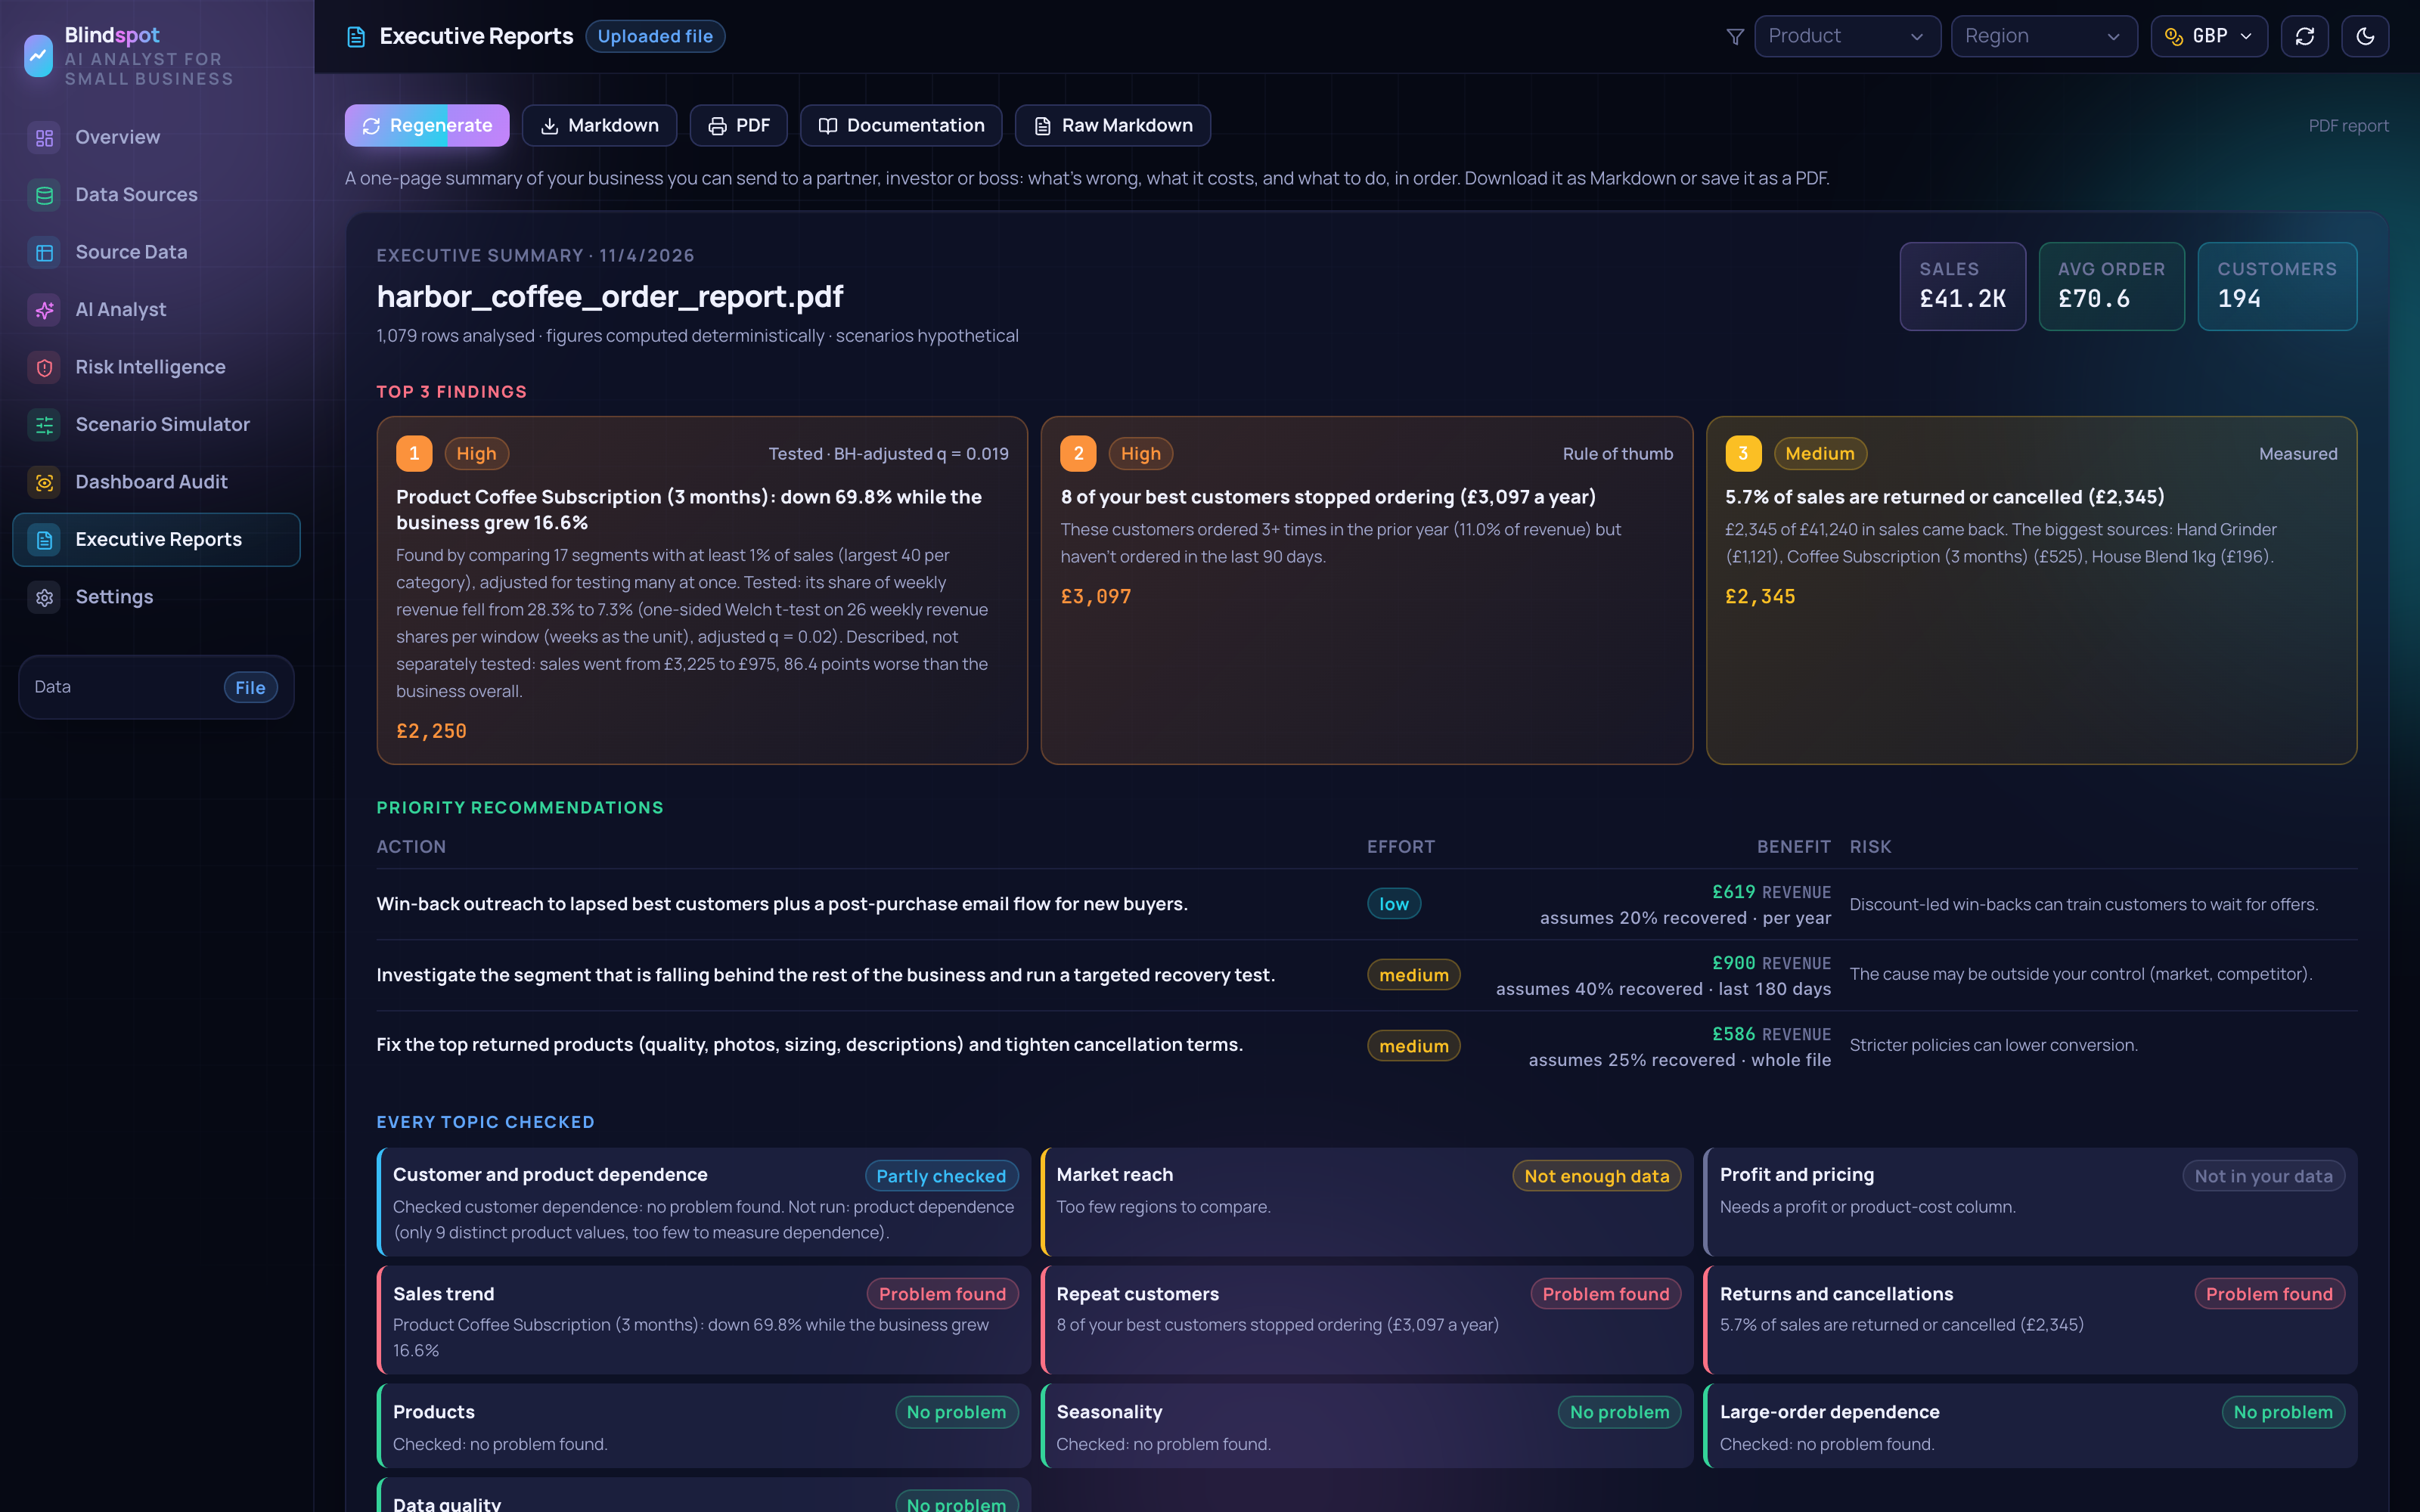
A one-page report: the top problems, what fixing each could be worth, and the assumption behind every estimate.
Inspiration
I kept seeing the same story play out in small online stores: sales looked fine, while the best customers quietly walked away. The monthly total went up, the chart pointed in the right direction, and everyone relaxed. Months later the owner would discover that a loyal wholesale buyer had stopped ordering in the spring, or that their best-selling product had been fading for a whole season. The warning signs were sitting in the sales data the entire time.
The data knew. Nobody asked it. Every chart said **growing. None said **going.
That's the gap BlindSpot is built for. Dashboards are good at showing what happened, but they never explain why. A total can keep rising while one important customer disappears, while returns eat the margin, or while a product that used to sell every week drops to zero. These problems don't announce themselves. They drain money quietly, and by the time they show up in the total, it's late.
Big companies solve this by paying analysts and data teams to hunt for these problems every week. A small shop gets a spreadsheet, a hunch and a hope. That matters, because winning a new customer costs five to twenty-five times more than keeping one, and roughly one in five new businesses doesn't survive its first year. What you can't see can sink you.
So I set out to build the analyst a small shop can't afford to hire, with one rule I refused to break: every number it shows has to be provable, right down to the row it came from.
What it does
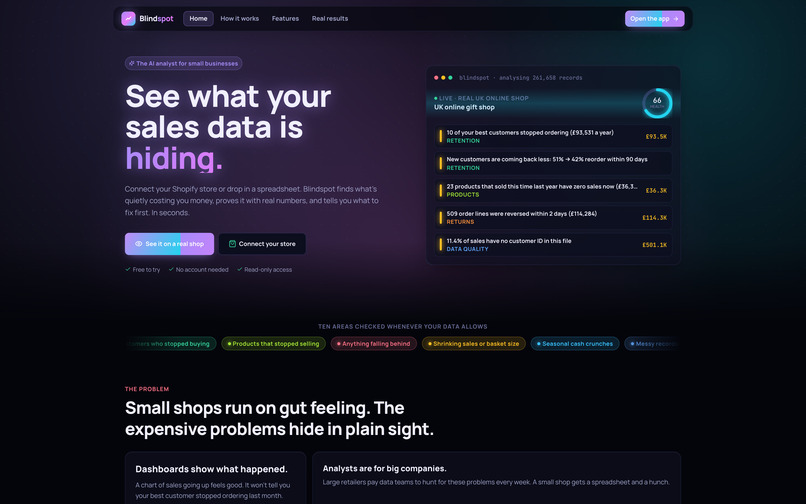
BlindSpot is an AI analyst for small online stores. You bring your sales data; it finds what's quietly costing you money, proves each problem with statistics, and tells you what to do about it.
It reads your export as it is. You can upload a CSV, an Excel file or even a long PDF sales report, from Shopify, Etsy, Amazon, Square, WooCommerce, Stripe, Tableau or any spreadsheet. You can also connect a Shopify store directly with read-only access. Real exports are messy: columns have strange names, headers can be in another language, orders are split across lines, refunds are mixed in with sales. BlindSpot handles all of that. Before it shows you a single result, it shows you how it read your file. You see which column it took as the date, the amount, the customer and the order number; every row it fixed or left out, with line numbers; and exactly how the rows in your file became the records it analyzed. If it read a column wrong, you pick the right one and it re-reads instantly. If your file never says what currency it's in, it asks you instead of assuming dollars.
It cleans the mess. Exact duplicate lines are counted once. Returns and fees are separated from product sales. Sales with no customer attached are flagged rather than silently dropped. Order lines that were bought and then canceled within two days, which are usually mistakes or failed payments, are removed from both sales and returns, so they can't distort anything.
It finds the leaks. BlindSpot runs the checks an experienced analyst would run on any online store: best customers who stopped ordering, new customers who don't come back for a second order, return rates, products that stopped selling, changes in order size, seasonality, and dependence on a handful of customers or a few very large orders. It then scans every major product and country and compares each one with the business as a whole, always against the same weeks a year earlier, so a holiday rush can never be mistaken for real growth.
It proves every finding. Each problem is labeled with how it was established, and each money figure says what kind of money it is:
| Label | What it means |
|---|---|
| Measured | Counted directly from your rows |
| Tested | Passed a statistical test, shown with its p-value or adjusted q-value |
| Rule of thumb | A clear threshold, such as "3+ orders last year, none in 90 days" |
| Possible… (not confirmed) | A signal that didn't survive the statistics, shown honestly |
| Not judged | A check your data couldn't support, with the reason why |
Money is marked as lost, at risk, reversed (never earned) or untracked (not lost, just not linked to a customer), so nothing is presented as a loss when it isn't one.
It shows the exact rows. Every finding has a See the affected rows button. It opens the precise records behind the number (the same customers or products, the same dates, the same kind of row) and checks that they add up to the figure the finding reported, to the penny. A second view shows the wider history for context, and the CSV export follows whatever you're looking at.
It has an AI analyst you can talk to. You can ask questions in plain English, like "why did revenue change?" or "which customers matter most?". Claude decides which of 15 read-only analysis tools to run, runs them, and explains the real results, showing you every tool it used. It can also propose new ideas about your business, and every one of those ideas is tested with statistics before you see it. AI suggests. Math checks. The numbers always come from code, never from the model.
It tells you what to do next. The Overview gives you a health score out of 100, the single problem to fix first, and every finding ranked by the money involved. The Scenario Simulator shows what a fix could be worth, with every assumption visible and editable. The Dashboard Audit checks existing charts for misleading axes and for colors that color-blind viewers can't tell apart. The Executive Report checks ten areas of the business, lists the priority actions with the planning assumption behind each estimate, and turns everything into a 30, 90 and 180-day roadmap you can download as Markdown or PDF. Every amount can also be shown in 30 currencies at today's exchange rate.
How we built it
BlindSpot is a TypeScript monorepo. The most important design decision was to keep the math completely separate from the AI.
The analytics engine is pure code: cleaning, statistics, findings, the hypothesis engine, scenarios and reports. It never calls an AI model, so its results are fast, free, and identical every time you run them. On top of it sits a layer of 34 tool contracts, each a typed function validated with Zod and protected by guardrails. The same tools are served over a REST API for the web app and over the Model Context Protocol (MCP), so they also work inside Claude Desktop or VS Code. The API server is Node.js and Express, gives each visitor a private session, and talks to the Shopify Admin API with read-only access. The web app is React with Vite, Tailwind CSS, Framer Motion and Recharts. Excel files are read directly in the browser with SheetJS, and PDFs with pdf.js.
The AI layer uses Claude (Anthropic, Sonnet 5.5). Claude is only ever given read-only tools. It decides which analysis to run and explains the result in plain language, but it never computes a number itself. When it proposes a new idea about the business, that idea goes through the same statistical tests as everything else.
All of the statistics are written from scratch and checked against SciPy. Averages are compared with a Welch t-test, which doesn't assume both groups have the same spread:
$$t = \frac{\bar{x}_1 - \bar{x}_2}{\sqrt{\dfrac{s_1^2}{n_1} + \dfrac{s_2^2}{n_2}}}$$
with Welch–Satterthwaite degrees of freedom. Rates, such as how many new customers come back, use two-proportion z-tests. Totals use seeded bootstrap resampling with 2,000 resamples. Because BlindSpot tests many products and countries at once, some would look significant by pure chance, so p-values are corrected with the Benjamini–Hochberg method. After sorting the m p-values, the k-th smallest only counts if
$$p_{(k)} \le \frac{k}{m}\,\alpha$$
To make sure the numbers can be trusted, I tested BlindSpot on UCI Online Retail II, a public dataset of 1,067,371 rows of real sales records from a UK online gift shop. I then wrote a completely separate Python script that recomputes seven headline numbers from scratch, and all seven match exactly. The project has 187 automated tests covering the statistics, file reading (real PDFs, eight languages and randomly generated messy layouts), every one of the 34 tools, sessions, the API and the MCP server.
Tools and technologies
| Area | What I used |
|---|---|
| AI in the product | Claude (Anthropic API, Sonnet 5.5), Model Context Protocol (MCP) |
| AI while building | Claude Code for coding; Claude, ChatGPT and Gemini for brainstorming and idea generation |
| Language | TypeScript (end to end) |
| Frontend | React 18, Vite, Tailwind CSS, Framer Motion, Recharts, lucide-react icons, Manrope font |
| File reading | pdf.js (PDF tables), SheetJS (Excel), Papa Parse (CSV) |
| Backend | Node.js 22, Express, WebSockets (ws), express-rate-limit |
| Validation and tools | Zod (34 typed tool contracts with guardrails) |
| Data and APIs | Shopify Admin API (read-only), European Central Bank exchange rates (frankfurter.dev), UCI Online Retail II dataset |
| Statistics | My own engine: Welch t-test, two-proportion z-test, bootstrap, Benjamini–Hochberg (checked against SciPy) |
| Testing | Vitest (187 tests), Python (independent fact check) |
| Hosting and DevOps | Docker, Render, GitHub, GitHub Actions |
Challenges we ran into
An 80,995-unit order that never happened. The real dataset contains a single order of 80,995 units, worth £168K, that was canceled the same day. Counted naively, it inflated both sales and returns and threw off every ratio in the store. The fix was to pair each cancellation with the exact sale it mirrors (same customer, same product, same quantity, same price, within two days) and remove both sides (simplified):
const cands = open.get(`${r.Customer}|${r.Product}|${-r.Quantity}|${r.Sales / r.Quantity}`);
const j = cands?.findIndex((si) => !drop.has(si) && rt - Date.parse(out[si].OrderDate) <= 2 * DAYMS);
if (j >= 0) { const si = cands.splice(j, 1)[0]; drop.add(si); drop.add(i); rep.cancelledPairs++; }
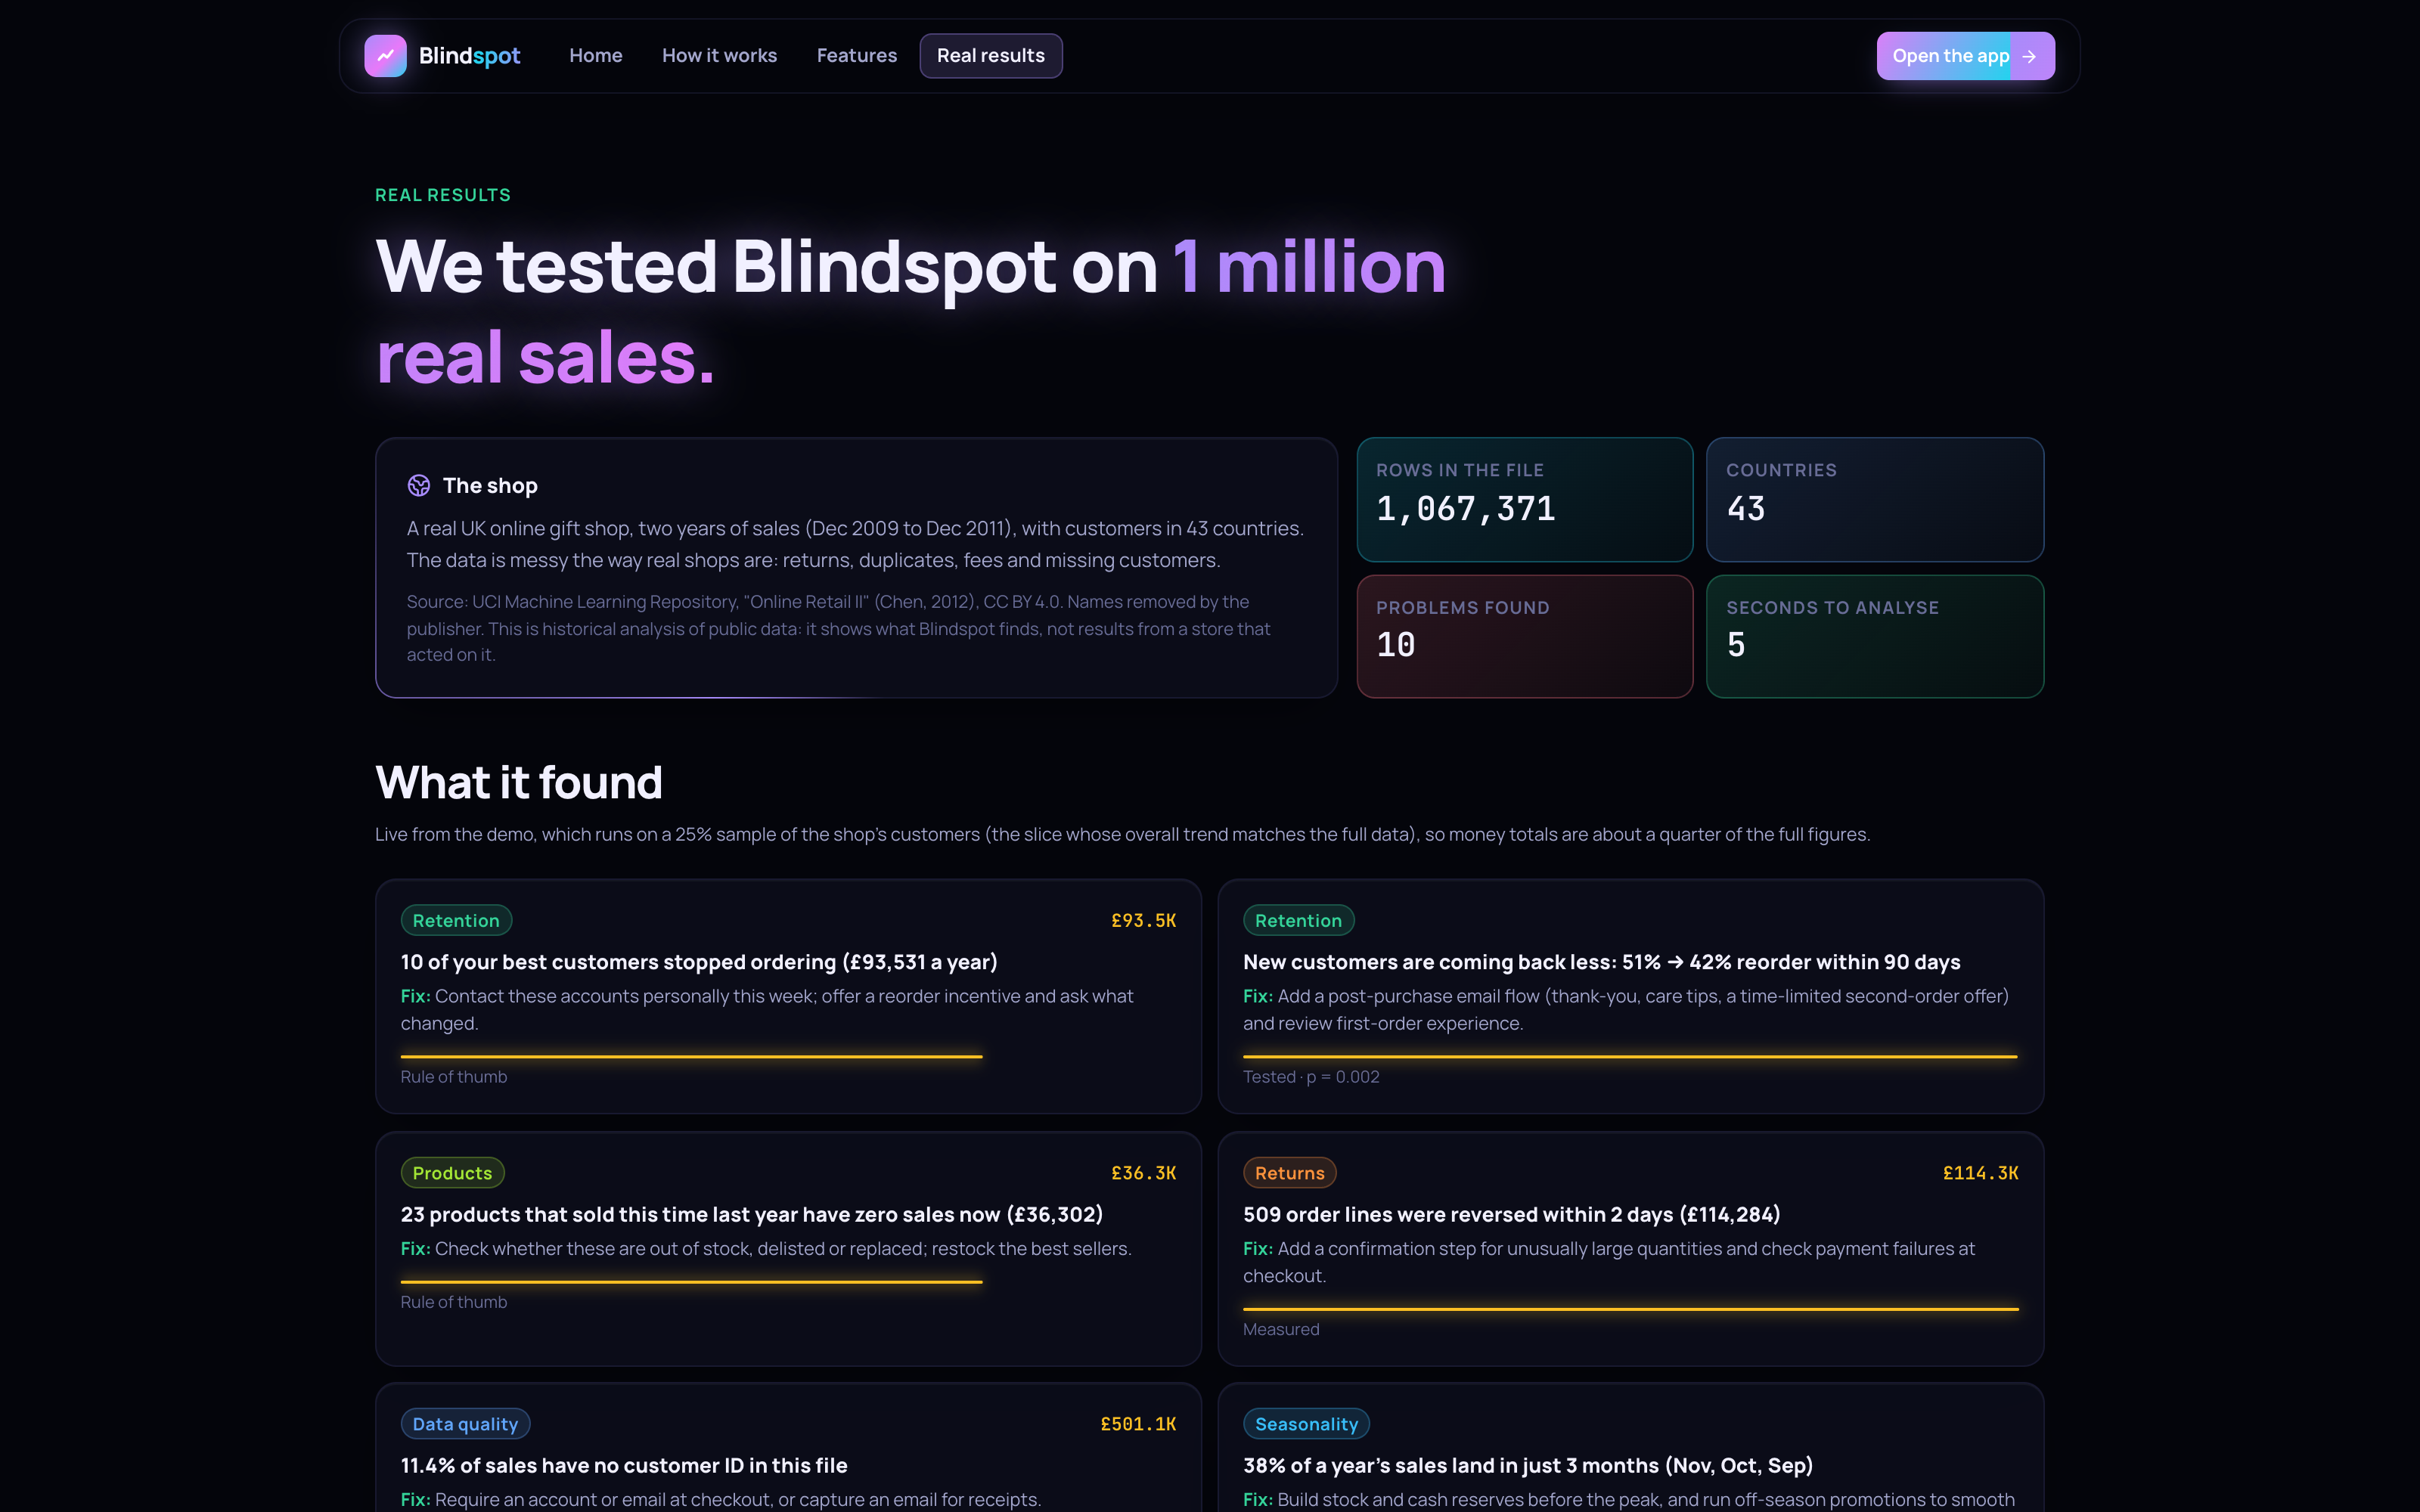
Across the full dataset this removed 1,978 reversed lines worth £392,675, and the independent Python check arrived at exactly the same figure.
PDFs don't contain tables. To a computer, a PDF is just individual words at x and y positions; there are no rows or columns. My first PDF reader turned one sample report's $81K of sales into $42K, because product names that wrapped onto a second line were read as separate rows. The solution was to look at the vertical spacing on each page. The gap between rows is larger than the gap between two wrapped lines inside the same row, so when the spacing clearly splits into two sizes, anything closer than the midpoint belongs to the same row:
function rowGap(lines: Line[]): number {
  const gaps = lines.slice(1).map((l, i) => lines[i].y - l.y).filter((g) => g > 0.5).map((g) => Math.round(g * 2) / 2);
  const u = [...new Set(gaps)].sort((a, b) => a - b);
  let best = 0, ratio = 1;
  for (let i = 0; i + 1 < u.length; i++) { const r = u[i + 1] / u[i]; if (r > ratio && u[i + 1] - u[i] >= 3) { ratio = r; best = (u[i] + u[i + 1]) / 2; } }
  return ratio >= 1.6 ? best : 0;   // 0 = nothing wraps on this page
}
Column edges are placed halfway between the column headings, and stacked cells are joined back together. Both sample PDF reports now match their true totals exactly, and a 68-page report reads in one pass.
"Total Paid" was ignored because it contains "id". Column detection originally threw away anything that looked like an ID column using a simple substring check, so a column called "Total Pa*id" silently disappeared. Shopify exports also repeat the order total on every line of a multi-item order, which double-counted revenue. I rewrote column detection to match whole words and to score each column on its *values as well as its name, checking whether they look like percentages, emails, serial numbers or money. An order total that repeats across an order's lines is now detected and counted once.
A 512 MB server versus a million rows. BlindSpot runs on a free server with 512 MB of memory. Reading 150,000 uploaded rows pushed memory to about 445 MB, dangerously close to crashing. I trimmed rows in place instead of copying them, freed each processing stage as soon as it finished, decided which columns to keep before building row objects, and let the CSV parser stop early. Uploads are capped at 100,000 rows, with a shared row budget across visitors. The million-row case study ships pre-cleaned and dictionary-encoded, so the server loads it instantly at startup.
Honest statistics made my best demo less dramatic. My first anomaly scan treated every order line as an independent piece of evidence, and one best-seller's decline came out as p < 0.001. But lines in the same order, and orders from the same customer, aren't independent, so that result overstated the certainty. I switched to weeks as the unit of evidence. Each week gives one number (the product's share of that week's revenue), and the two years are compared with a one-sided Welch test, then corrected across every segment scanned:
const sb = e.wb.flatMap((v, i) => (totB[i] > 0 ? [v / totB[i]] : []));   // weekly share, a year earlier
const sc = e.wc.flatMap((v, i) => (totC[i] > 0 ? [v / totC[i]] : []));   // weekly share, now
const test = welchTest(sc, sb);                                          // one-sided: did the share fall?
That headline drop became q = 0.27, not confirmed, so BlindSpot now shows it as "Possible… (not confirmed)" instead of presenting it as fact. It made my demo less dramatic, but the product became far more trustworthy, and that trade was worth it.
Recommendations counted the same money twice. When two findings pointed to the same action, BlindSpot originally added their estimated benefits together. But "your top customers" and "your top products" can describe the same sales, so adding them double-counted. Merged actions now carry the largest single estimate, keep its own time period, and list the other estimates alongside without adding them.
The AI caught one of my bugs. While I was testing the AI analyst on real data, Claude pointed out that returns were counted one way on one screen and another way on a different screen. It was right. I fixed it and wrote one shared definition of sales, returns, orders and customers, which is now shown on the Source Data page so anyone can check it.
Accomplishments that we're proud of
I'm most proud that every number in BlindSpot traces back to rows that reconcile to the penny. It's easy to build a dashboard that looks smart; it's much harder to build one you can audit. Being able to click a finding, see the exact records behind it, and watch them add up to the reported amount is the moment that makes people trust it.
I'm also proud that a messy, 68-page PDF sales report can go from upload to ranked, proven findings in a single flow, with BlindSpot explaining exactly how it read every column along the way. Finally, I'm proud that BlindSpot says "not confirmed" and "not judged" when it should. An analyst that admits uncertainty is far more useful than one that overclaims.
BlindSpot by the numbers
| Rows of real sales records tested | 1,067,371 |
| Headline numbers matching an independent Python check | 7 of 7 |
| Automated tests passing | 187 |
| Typed analysis tools (15 available to the AI chat) | 34 |
| Areas of the business checked in every report | 10 |
| Currencies supported at today's rate | 30 |
| Header languages tested | 8 |
What we learned
The biggest lesson was that AI is most useful when it's checked. Letting Claude suggest ideas freely, and then making the math decide, gave me something that's both creative and trustworthy. Neither half works as well on its own.
I also learned that real data beats demo data. Almost every serious bug I fixed — the canceled mega-order, the "Total Paid" column, wrapped PDF cells, repeated order totals — only appeared because I tested on real sales instead of tidy sample data. And I learned that showing your work builds trust. Line numbers, column reports, cleaning summaries and exact rows convince people more than any claim on a landing page. Finally, "not confirmed" is an answer too. Being honest about what the data can't prove is part of being right.
What's next for BlindSpot
The next step is more live connectors, so WooCommerce, Square and Stripe stores can connect directly instead of exporting files. After that come weekly alerts that email an owner the week a new problem starts, instead of waiting for them to check. I'd also like to add private benchmarks, so a shop can see where it's ahead of or behind similar stores without sharing its raw data, and forecasting that shows what next month looks like if nothing changes. Finally, a mobile-first layout would suit the many owners who run their shop entirely from a phone.
Every sale tells a story. BlindSpot reads them all.
Built With
- anthropic-api
- chatgpt
- claude
- claude-code
- docker
- express.js
- framer-motion
- gemini
- github
- model-context-protocol
- node.js
- papa-parse
- pdf.js
- python
- react
- recharts
- render
- sheetjs
- shopify-api
- tailwind-css
- typescript
- vite
- vitest
- zod
