-
-
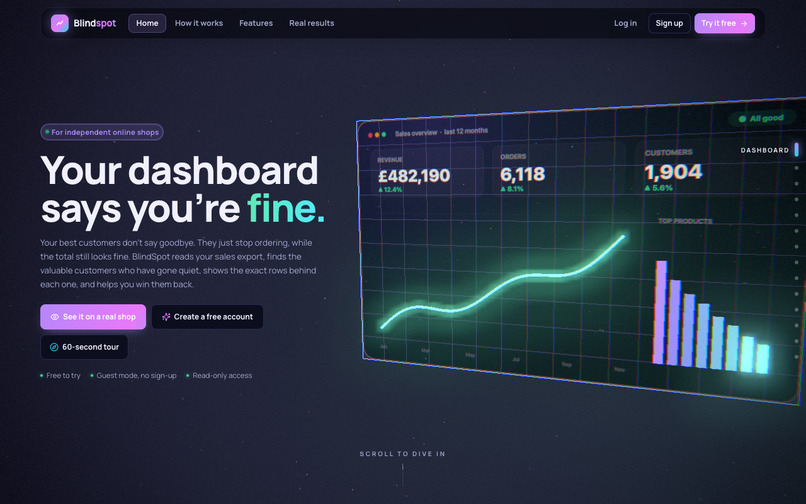
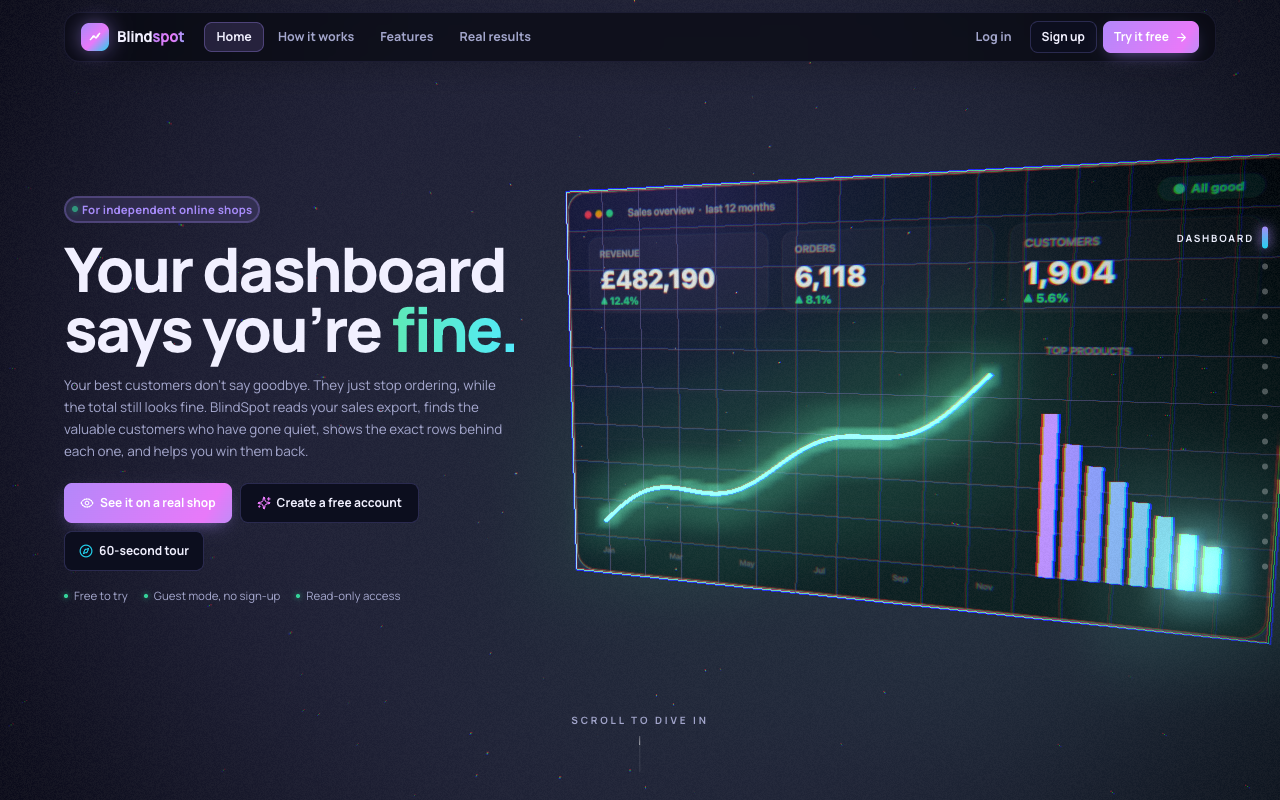
The landing page: a glass dashboard builds itself and says your sales are fine
-
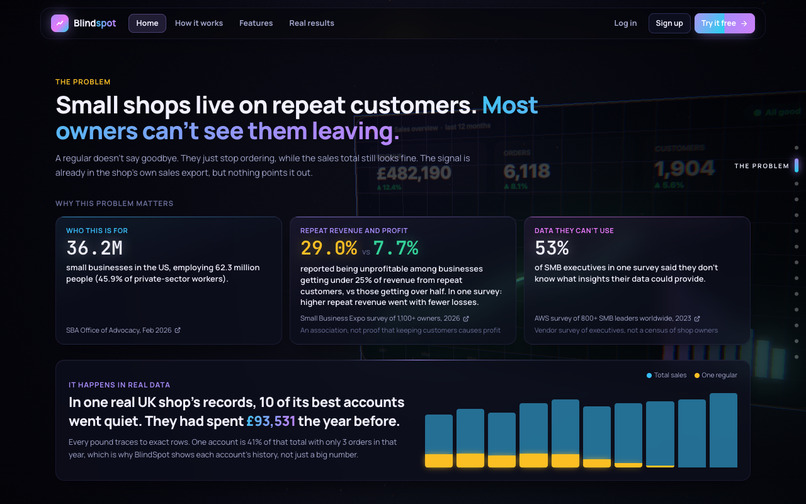
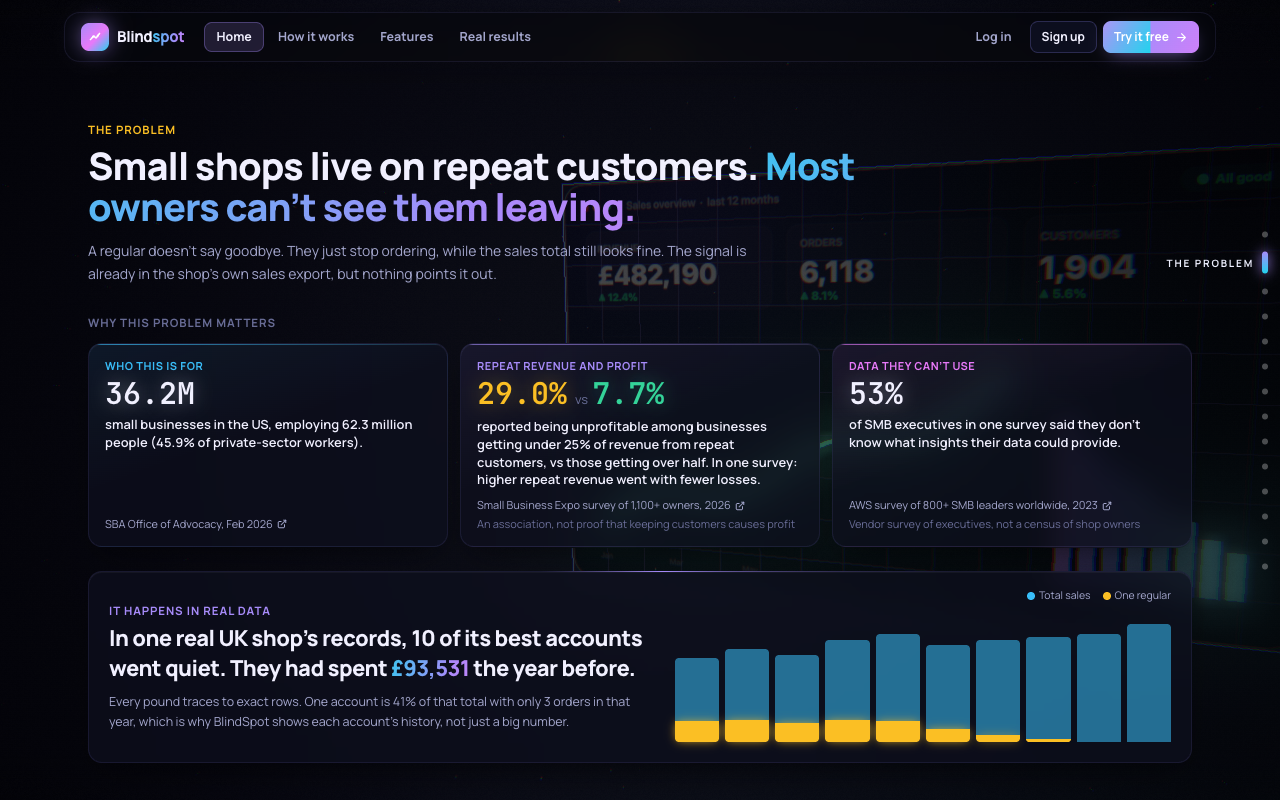
The problem, with sources: small shops live on repeat customers but can’t see them leaving
-
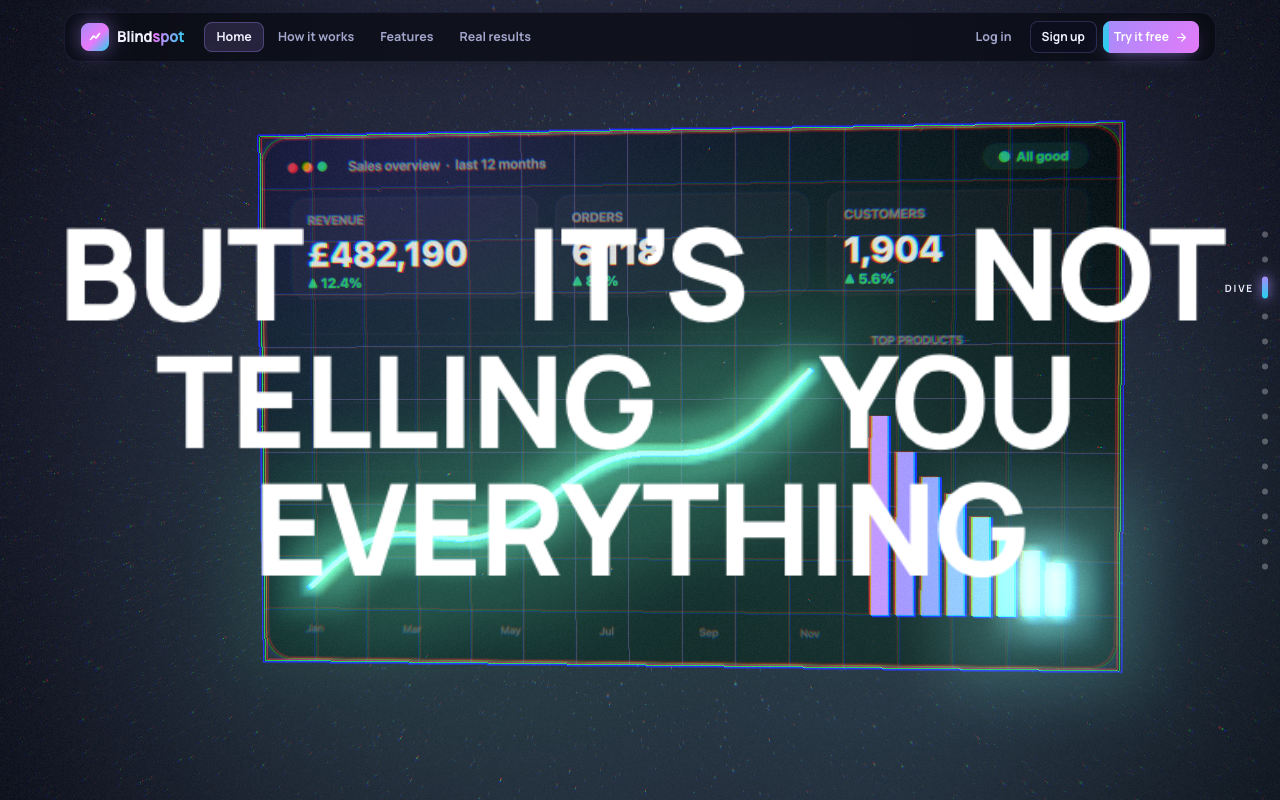
“But it’s not telling you everything”: you dive into the dashboard’s screen
-
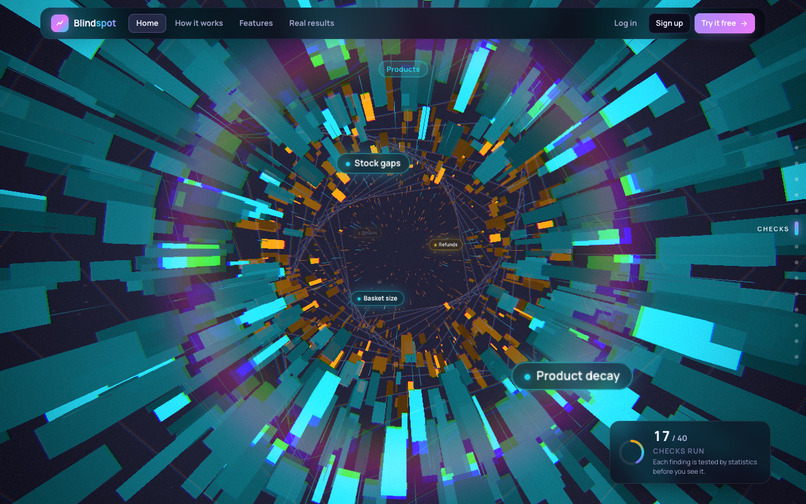
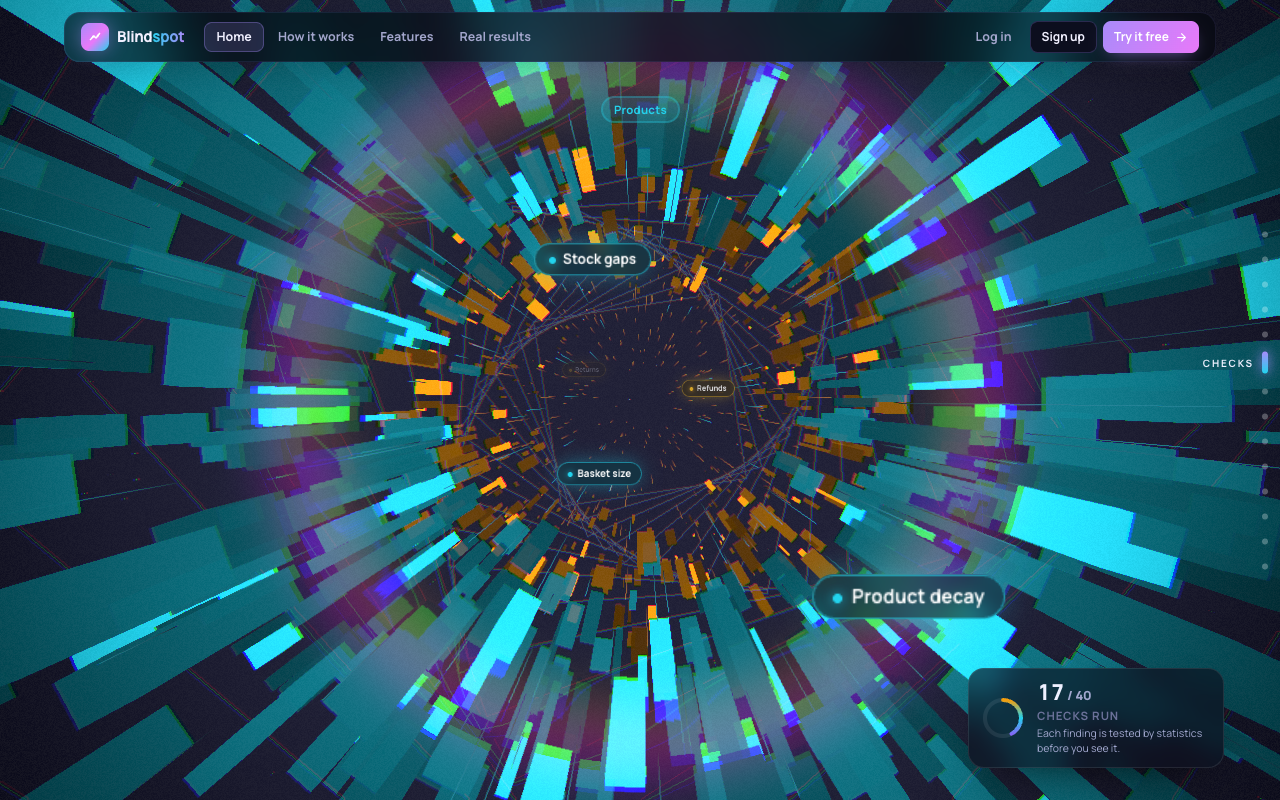
Flying down the tunnel of checks: 40 checks across customers, products and money
-
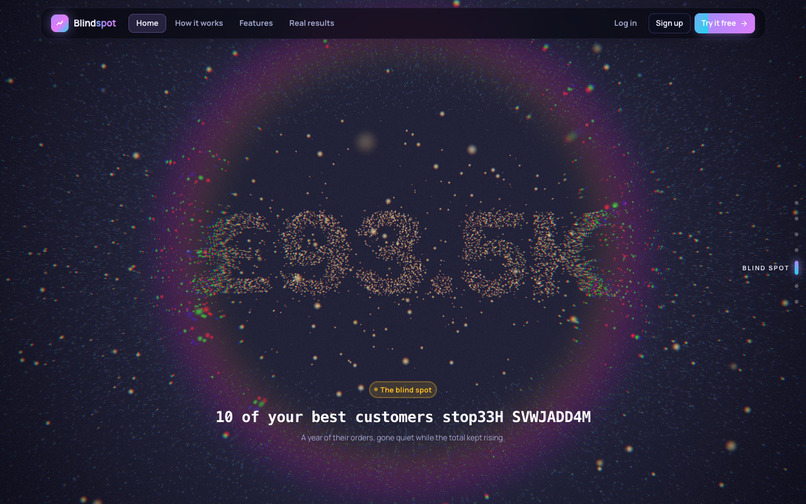
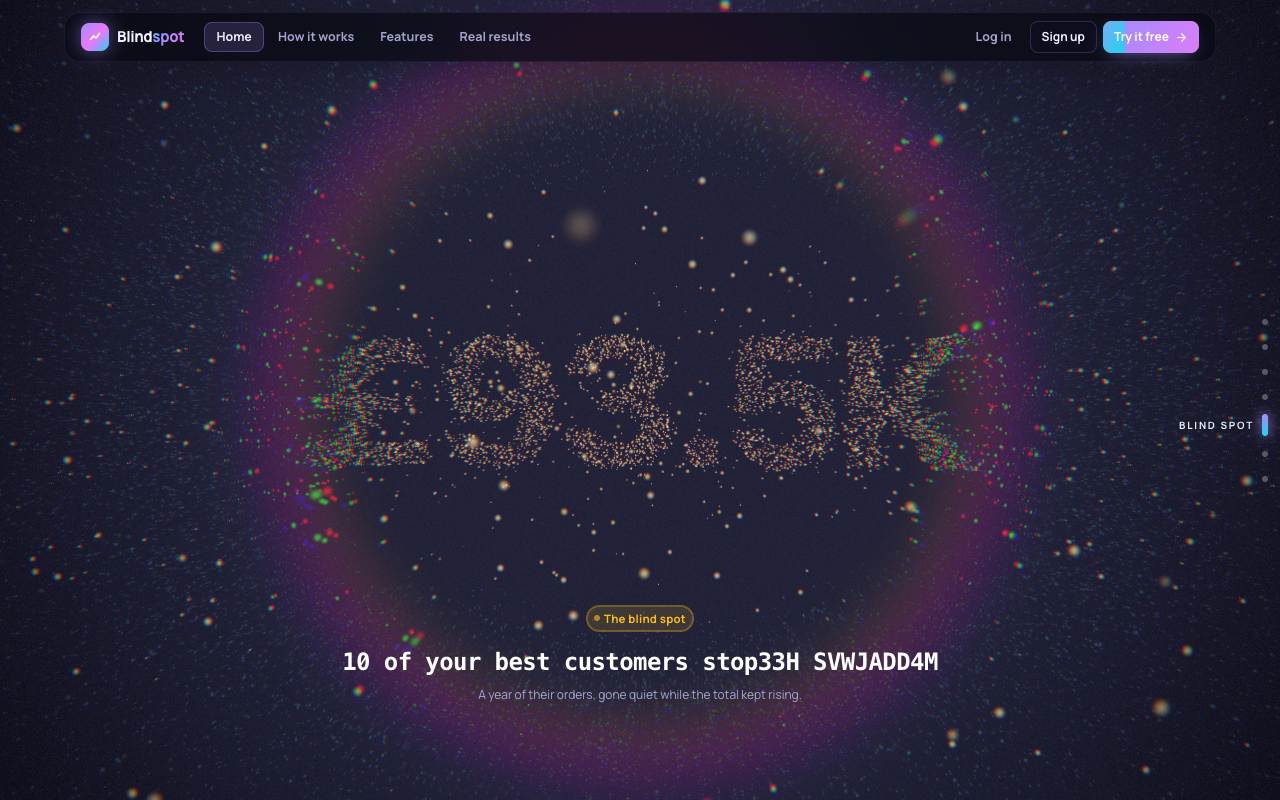
38,000 points gather into the hidden number: £93.5K in lost top customers
-
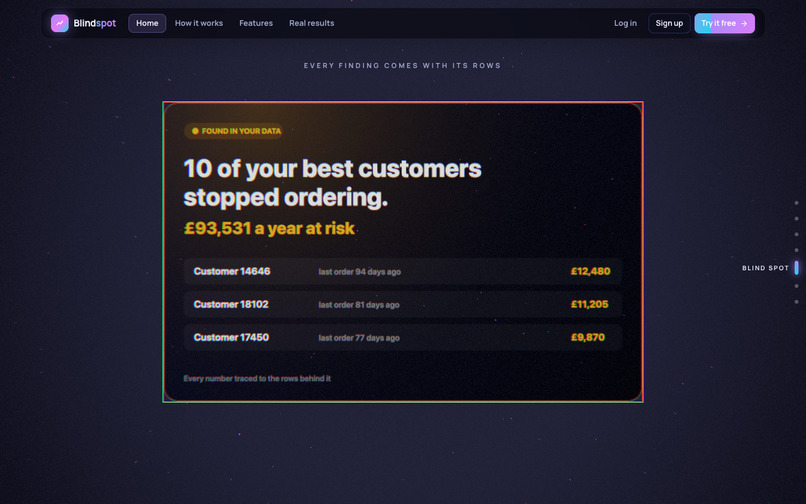
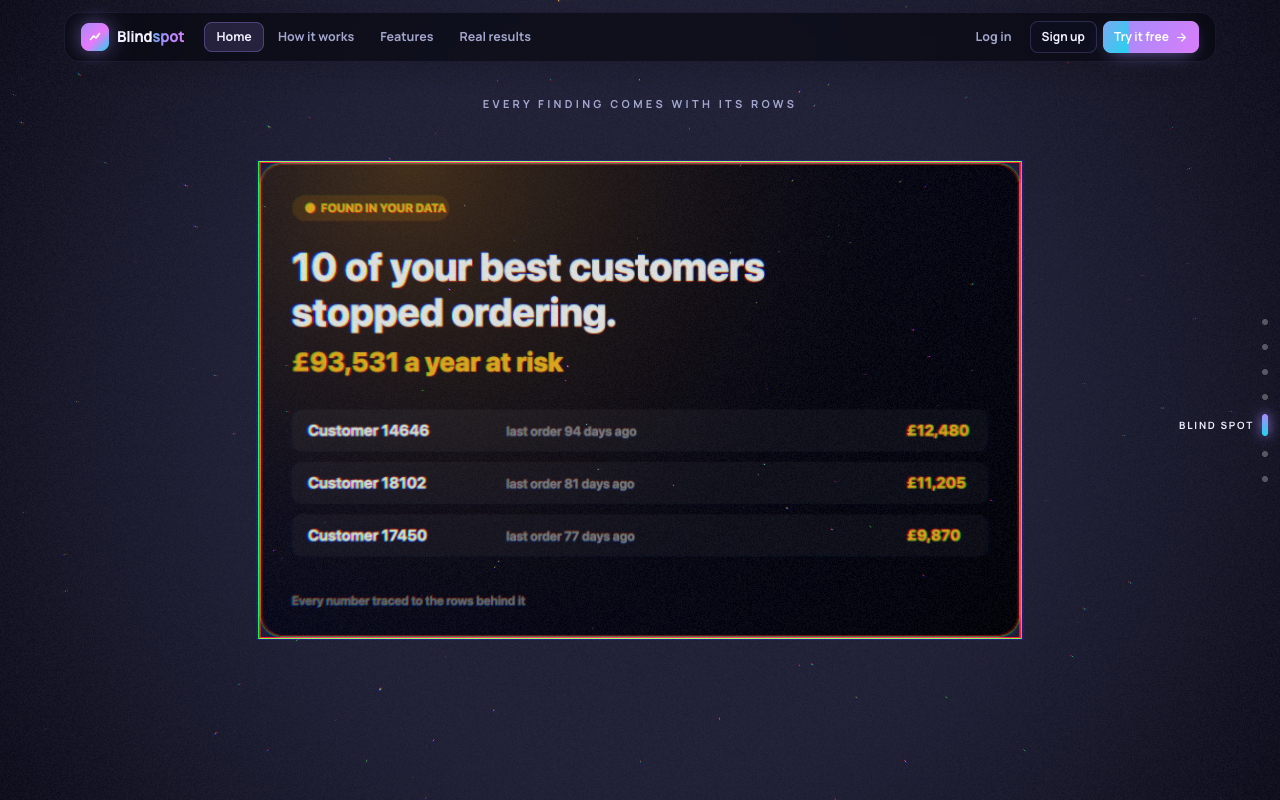
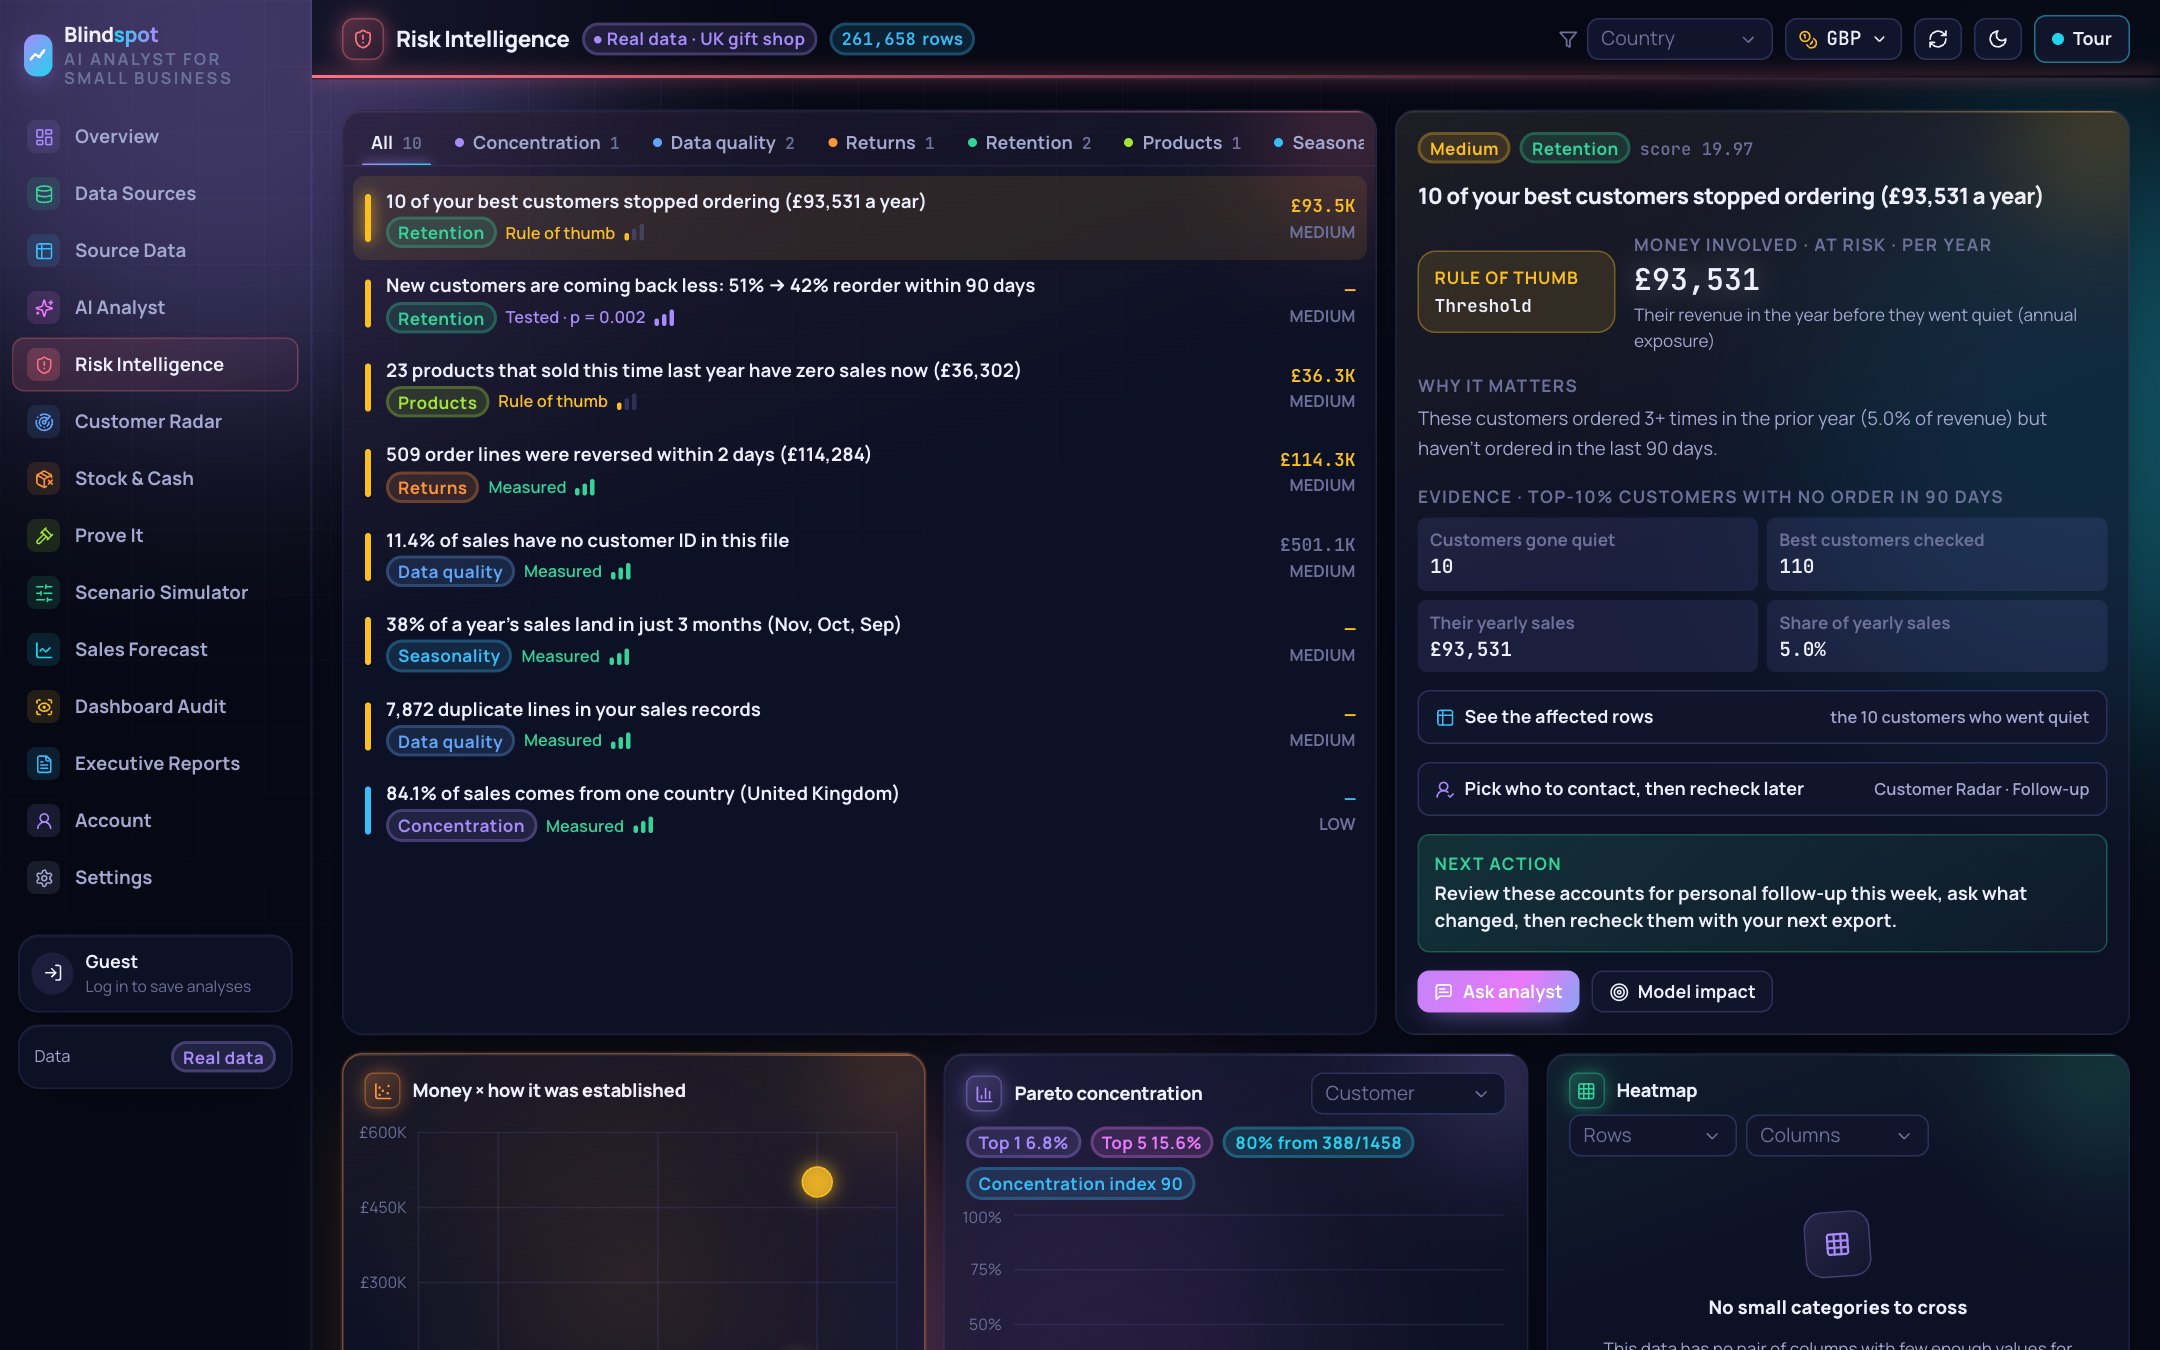
The finding: 10 best customers stopped ordering, traced to the exact rows
-

See your blind spot: try the live demo on a real shop, no sign-up needed
-
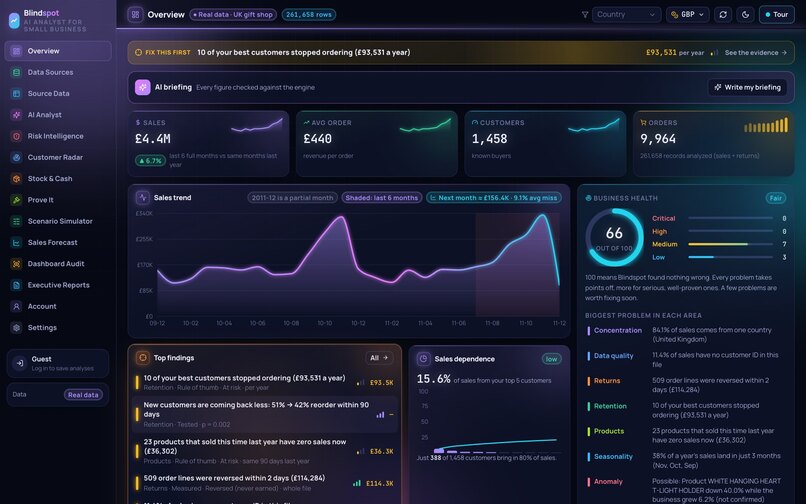
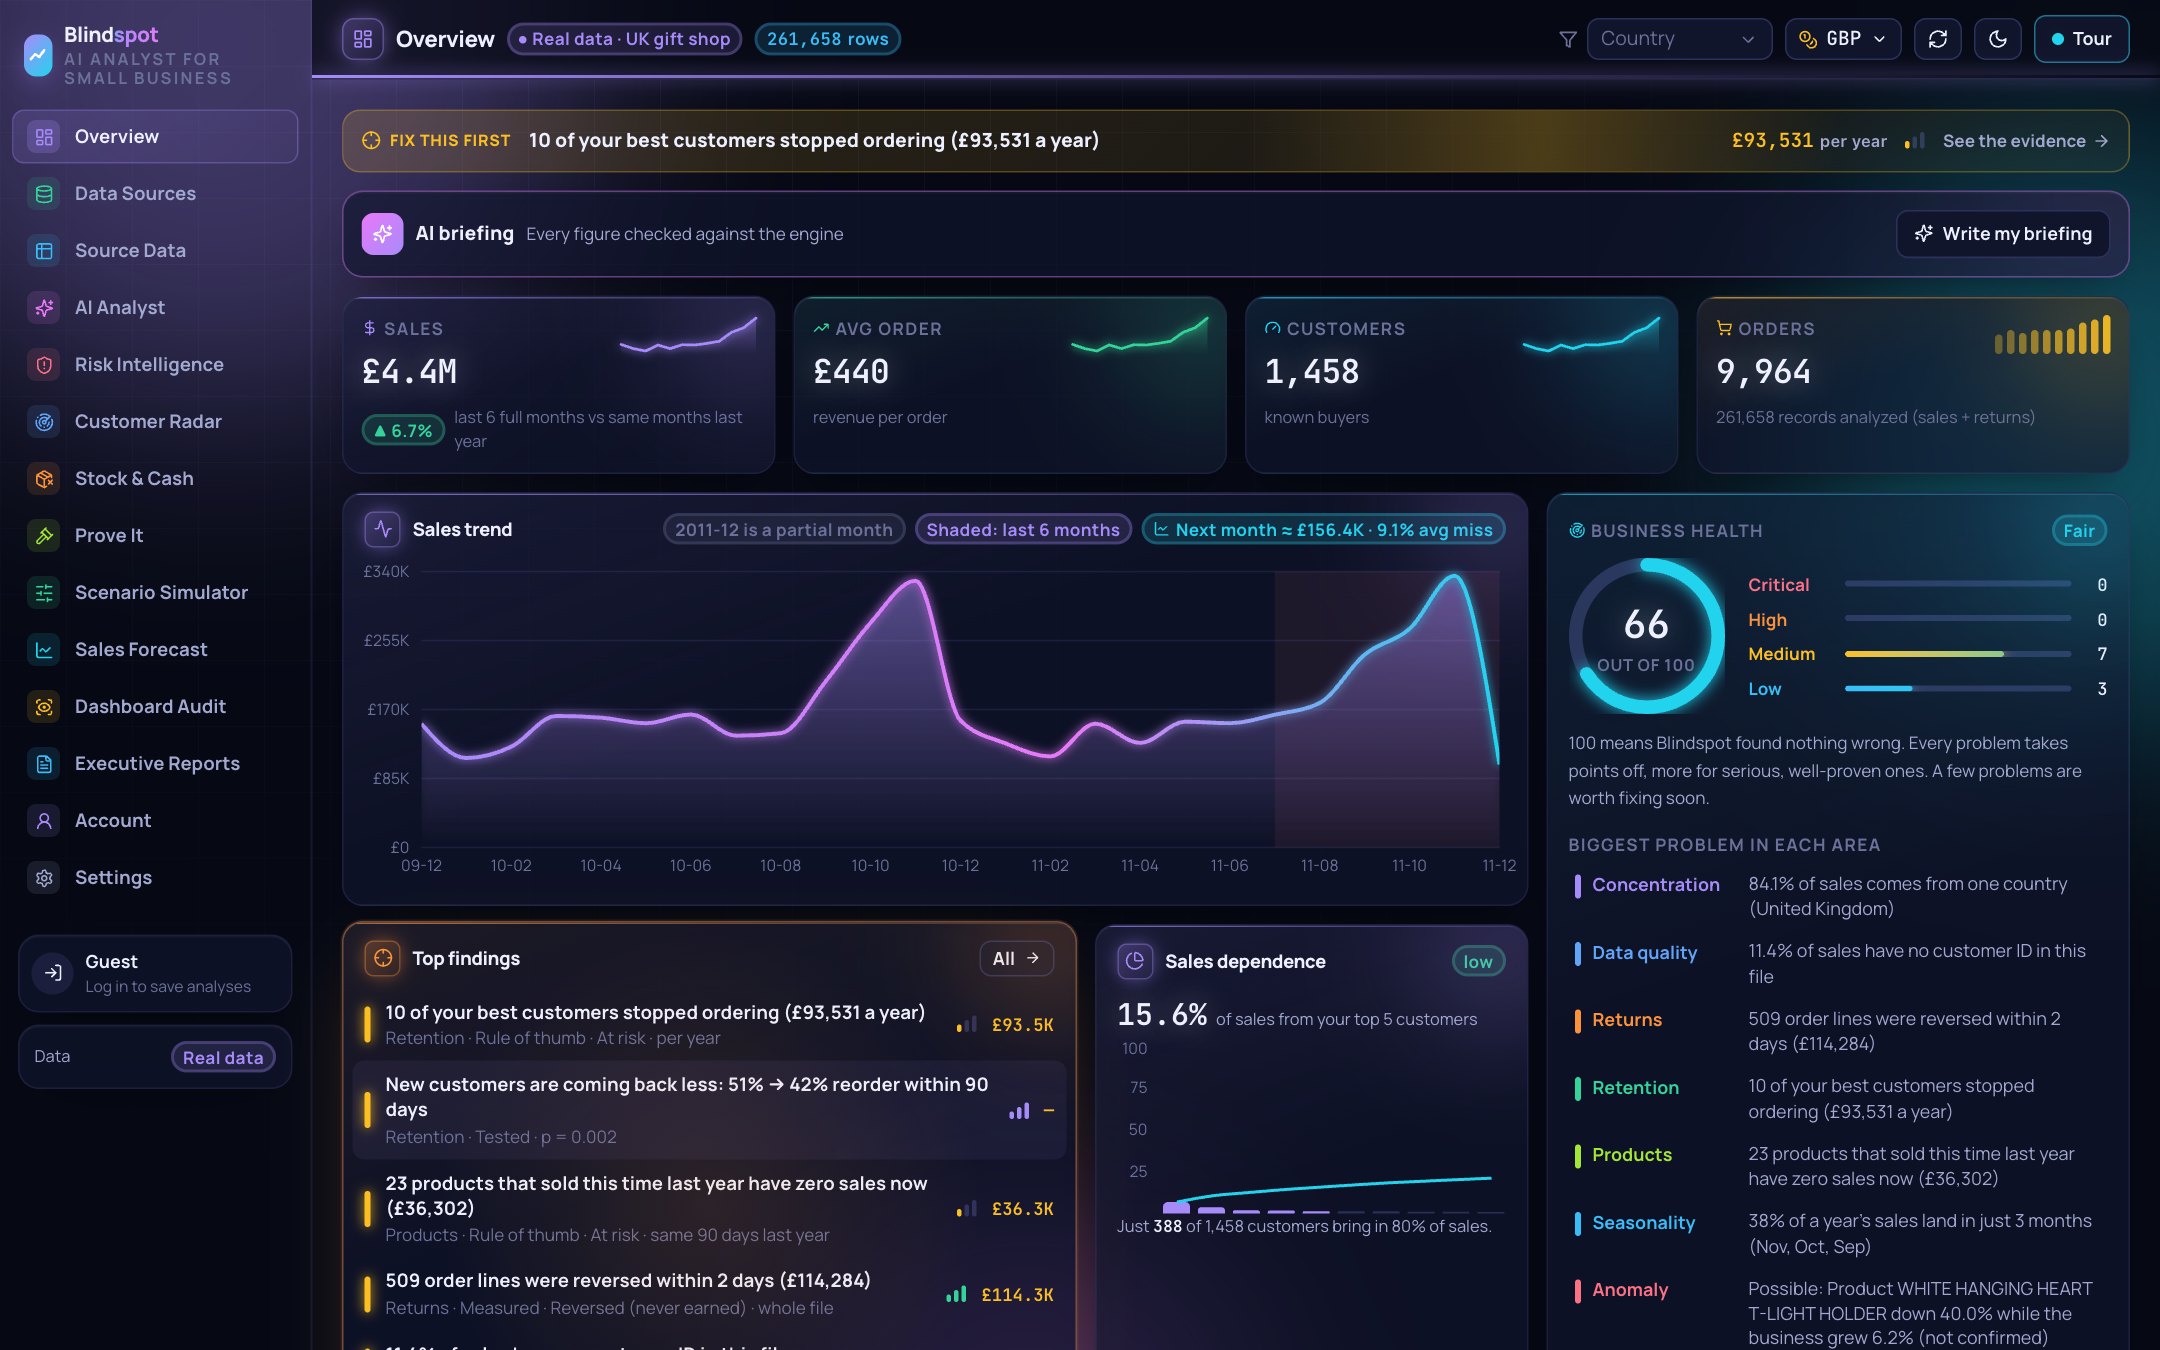
Overview: the one problem to fix first and the shop’s health at a glance
-
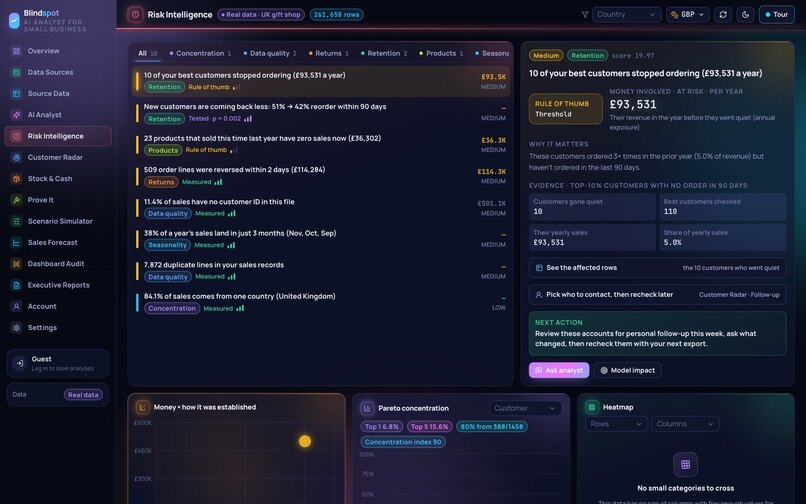
Risk Intelligence: every problem ranked by money, each linked to its evidence
-
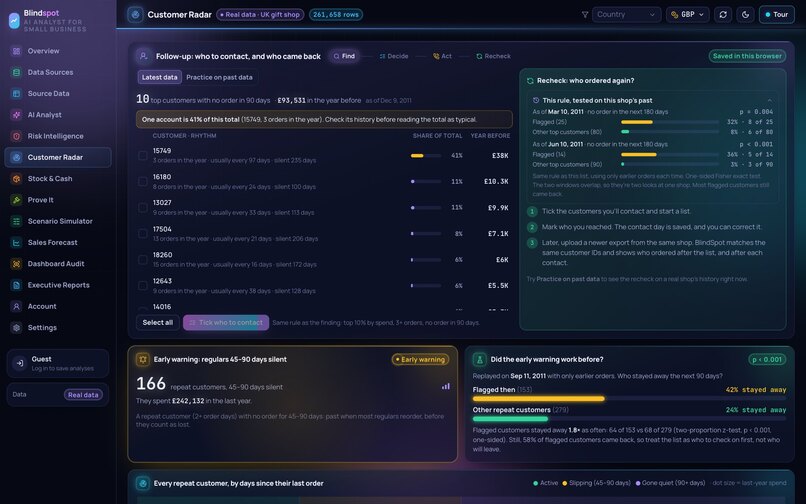
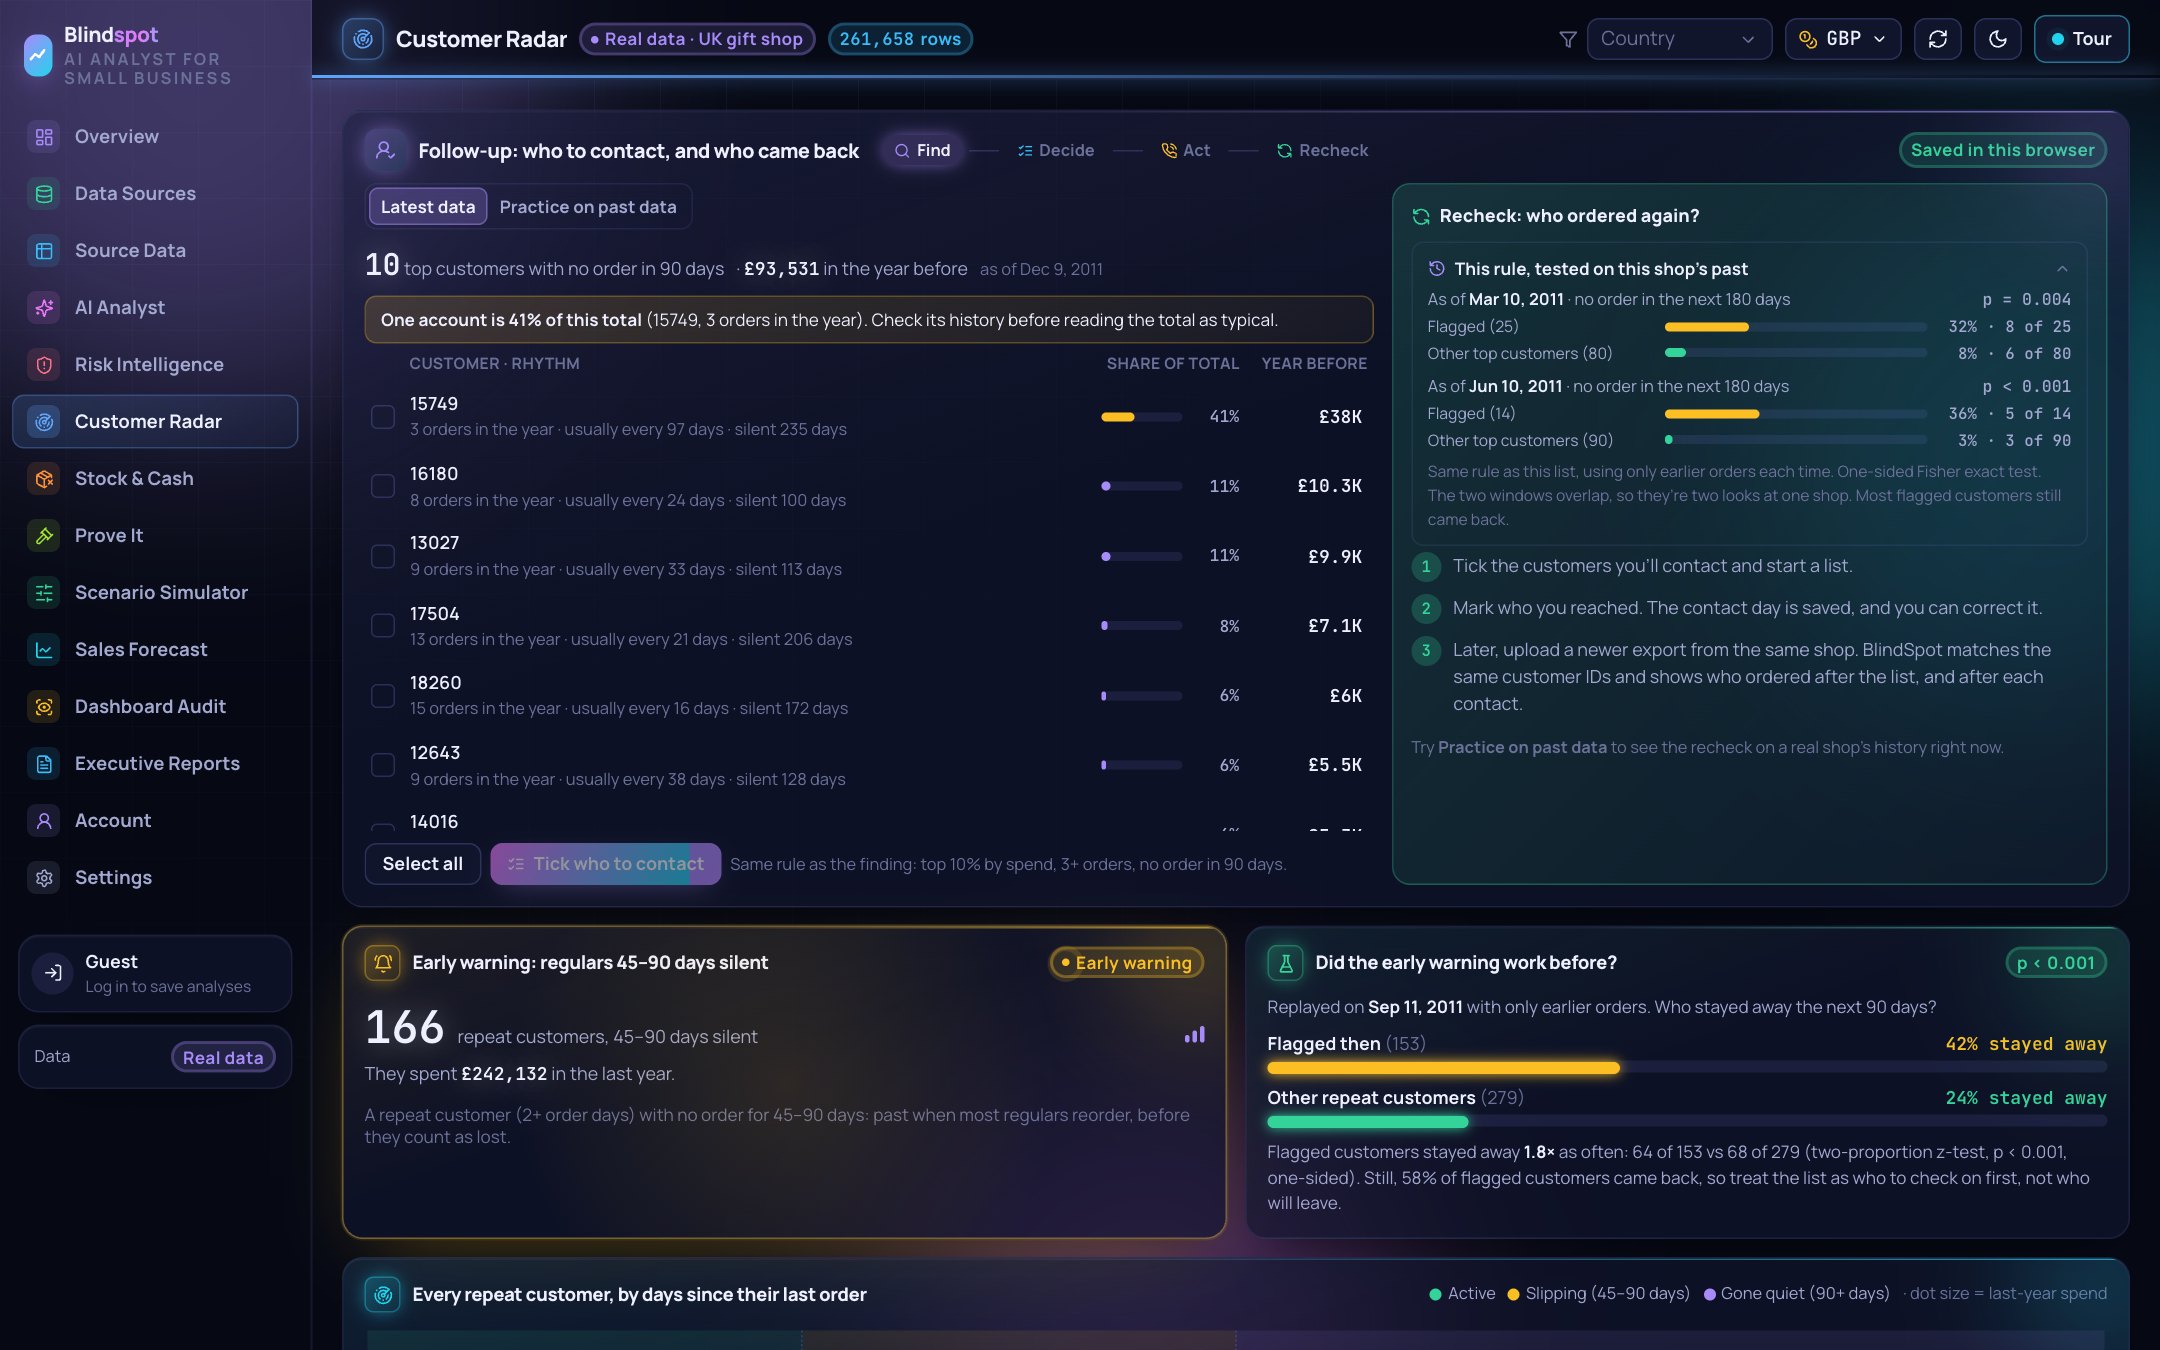
Customer Radar: regulars going quiet, ranked by what they spend
-
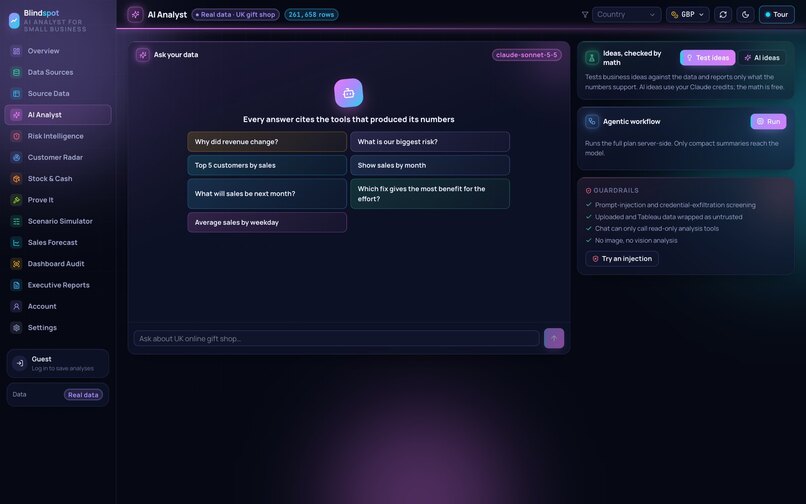
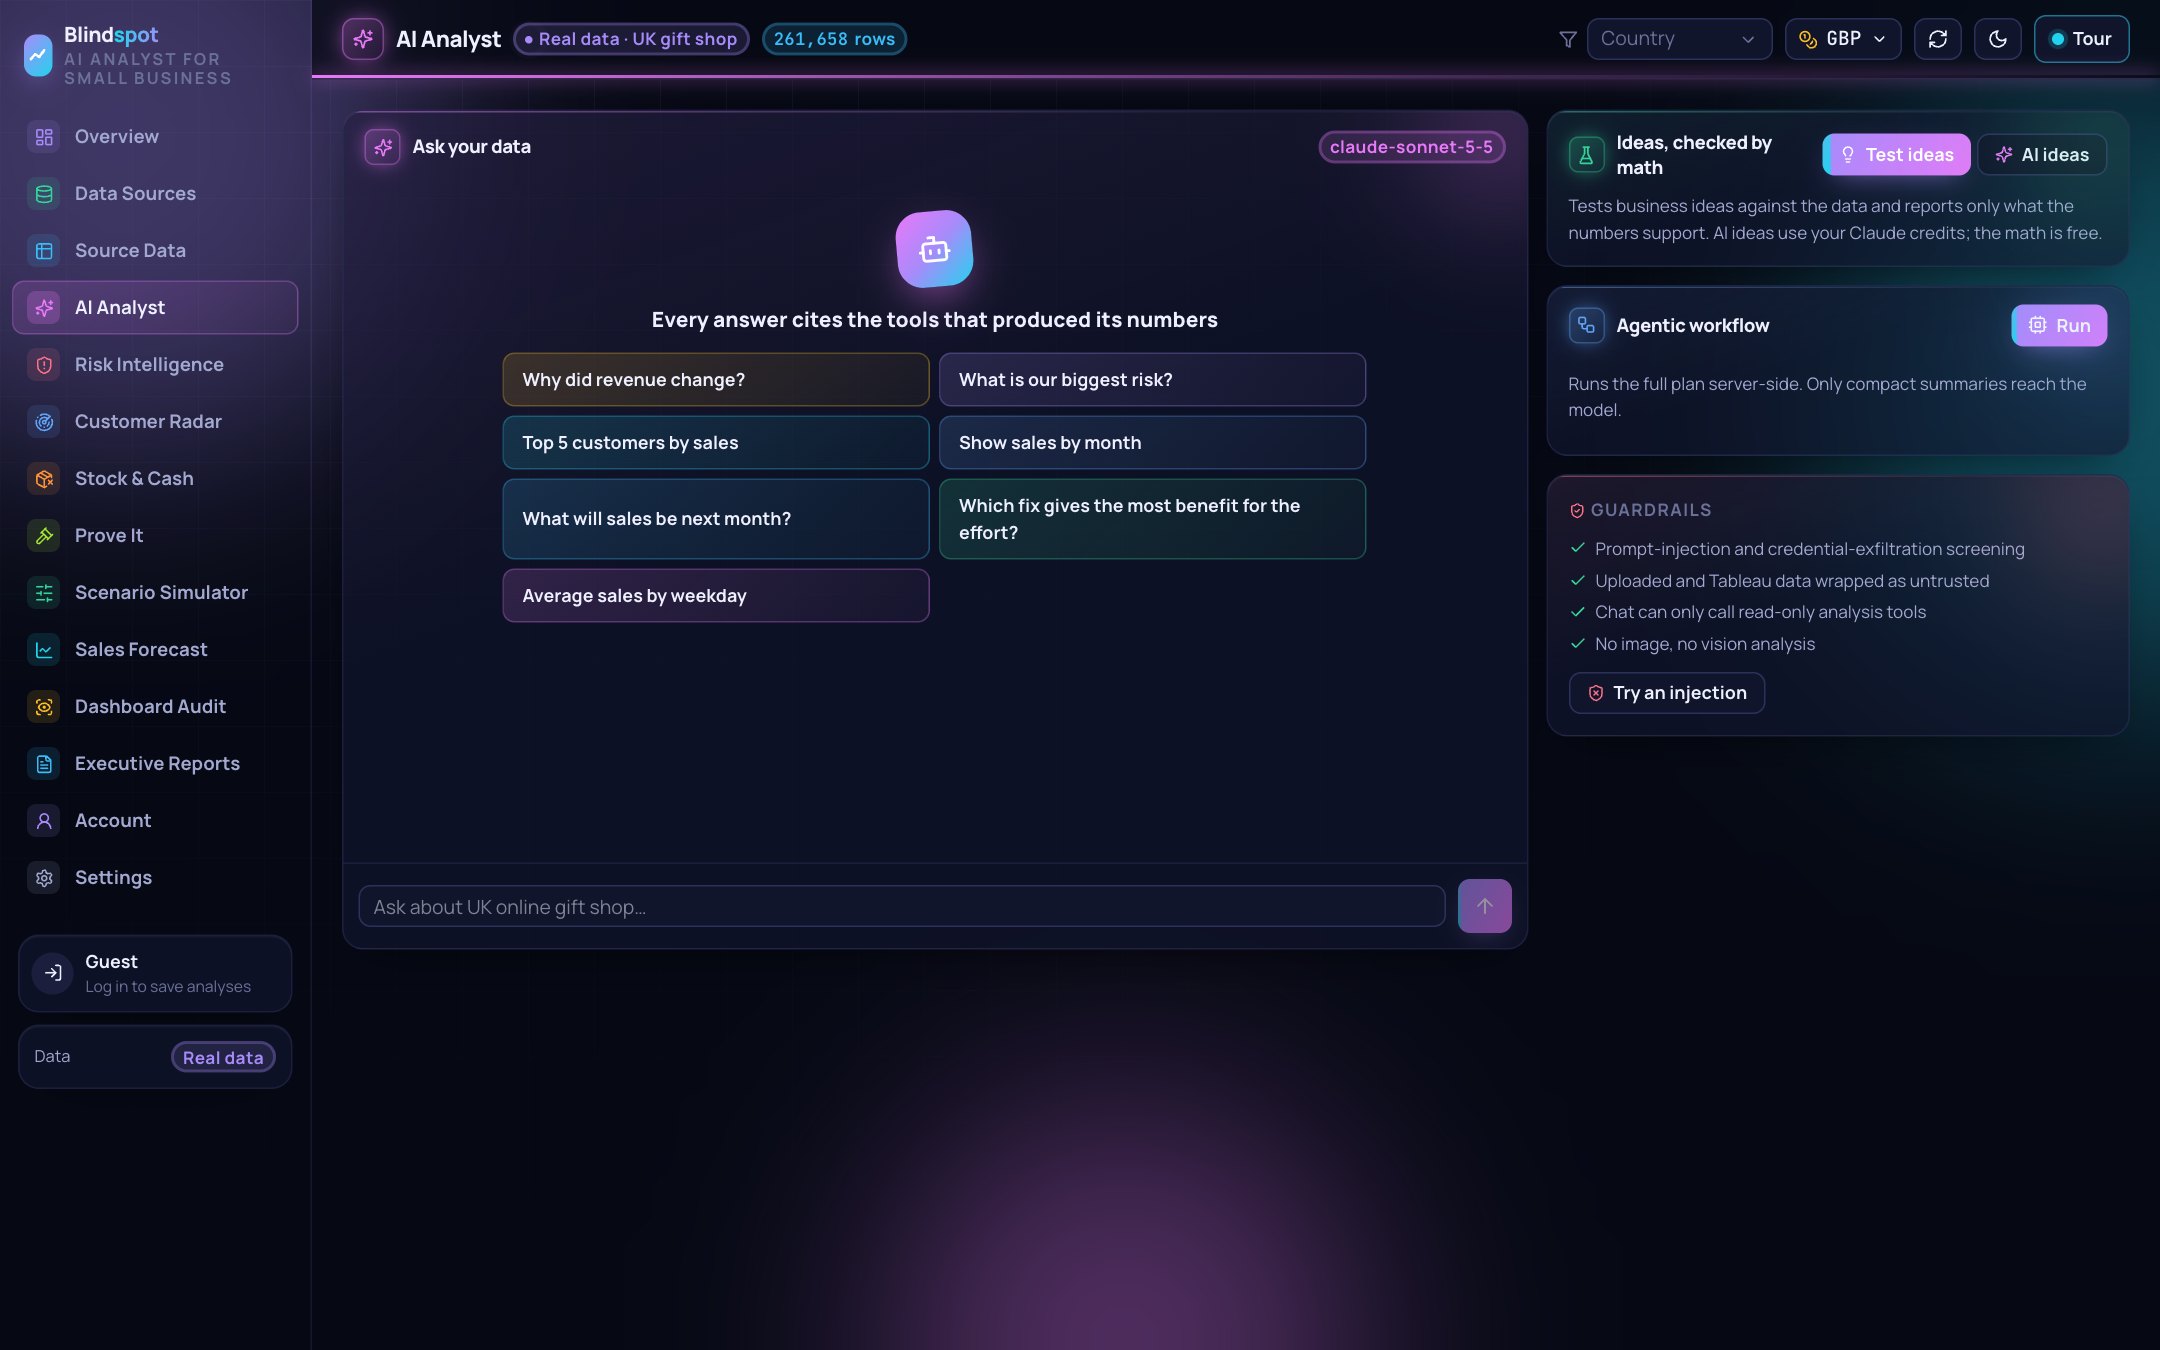
AI Analyst: plain-English answers where every figure is checked against the engine
-
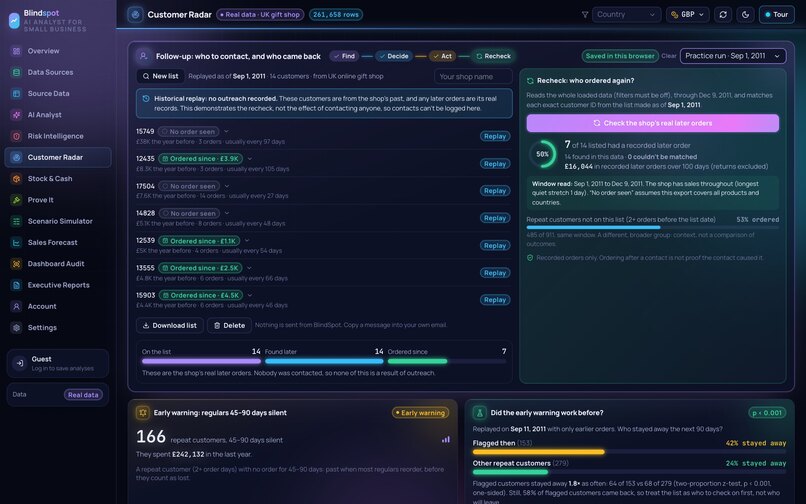
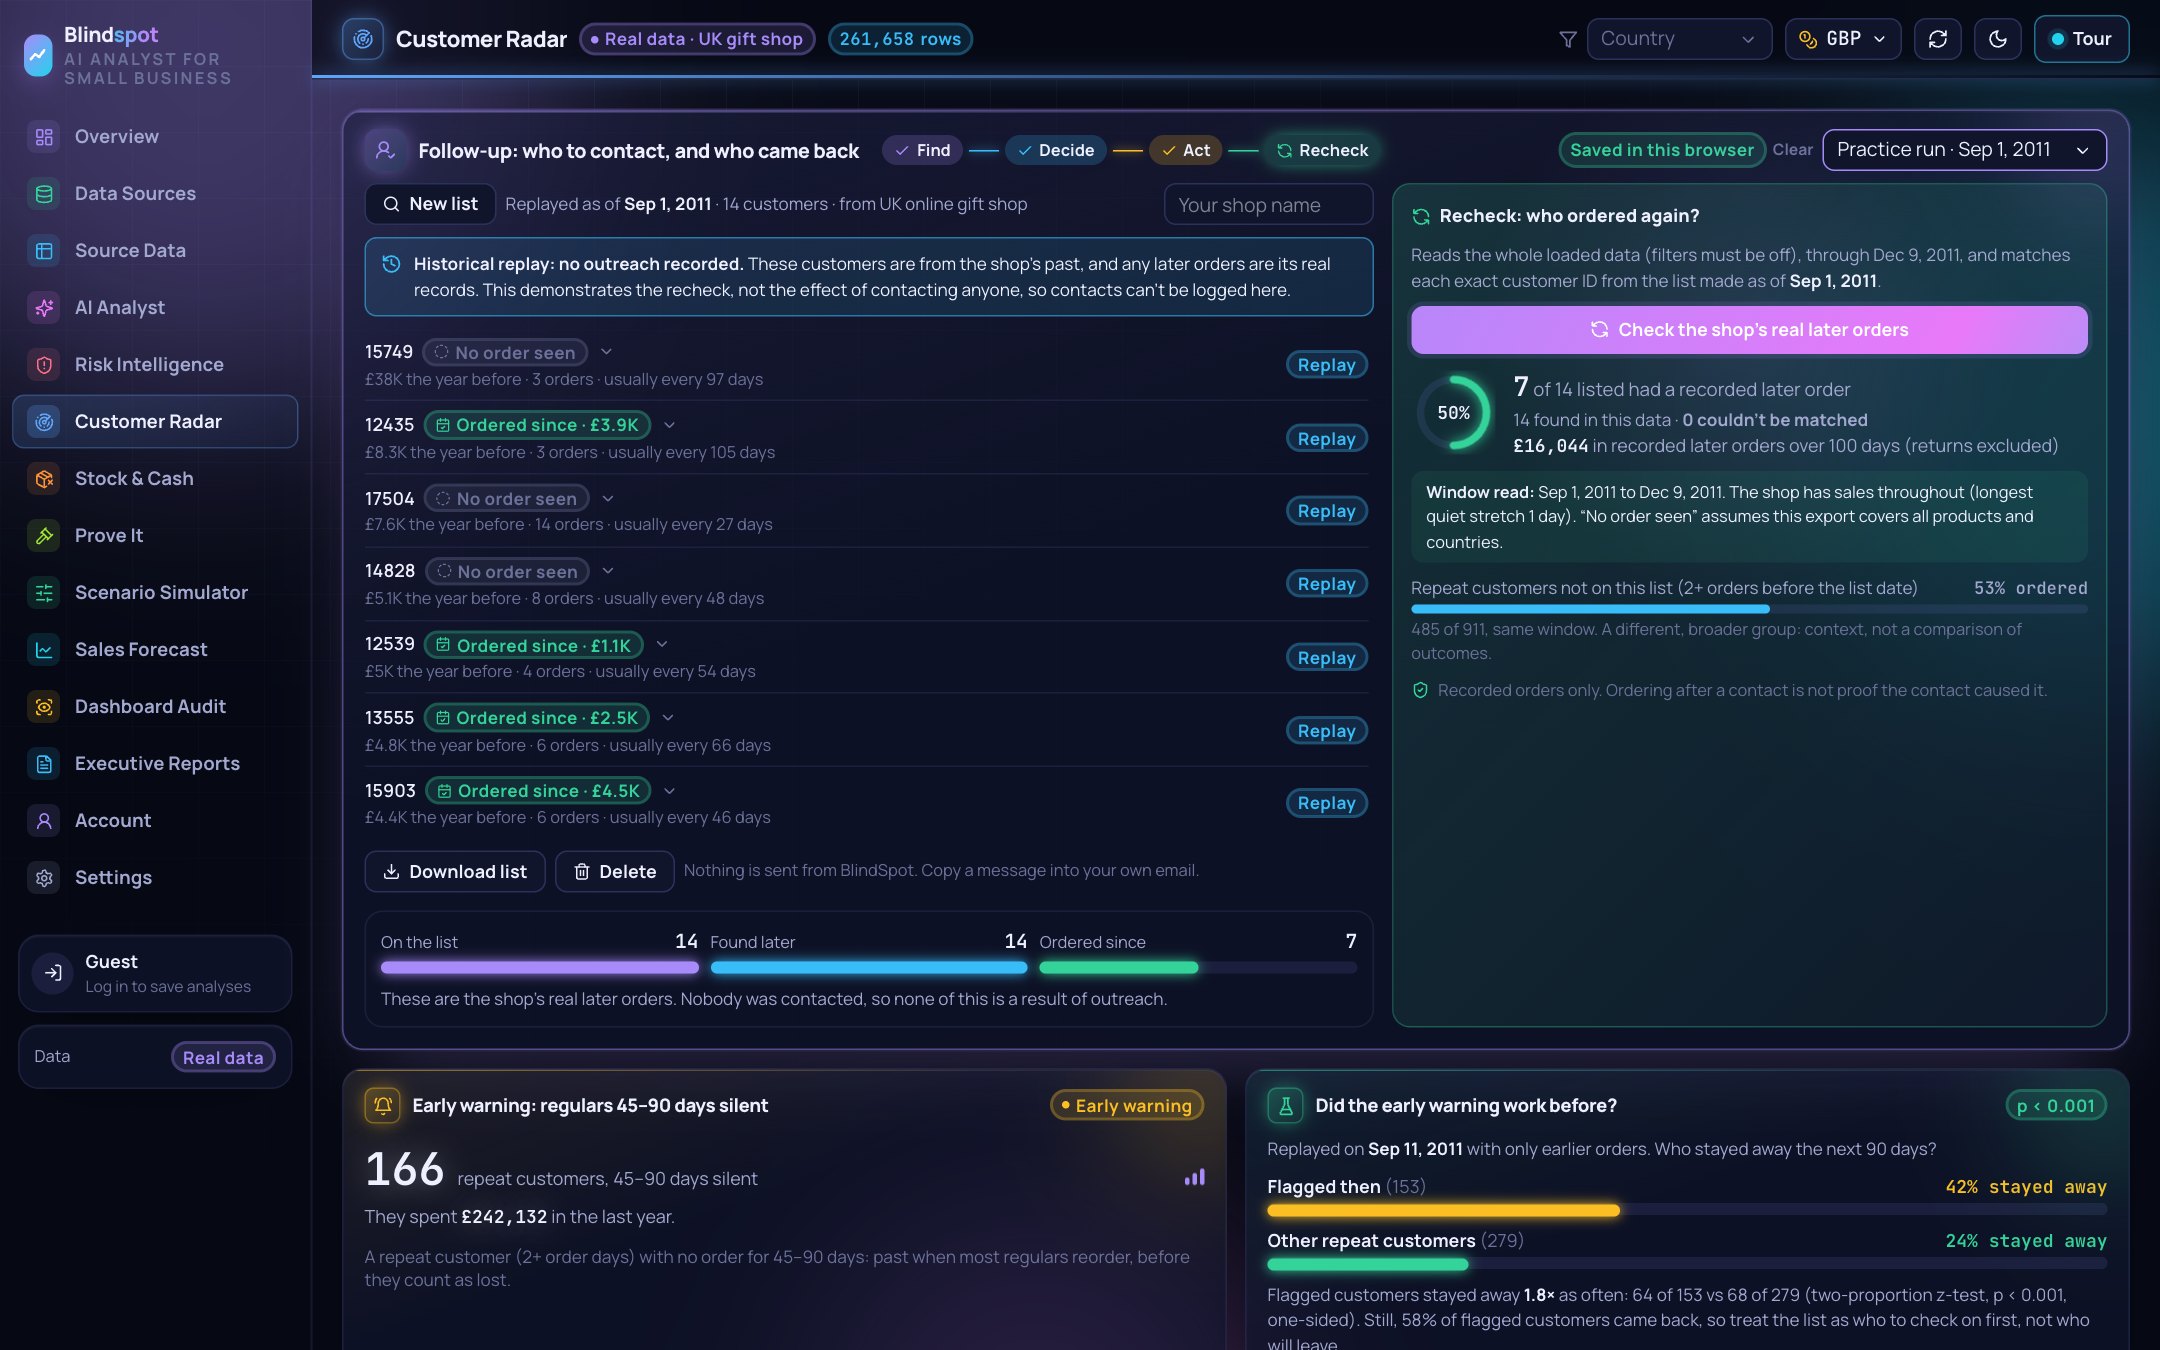
Recheck: upload a newer export and see which customers came back
-
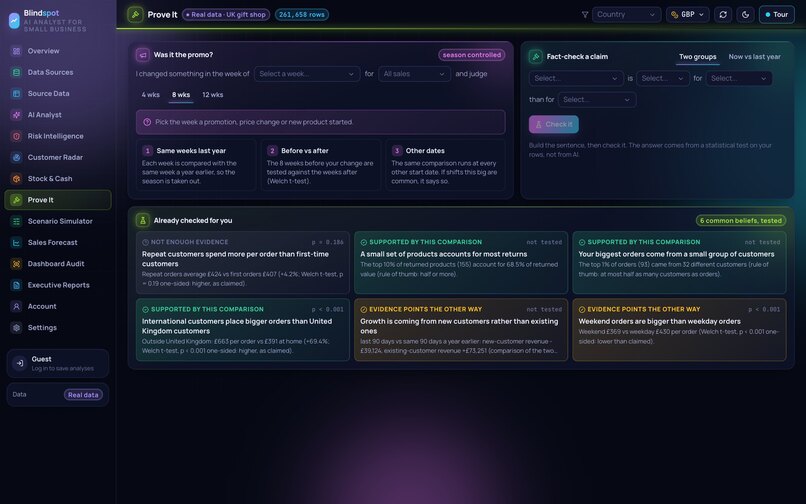
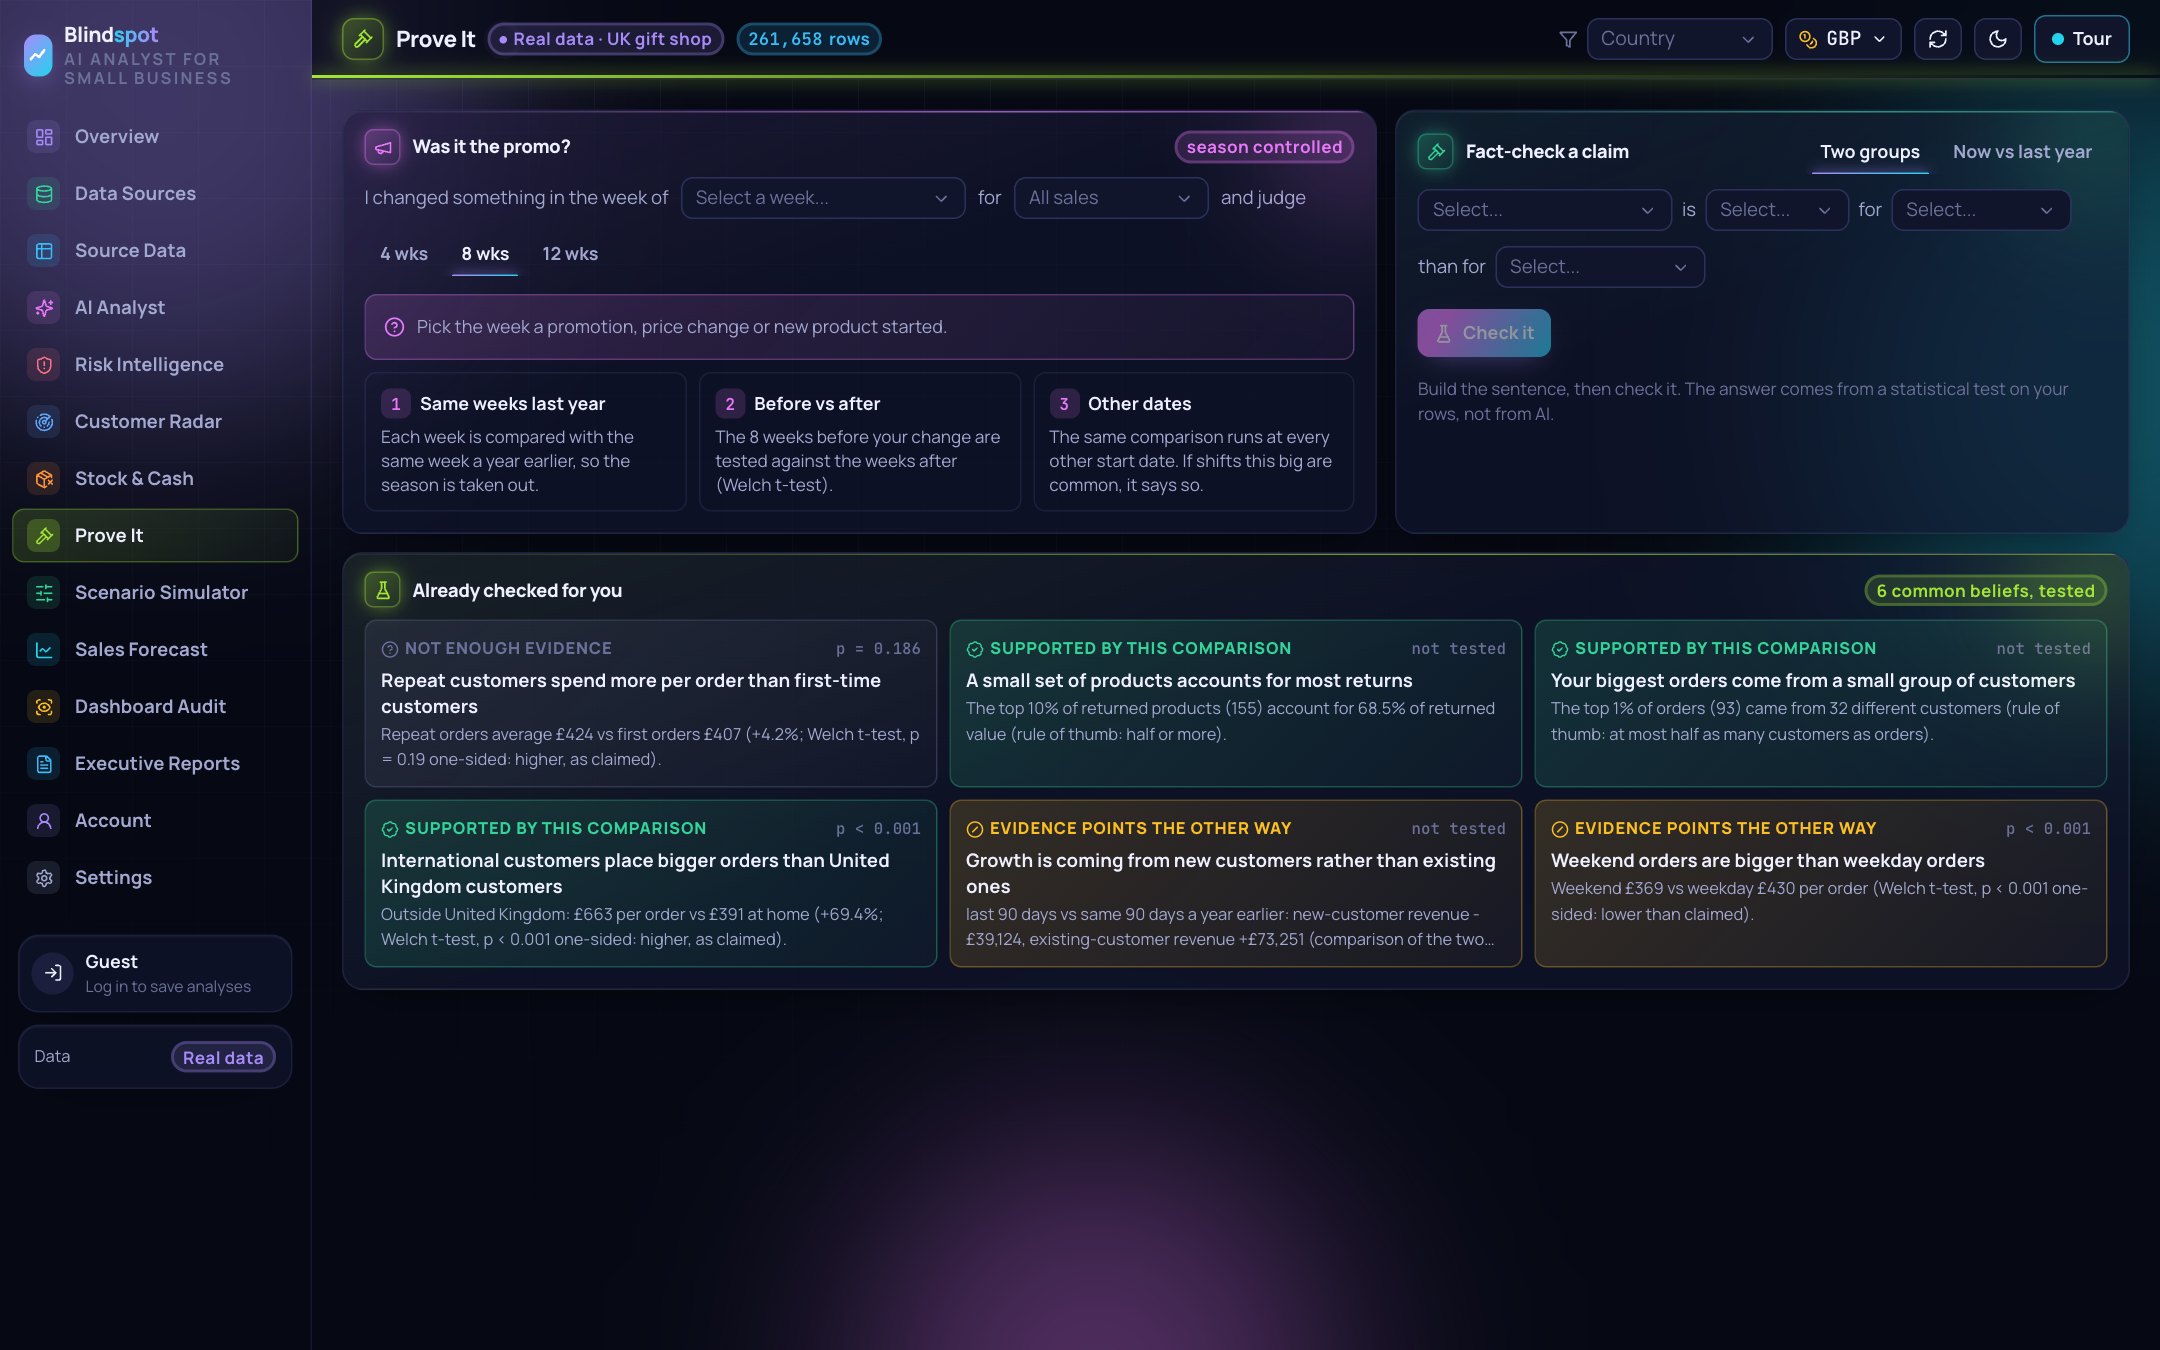
Did my change work?: test whether a promotion or price change really moved sales
-
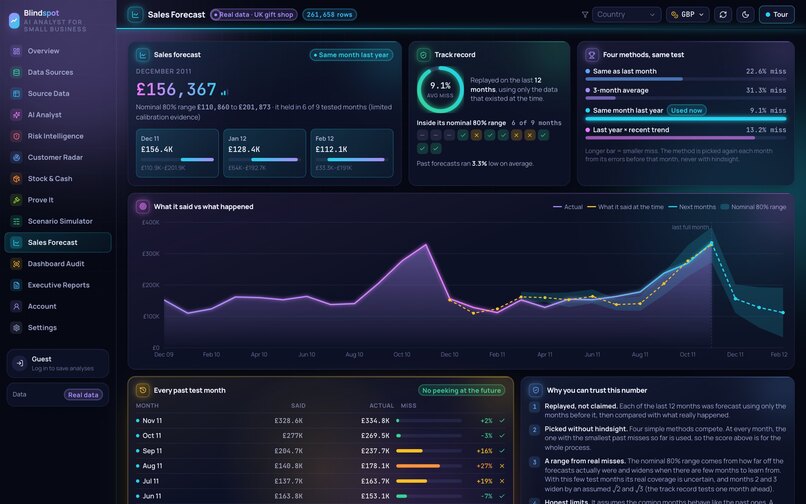
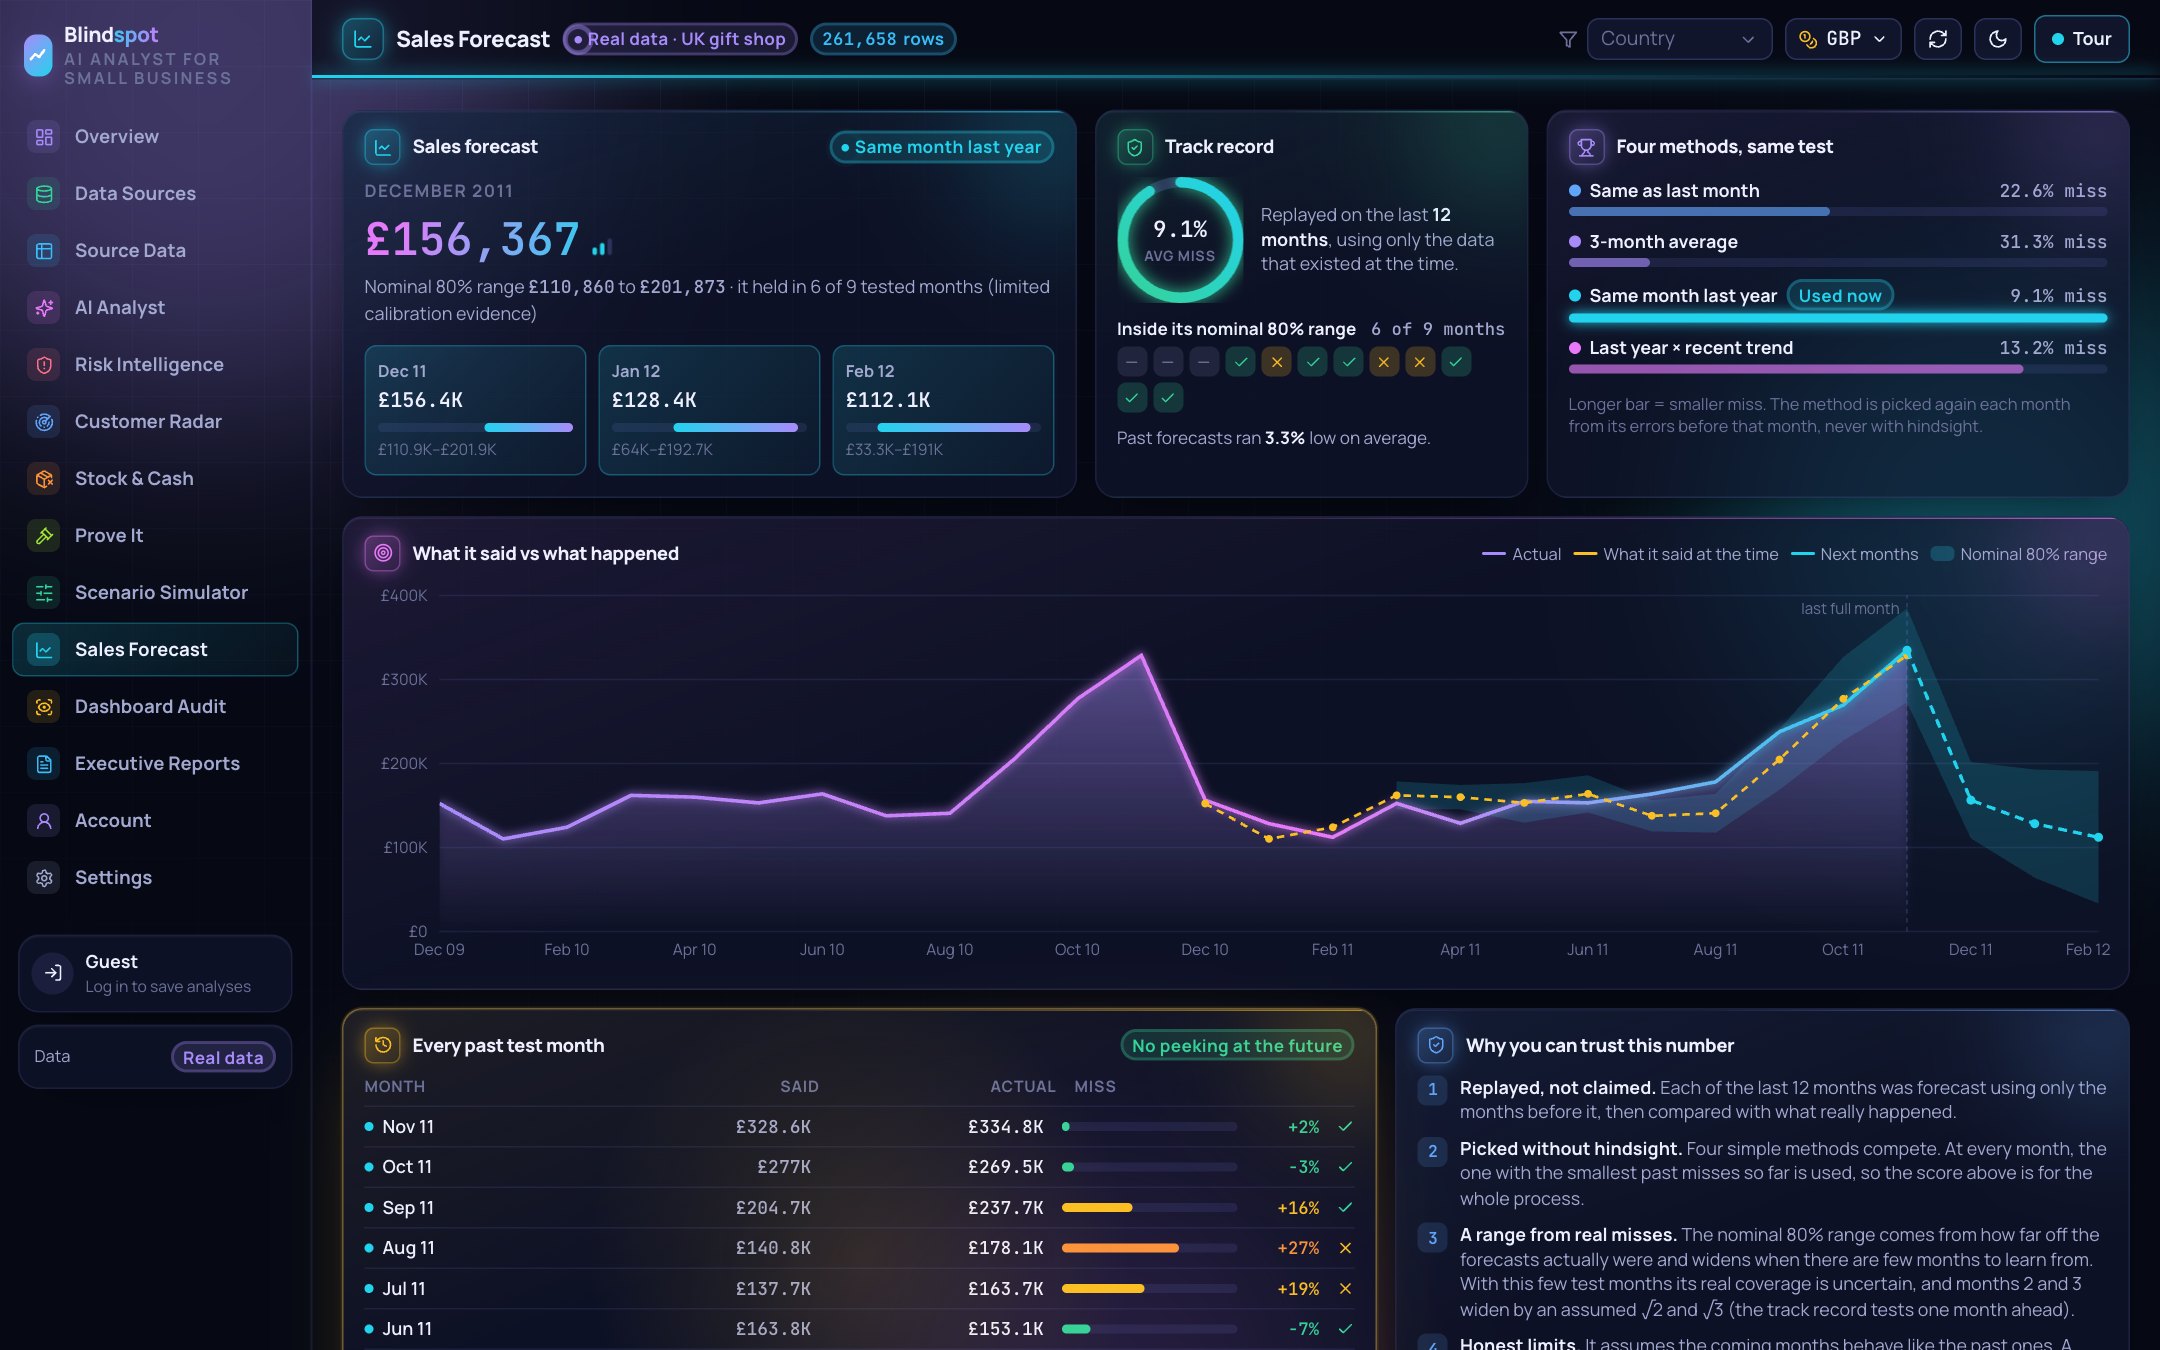
Sales Forecast: tested on past months first, with its real miss rate shown

Inspiration
Small online shops live on repeat customers. But when a regular leaves, nothing tells you.
They don't complain. They don't cancel. They just stop ordering, while new orders keep the total climbing and the dashboard keeps saying "All good."
The warning is already sitting in the shop's own sales export. The problem is that nobody reads it:
| The problem | The number | Source |
|---|---|---|
| Small businesses in the US | 36.2 million, employing 62.3M people (45.9% of private-sector workers) | SBA Office of Advocacy, Feb 2026 |
| Unprofitable when under 25% of revenue is repeat, vs over half | 29.0% vs 7.7% | Small Business Expo survey of 1,100+ owners, 2026 (an association, not proof of cause) |
| SMB leaders who don't know what their data could tell them | 53% | AWS survey of 800+ SMB leaders, 2023 (vendor survey) |
Big companies have analysts who catch these things. A shop owner running everything alone does not.
We saw it happen in real data. In one real UK gift shop's records, 10 of its best accounts went quiet. They had spent £93,531 the year before. The total still looked healthy, so nothing flagged it.
We built BlindSpot to give every small shop the analyst it can't afford.
What it does
BlindSpot reads a shop's sales data, finds the problems hiding in it, proves each one with statistics, and helps the owner act.
The four steps
| Step | What happens |
|---|---|
| 1. Connect | Link Shopify directly, or drop in any export: CSV, Excel, a PDF report, or a photo of a printout. |
| 2. Find | BlindSpot cleans the data, reads every row, and runs 40 checks across 10 areas in seconds. |
| 3. Prove | Every finding is tested with statistics, ranked by what it costs, and traced to the exact rows behind it. |
| 4. Fix | You get a plan ordered from easy to hard, AI-drafted notes for the customers you choose to contact, and a re-check showing who came back. |
What it catches: 10 areas
| Area | What it finds |
|---|---|
| Customers who stopped buying | Your best buyers going quiet, and new ones not returning |
| Products that stopped selling | Sold this time last year, nothing now |
| Customers you depend on too much | When a few buyers carry the business |
| Products that lose money | Hidden inside categories that look profitable |
| Returns and cancellations | Which products keep coming back, and what that costs |
| Sales or products falling behind | Main products and countries compared with the rest, and with last year |
| Sales stuck in one market | When almost every sale comes from one country |
| Relying on a few huge orders | When a handful of big orders carry the year |
| Seasonal sales dips | When most of the year's money lands in a few months |
| Messy records | Duplicates, missing customers, fees mixed into sales |
What it found in a real shop
Run on 261,658 real rows from a UK online gift shop:
| Finding | Money at stake |
|---|---|
| 10 best customers stopped ordering | £93,531 a year |
| New customers reorder less | 51% → 42% |
| 23 products stopped selling | £36,302 |
| 509 orders reversed within 2 days | £114,284 |
The app
| Page | What it's for |
|---|---|
| Overview | A greeting, the one problem to fix first, and the shop's health at a glance |
| Risk Intelligence | Every problem in one place. Click a finding and the exact rows behind it are highlighted |
| Customer Radar | Regulars going quiet, ranked by what they spend, each with their usual buying rhythm |
| AI Analyst | Ask questions in plain English. Every figure in the answer is checked against the engine |
| Did my change work? | Pick the week you ran a promotion or changed a price, and see whether sales really moved. If there isn't enough data, it says so instead of guessing |
| Scenario Simulator | Model a change before you make it |
| Sales Forecast | Tested against past months before you see it, with its real miss rate shown |
| Stock & Cash | Products tying up money, and gaps in what's selling |
| Dashboard Audit | What your current dashboard is hiding |
| Executive Reports | A clean summary to share with a partner, an accountant or a bank |
| Source Data | Every row, searchable, so you can check anything yourself |
Find → Decide → Act → Recheck
A finding only matters if the owner acts on it, so BlindSpot runs the whole loop:
- Find: the valuable customers who have gone quiet, each with their usual rhythm
- Decide: see the exact rows behind each one, then tick who to contact
- Act: AI drafts a short note for each customer, checked before you see it. You send it and log the day
- Recheck: upload a newer export and see who ordered after the list, and after each contact
The website
The landing page is a scroll-driven 3D story. A glass dashboard draws itself and says everything's fine. You dive into its screen and fall through 38,000 glowing points, one for each row in a sample, and watch the customers going quiet drift away in amber. Then you fly down a tunnel past the checks, and the points gather into the hidden number: £93.5K. The finding card shatters, and you're at "See your blind spot."
The real content lives inside the journey: the problem with its sources, how it works, the follow-up loop, every feature, and the proof. While you're reading a section, the 3D slows down and dims.
How we built it







How a sales file becomes a finding
- Data comes in. From Shopify's API, or from an uploaded file. BlindSpot detects the format automatically. PDFs and photos are read by AI into a table you can check.
- The data is cleaned. Returns, cancellations, duplicates, missing customer IDs and fees are sorted out, so nothing gets counted twice.
- The engine runs the checks. 41 analysis tools do the math in code: customer groups by start month, who carries the business, seasons, unusual drops, forecasts and statistical tests.
- Findings are tested and ranked. Anything that doesn't pass a statistical test is labeled "not confirmed". Everything else is ranked by money.
- The AI explains. Claude turns the results into plain English and drafts customer notes. It never does the math.
- The fact-checker verifies. Every number in the AI's text is matched against the engine. Any wrong figure goes back to the AI to fix before you see it.
The stack
| Part | Built with |
|---|---|
| Website and app | React, TypeScript, Vite, Tailwind CSS, Framer Motion |
| 3D landing story | three.js, with our own shaders for the particles, glow and lens effects, all driven by scroll |
| Analysis engine | Our own TypeScript statistics package, 41 analysis tools |
| AI | Claude Sonnet 5.5, for explanations and customer notes |
| Server | Node.js and Express |
| Accounts | Supabase (sign-up, log-in, password reset) |
| Store connection | Shopify Admin API |
| Hosting | Render, deploying automatically from GitHub |
| Testing | 291 automated tests (Vitest) plus browser tests (Playwright) |
The rules the engine follows
| Rule | Why |
|---|---|
| Compare with the same period last year | So a holiday rush never looks like growth |
| Only real changes count | A drop counts only if it passes a statistical test, adjusted for checking many products at once |
| Every number is calculated | Totals, percentages and money come from code. The AI explains; the code checks |
| Estimates say so | Anything that's an estimate is labeled, with the formula and your numbers shown |
Proof: checked, not claimed




| What we tested | Result |
|---|---|
| The headline finding, recalculated by separate code | £93,531.25, matched to the penny |
| Figures in a live AI briefing that matched the engine | 12 of 12 |
| Did flagged customers really stay away? (180 days, two replay dates) | 32–36% vs 3–8% for other top regulars (p < 0.005) |
| False alarms in simulated product histories | 1 in 1,530 |
| Follow-up loop replay: 14 quiet top customers flagged as of Sep 1, 2011 | 7 ordered again within 100 days (£16,044) |
| Speed | ~6 seconds for 1 million rows |
| Automated tests | 291 passing |
The data is the public UCI Online Retail II dataset: a real UK online gift shop, analyzed on a 25% customer sample. The replay is historical. No customers were actually contacted, so it shows how the recheck works, not the effect of an email.
Challenges we ran into
Code issues we hit (and fixed)
| Issue | What went wrong | The fix |
|---|---|---|
| "This page hit a problem" after every deploy | Pages load in separate code chunks. After a redeploy, the old chunk files were gone, so open tabs crashed when you clicked a button, and React remembered the failure until you refreshed | A loader that reloads the page once (with a 15-second guard so it can't loop), plus no-cache on the HTML and long-term caching for the versioned files. We proved the fix by blocking a chunk on purpose in a browser test |
| "AI not connected" on the live site | The API key had been saved under the wrong environment variable name, so the server started without AI | Fixed the variable and added the AI model to the health check, so the live site always reports whether AI is on |
| A card was cut off by 96 pixels | A glow effect stuck out past the card's edge. overflow: hidden still lets the browser scroll the box, and it did |
Switched to overflow: clip, which can't scroll, on every card with a glow |
| The heatmap dropdowns did nothing | Most shops have few category columns, so there was almost nothing to pick | The server now builds Month and Weekday from the order dates, in calendar order, so every shop gets a useful heatmap |
| The Pareto chart was empty | The concentration tool returned one summary number, not the curve the chart needed | The tool now outputs the full curve (top x% of customers → y% of sales), and the chart draws it with the 80% line marked |
| Particles drew as squares | A shader used smoothstep with its edges reversed, which GPUs don't have to support |
Rewrote it as 1 - smoothstep(0, .5, d) for a soft, round dot |
| The 3D scene turned grey and washed out | Film grain was added before the colour conversion, so a tiny amount of noise became a grey haze | Made the grain multiply the image instead of adding to it, and raised the glow threshold so only the brightest light blooms |
| The big number showed as a white pillar | The camera's tunnel roll never unwound, so £93.5K was rotated 99° | The roll now eases back to level before the reveal |
| It didn't fit on phones | The 3D dashboard and the number were wider than a phone screen | Both now scale to the screen width |
Other challenges
| Challenge | How we solved it |
|---|---|
| AI can make up numbers, and this is money | The AI never does the math. The engine computes every figure, and a fact-checker verifies the AI's text before you see it |
| False alarms kill trust | We tuned the checks against simulated histories down to 1 false alarm in 1,530, and compared with the same weeks last year to remove seasonal noise |
| Real data is messy | Returns as negative rows, cancellations, missing customer IDs, duplicates and fees mixed into sales. A cleaning step handles them all before any check runs |
| Being honest when data is thin | Features now say plainly when they can't run and what's needed (for example "needs at least 12 weeks of dated sales") instead of guessing |
| A beautiful site that said nothing | Our first 3D landing page looked amazing but didn't explain the product. We rebuilt it so the real content sits inside each part of the journey |
| Testing 3D in a background tab | Browsers slow animation in hidden tabs, so screenshots were unreliable. We checked every frame in headless Chrome instead, at desktop and phone sizes |
Accomplishments that we're proud of
- It found real money in a real shop: £93,531 a year in lost top customers, verified to the penny
- Its warnings mean something: flagged customers stayed away about 4–10x more often than other top regulars, with a statistically significant result
- The AI is fact-checked: 12 of 12 figures confirmed in a live briefing
- Every number can be traced: click any finding and see the exact rows behind it
- It closes the loop: BlindSpot doesn't stop at a report. It goes from a finding to a contact list to a drafted note to a recheck of who came back
- A landing page that stops people scrolling, then tells them exactly what the product does
What we learned
- Show the rows. Owners trust a finding when they can see the actual orders, not just a big number.
- Let the AI write and the engine compute. That split made the AI far more useful, because every claim can be checked.
- Saying "not enough data" builds trust. Being honest when a test can't run is better than a confident wrong answer.
- Insight without action is just a report. The follow-up loop is what turns BlindSpot into a tool owners will come back to.
- Ship, then check the live site. Several of our worst bugs only appeared after deploying, so we now verify every release in a real browser.
- Design is part of the product. People decide whether a tool is serious within seconds.
What's next for BlindSpot
| Next | Why |
|---|---|
| More live connectors (WooCommerce, Square, Etsy) | Today: live Shopify, plus file upload for everything else |
| Weekly automatic re-checks | Alert the owner the week a top customer goes quiet |
| Send notes from inside the app | And track replies, so the loop closes on its own |
| Measure real win-backs | Pilots with real merchants, to measure how much revenue the loop brings back |
| Benchmarks | Compare a shop with similar shops |
Try it
Live: https://blindspot-pro.onrender.com Open the guest demo on a real shop's data. No sign-up needed.
Built With
- anthropic
- chatgpt
- claude
- claude-code
- css3
- express.js
- framer-motion
- github
- glsl
- graphql
- html5
- node.js
- playwright
- postgresql
- react
- render
- shopify
- statistics
- supabase
- tailwindcss
- three.js
- typescript
- vite
- vitest
- webgl

