-
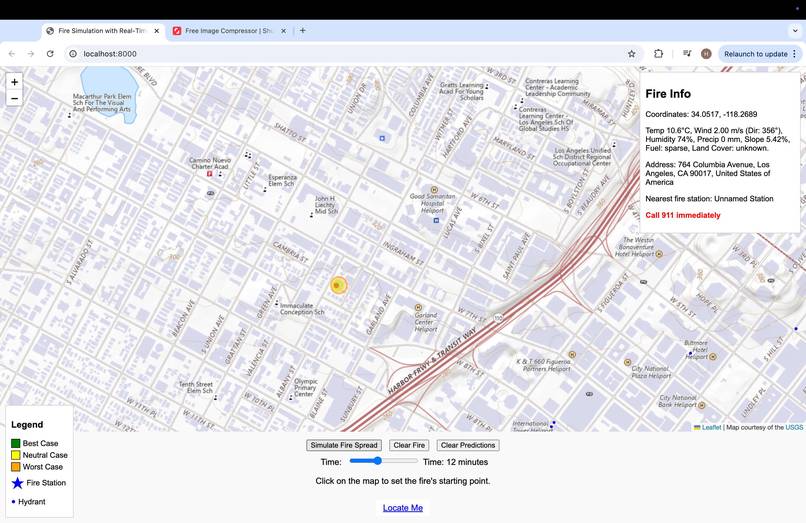
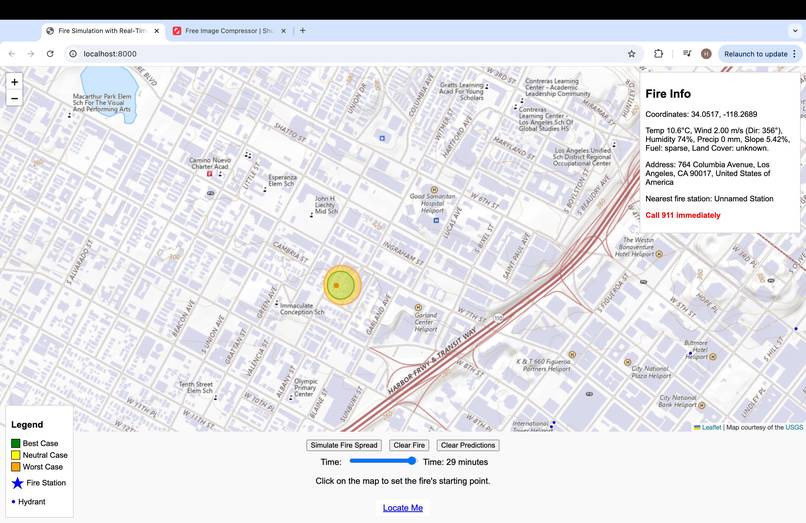
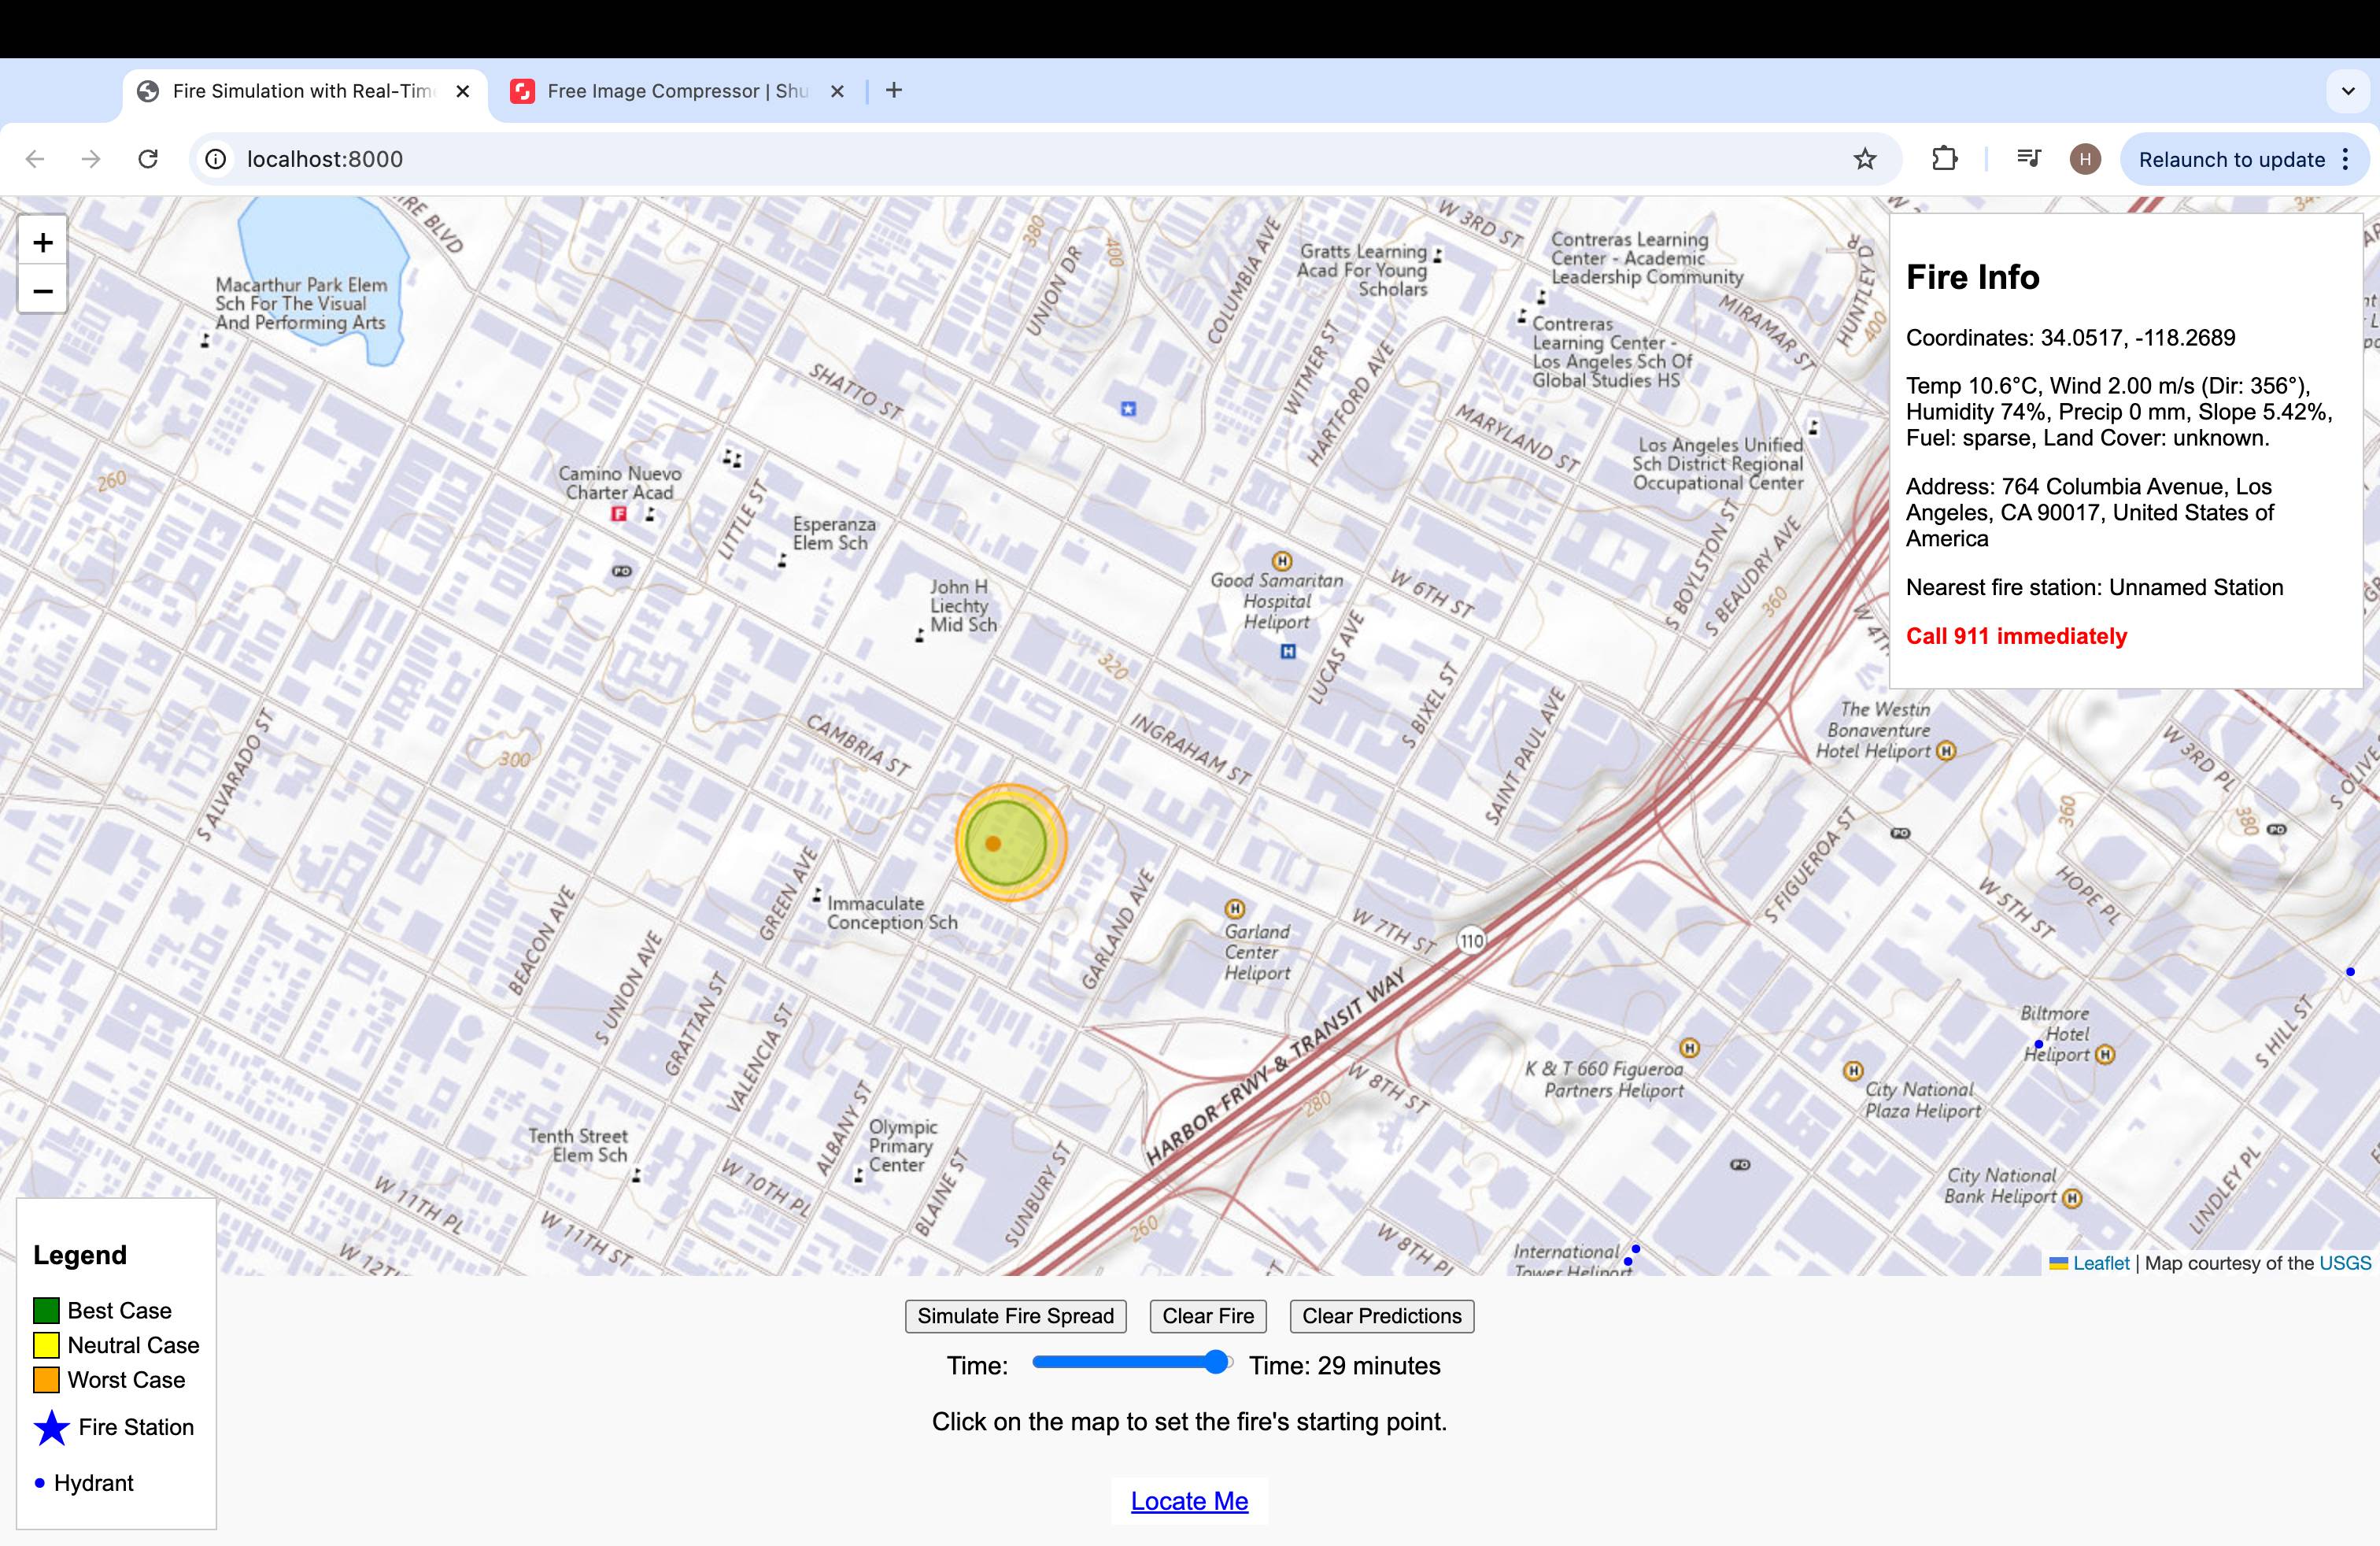
The user can toggle the slider to see the fire's spread projection at different times
-
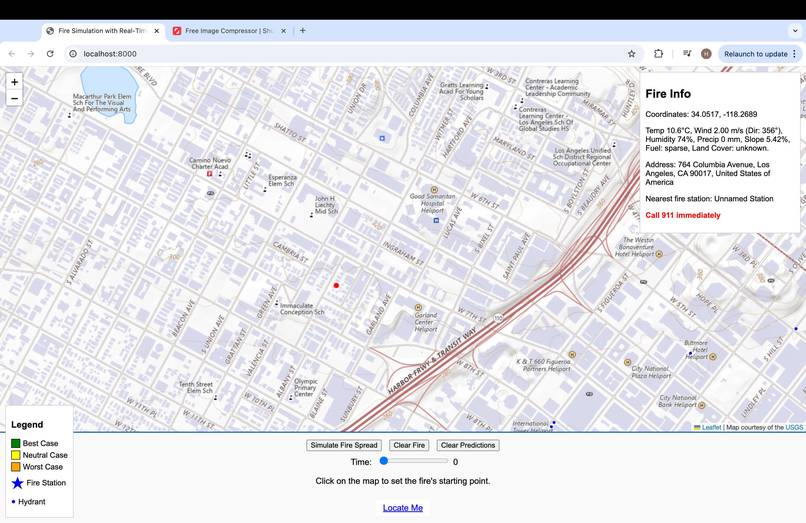
User can simulate a fire by clicking on the map with their mouse
-
User can view the reasoning (weather & terrain data) and nearest firefighting resources
-
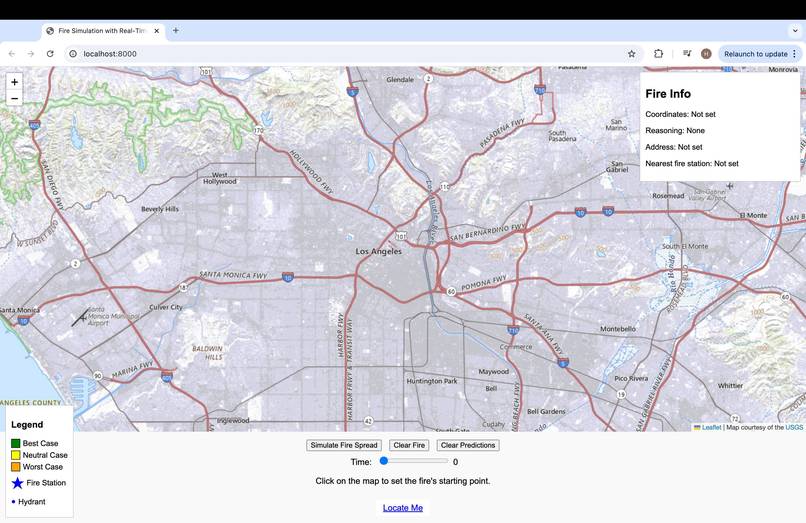
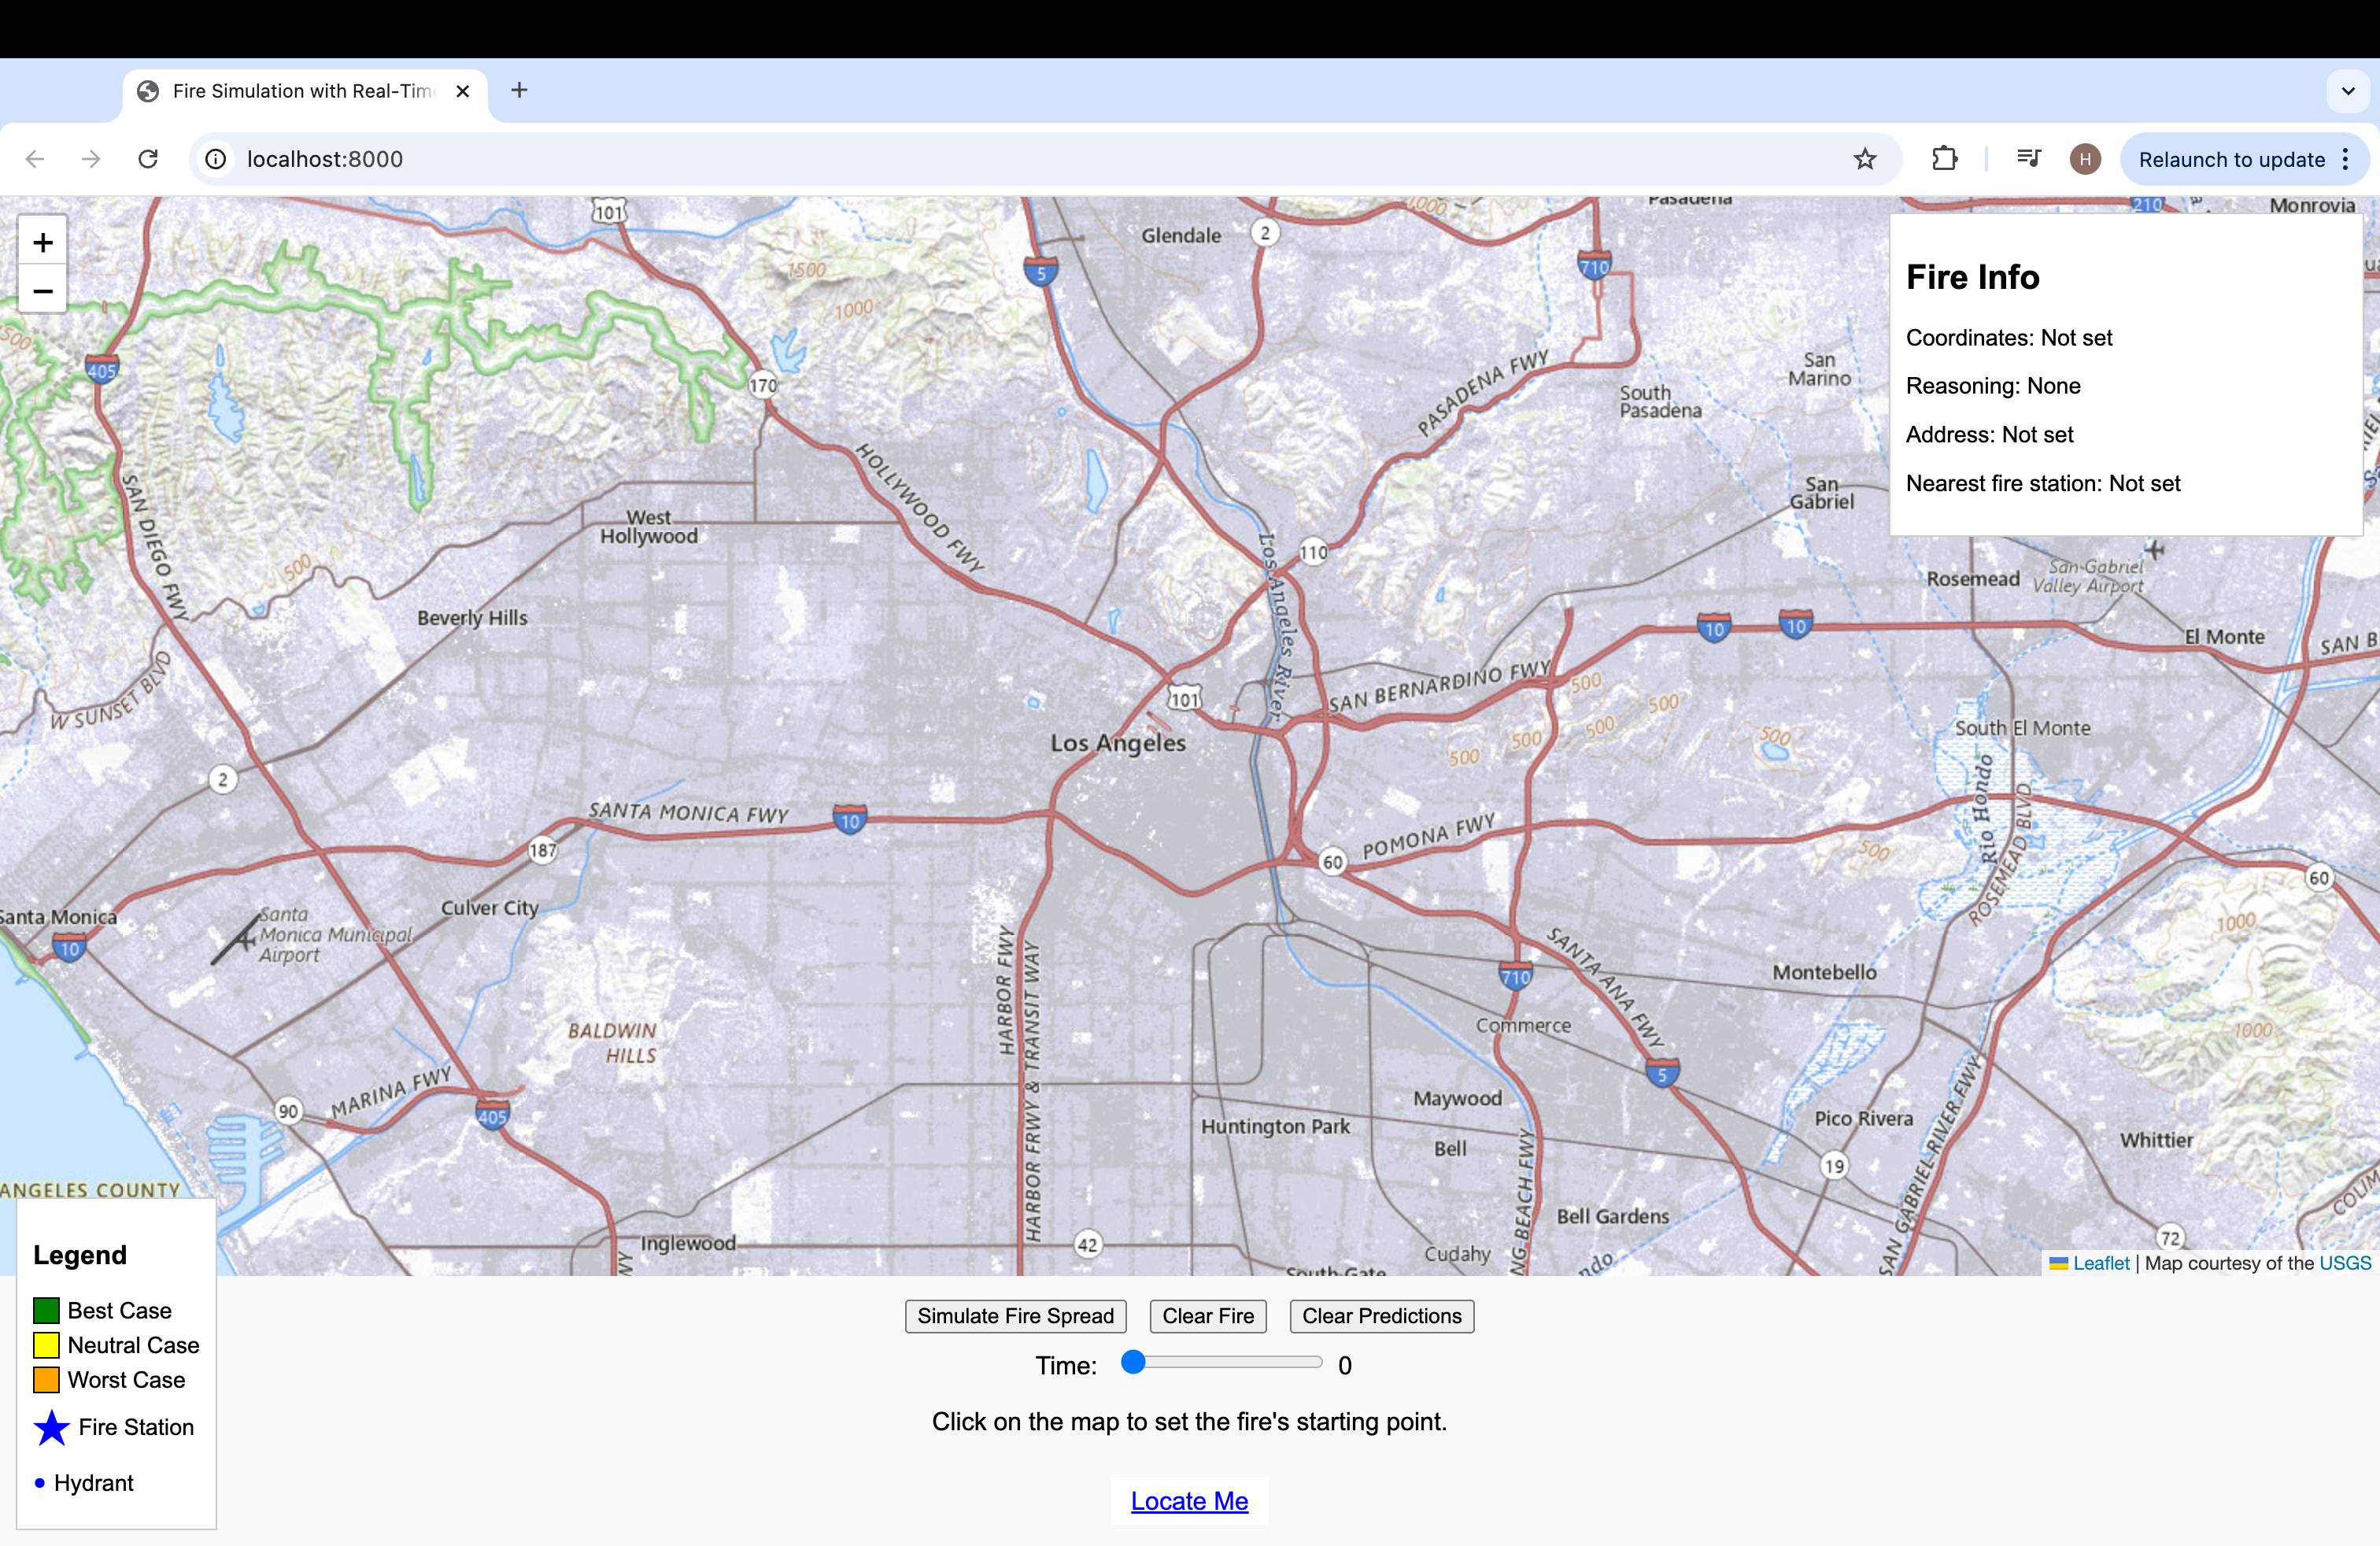
Starting interface


Inspiration
Wildfires are growing in frequency and intensity, devastating communities and natural landscapes. Inspired by the proven effectiveness of Rothermel’s equations—used by fire and forest management systems like the US Forest Service—we set out to create Blaze Map, a tool that empowers communities with real‑time fire spread insights.
What it does
Blaze Map simulates wildfire spread on an interactive map using real-world weather and terrain data.
- Dynamic Fire Simulation: Users set the starting point and view three scenarios—best-case, neutral, and worst-case spread.
- Real-Time Environmental Data: The sidebar displays detailed conditions (e.g., temperature, wind speed/direction, humidity, precipitation, slope, fuel type, and land cover).
- Resource Mapping: Nearby firefighting resources, such as fire stations and hydrants, are shown to enhance situational awareness.
- Locate Me: A button allows users to center the map on their current location, offering critical context for emergency planning.
How we built it
We integrated multiple external APIs into a single web interface using:
- Leaflet for interactive mapping and visualization.
- WeatherAPI for current weather data, such as humidity, temperature, wind (speed and direction
- OpenElevation API (accessed through a CORS proxy) for elevation data.
- Overpass API to obtain land cover information.
- OpenCage Data for reverse geocoding and address retrieval.
- Native JavaScript (with modern ES6+ features), HTML, and CSS for the core application logic and UI.
We based our fire spread model on Rothermel’s equations, modifying it to suit real‑time visualization needs.
- We simplified Rothermel's complex equations to maximize convenience of use for users without extensive fire knowledge
- We incorporated as much weather and terrain data as we feasibly could, from humidity to slope. We then apply them in such a way that roughly mirrors Rothermel's equations
- Mathematically, the fire is expressed as elliptical shapes mimicking real fire spreads, and a recursive algorithm is also employed as inspired by real-life fire behavior
- And we provided best, neutral, and worst case scenarios of the fire spread based on scaling factors
Challenges we ran into
API Integration & CORS: Combining data from several sources and overcoming cross-origin issues required using proxy services and carefully handling HTTP/HTTPS requests.
Data Consistency: Normalizing disparate data (weather, elevation, land cover) into a coherent model posed significant challenges.
Visual Scaling: Ensuring that the fire’s visual representation accurately reflected its real-world spread—without overwhelming the map—took several iterations.
Accomplishments that we're proud of
- Successfully integrating multiple complex real‑time data sources into a single, interactive simulation.
- Developing a clear and intuitive UI that communicates complex fire behavior effectively.
- Building a model based on established fire management research that provides actionable insights for communities.
What we learned
- The importance of handling asynchronous data and CORS issues when integrating multiple APIs.
- How to adapt and simplify complex mathematical models (like Rothermel’s equations) for real‑time visualization.
- Best practices for building responsive, user-friendly web interfaces that work across devices
- The habit of thinking from a user's standpoint to constantly improve user experience
- Connecting complex backend models and APIs with a frontend HTML interface
What's next for Blaze Map
We plan to refine our predictive model with additional environmental variables and machine learning techniques, add more detailed resource mapping (including evacuation routes and critical infrastructure), and expand our platform to support broader emergency management applications.
Built With
- css3
- html5
- javascript
- leaflet.js
- opencage
- overpass
- vscode
- weatherapi

Log in or sign up for Devpost to join the conversation.