-
-
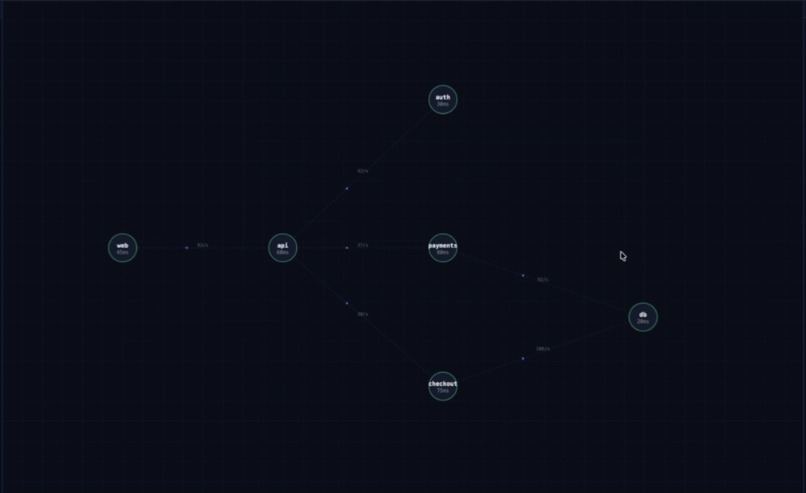
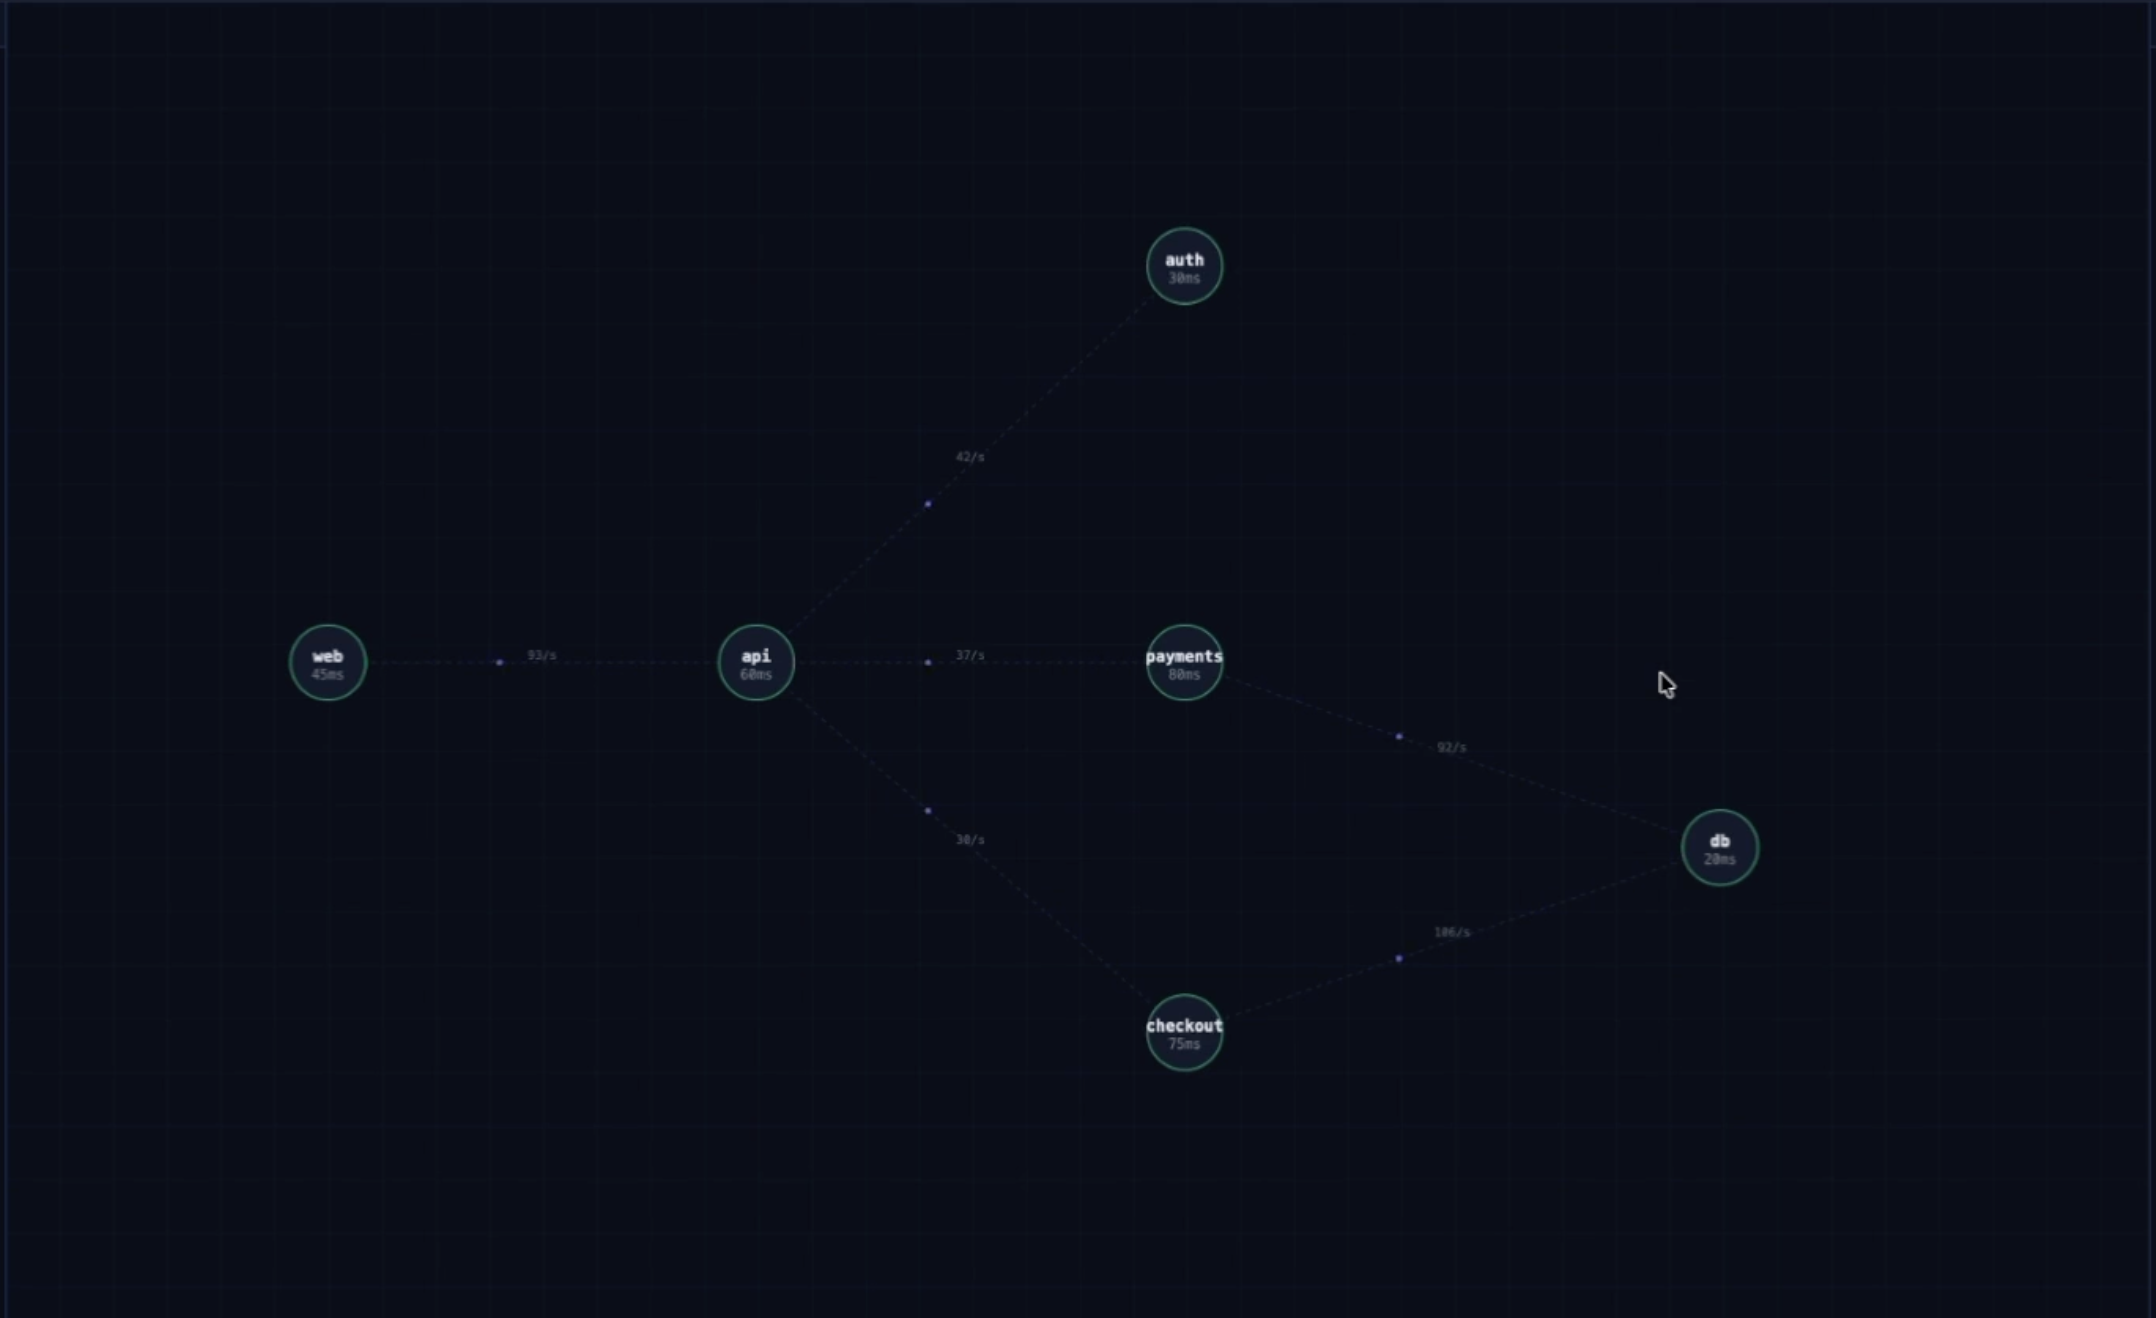
Dependency Graph
-
Blast radius Sentinel
Inspiration
Every SRE I've spoken to has lived through the same nightmare: a database starts degrading at 2am, and the first signal they get is a page — fifteen minutes after thousands of users started seeing errors. By then, the blast radius has already expanded across five services and three regions.
The frustrating part? Splunk had all the signals the entire time. The latency climb, the error rate spike, the cascade through downstream services — it was all there. Nobody connected it.
That's what inspired Blast Radius Prophet: what if the 5–15 minute window before user-visible impact could be used productively? What if an agent could infer the full blast radius from live Splunk data and hand the on-call engineer a complete pre-incident playbook before they even get paged?
What it does
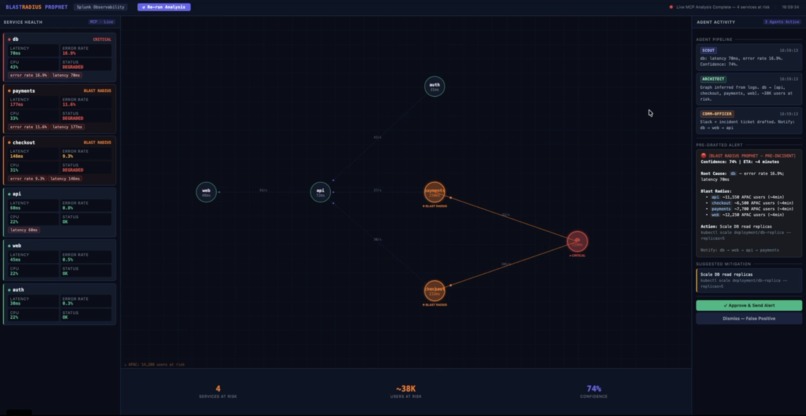
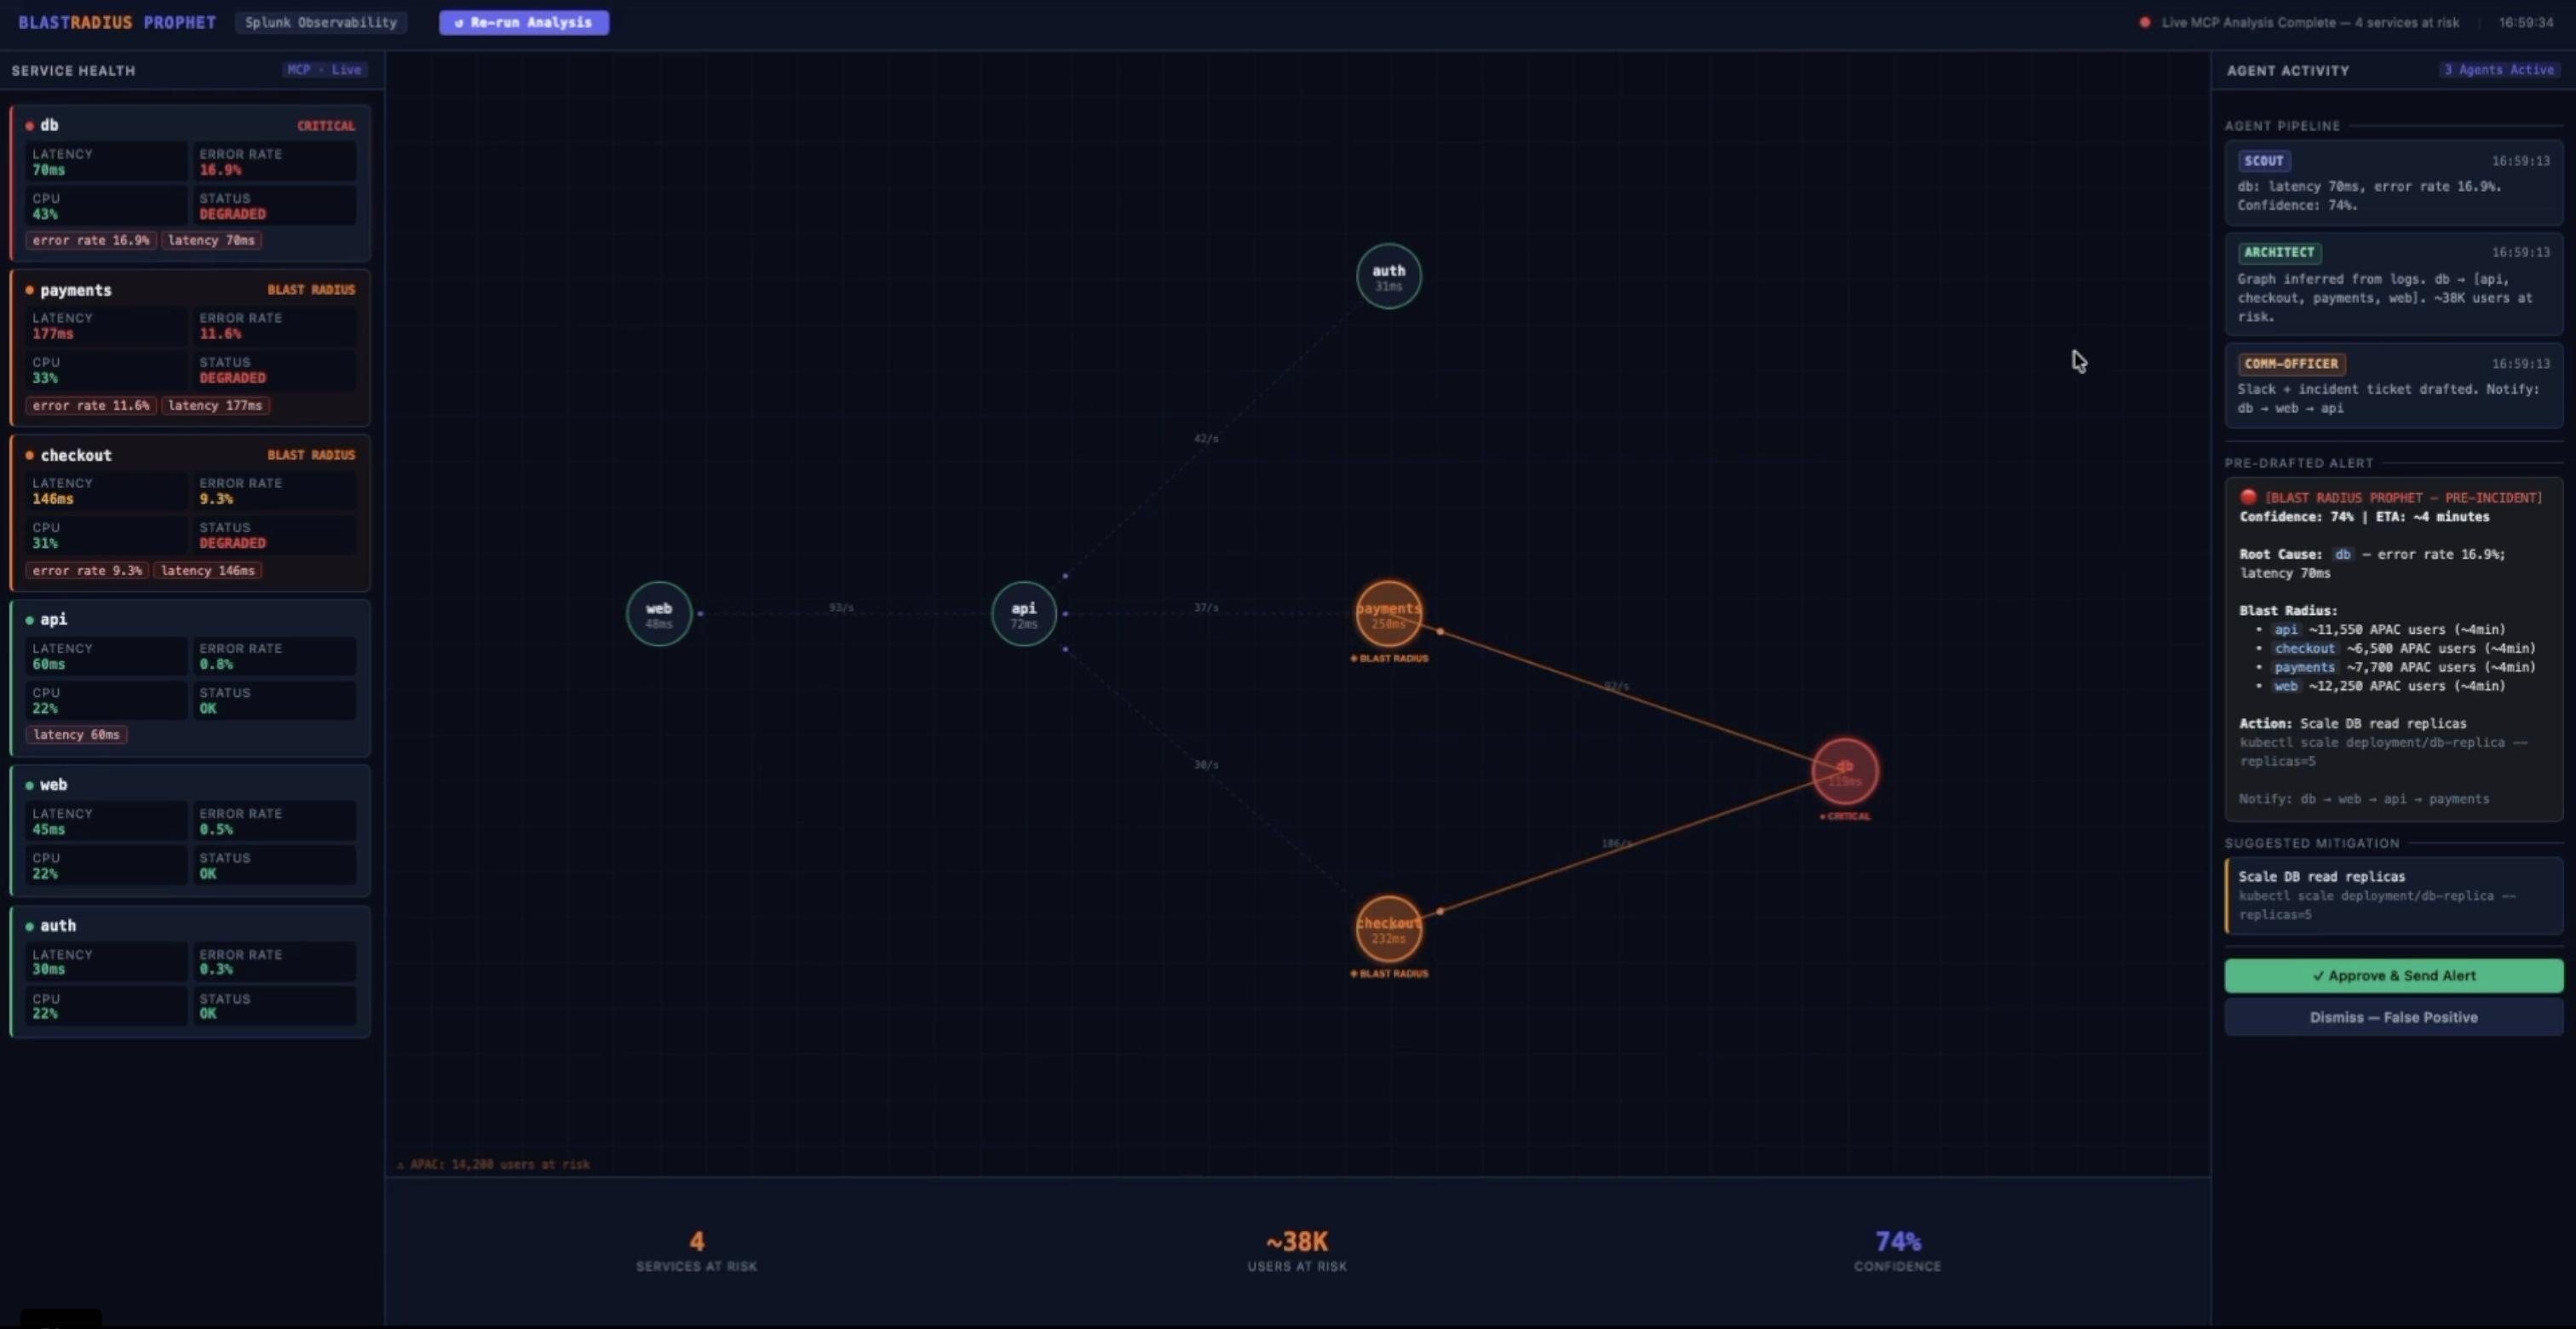
Blast Radius Prophet is a multi-agent AI system that predicts incident blast radius before a SEV is declared.
Three agents run in sequence via the Splunk MCP Server:
- Scout Agent detects anomalies in service metrics (latency, error rate, CPU) by querying Splunk via
splunk_run_query - Architect Agent infers the live service dependency graph entirely from observed traffic patterns in Splunk logs — no CMDB, no manual diagrams — then performs BFS traversal to compute which services, users, and regions will be impacted
- Comm-Officer Agent pre-drafts the complete incident response: Slack alert, incident ticket, notification order ranked by user impact, and one suggested mitigation
A human operator reviews and approves everything with one click — human-in-the-loop by design.
How we built it
The core insight was that the service dependency graph doesn't need to be manually maintained. It can be inferred from actual observed call patterns in Splunk logs using a single SPL query:
index=main sourcetype=microservice:json | stats count by service, upstream_service, downstream_service | where count > 5 | sort -count
From there, the architecture came together in layers:
- Splunk MCP Server (Splunkbase app 7931) — installed locally, configured with
mcp_userrole and encrypted token authentication - Python
mcplibrary +mcp-remote— connects the agent pipeline to the MCP Server over StreamableHTTP via stdio bridge - Three async agents — Scout, Architect, Comm-Officer — each calling
splunk_run_queryvia MCP - Flask backend — wraps the agent pipeline as a REST API
- Single-screen UI — Canvas-based service graph with live blast radius visualization and human approval flow
The hardest part was getting the MCP connection right. The encrypted token format, the mcp_user role requirement, the NODE_TLS_REJECT_UNAUTHORIZED flag for self-signed certs — none of this was obvious from the docs. We got there eventually, and the [Local→Remote] tools/call messages firing in real time made it worth it.
Challenges we ran into
MCP authentication was the biggest hurdle. The Splunk MCP Server requires encrypted tokens generated from within the app itself — not from Settings → Tokens. Tokens with wrong audience, wrong role name, or generated outside the app all silently fail with 401 or 403. The Splunk Community Slack (#splunk-ai-hackathon) was invaluable for unblocking this.
Root cause identification in the Architect Agent required careful graph traversal logic. The naive approach flagged payments as the root cause (highest latency) when the real root was db (highest error rate, depended upon by both payments and checkout). The fix was to identify the deepest anomalous node in the dependency graph — the one that other critical services depend on.
CDTSM and SAIA (Cisco Deep Time Series Model and Splunk AI Assistant) both require cloud tenant provisioning via the Cloud Connected setup — which wasn't immediately clear from the documentation. We integrated the AI Toolkit and are in the process of completing the cloud connected setup to unlock these hosted models.
Accomplishments that we're proud of
- Live dependency graph inference from Splunk logs — no CMDB, no manual config, purely from observed traffic. This works in any environment where services are logging their call relationships.
- True MCP integration — every single Splunk query in the agent pipeline goes through the official Splunk MCP Server via
splunk_run_query. Not a Python SDK wrapper, not a REST API call — actual MCP protocol over StreamableHTTP. - Sub-3-second analysis — the full three-agent pipeline completes in under 3 seconds from click to pre-drafted alert.
- Human-in-the-loop UI — the Approve/Dismiss flow was a deliberate design choice. AI earns trust by showing its work and asking for permission.
What we learned
- The Splunk MCP Server is genuinely powerful once configured correctly. The
splunk_run_querytool is fast, reliable, and the encrypted token security model is well-designed. - Inferring topology from telemetry is more reliable than maintaining CMDBs. Logs don't lie; documentation does.
- The
mcp-remotebridge pattern (npx mcp-remote → stdio → Python mcp ClientSession) is the right way to connect Python agents to any MCP server programmatically — not just Splunk. - Multi-agent coordination doesn't require a heavy framework. Three async functions with clear input/output contracts are sufficient when the agents have well-defined roles.
What's next for Blast Radius Prophet
- Social media signal integration — ingest real-time signals from Twitter/X, Reddit, and support channels into Splunk. When negative sentiment spikes around your product during an incident window, Blast Radius Prophet can correlate it with internal service anomalies to validate blast radius predictions and prioritize user-facing services first
- Complete CDTSM integration — once cloud tenant provisioning completes, replace threshold-based anomaly detection with the Cisco Deep Time Series Model for more accurate early warning
- SAIA SPL generation — use
saia_generate_splto let on-call engineers ask natural language questions during live incidents - KV Store persistence — store the inferred dependency graph in Splunk KV Store so it accumulates over time and becomes more accurate
- Real Slack/PagerDuty integration — wire the Comm-Officer output to actual notification systems
- Continuous monitoring mode — run Scout agent on a schedule, not just on-demand

Log in or sign up for Devpost to join the conversation.