-

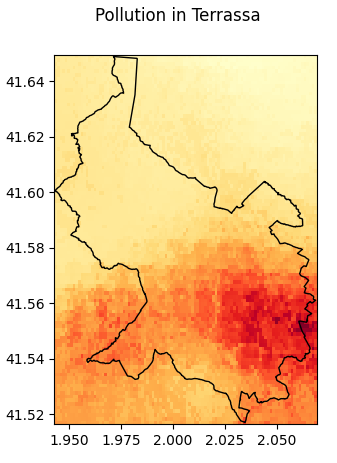
Prediction of pollution in Terrassa
-

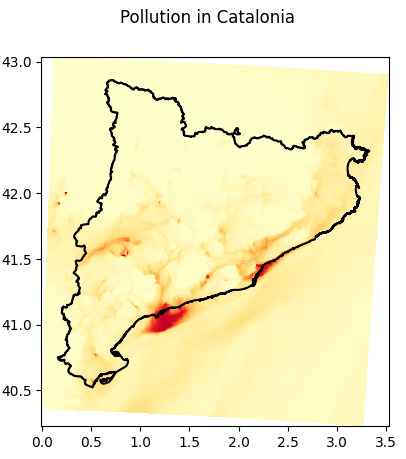
Prediction of pollution in Catalonia
-

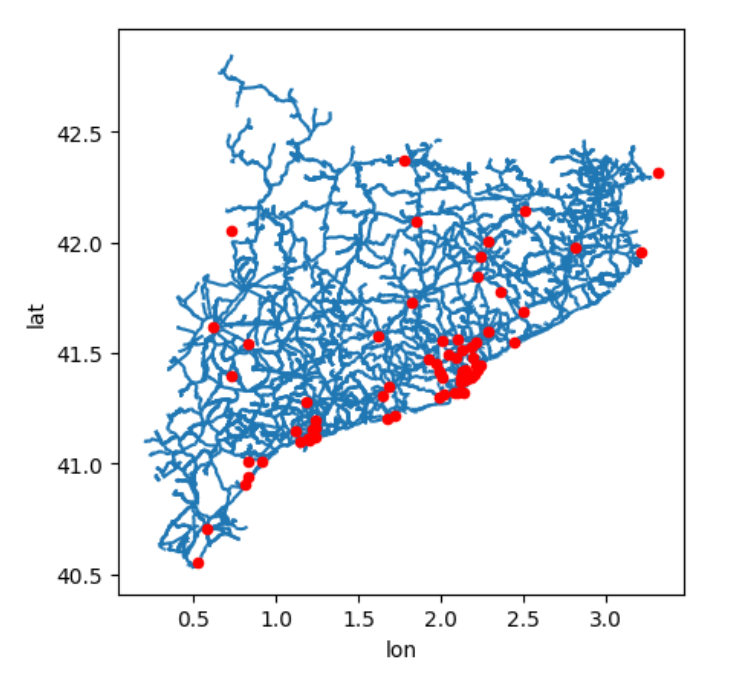
In red, radars, and in blue, roads in Catalonia
Inspiration
We found this project the most interesting way to challenge our knowledge and learn new skills.
What it does
Our code predicts the N02 concentration in Catalonia thanks to data provided by BSC.
How we built it
We used a jupyter notebook and diverse Python libraries such as numpy, pandas, geopandas, and scipy for data adquisition and prediction, and matplotlib for plotting.
Challenges we ran into
This was our first time working with such amounts of data and so many libraries, so it was all a big challenge. Especially on the data adquisition part, as we had huge amount of data and we lost a lot of time just searching through the data to see what would be useful.
Accomplishments that we're proud of
We're both very proud of our visualizations and the fact that we scored on the kaggle.
What we learned
We learned a lot, specially with the use of new libraries and data adquisition. We also learned how to organize ourselves for a project this big, as it was a first for both of us.
What's next for BitsxLaMarato - Fem visible l'invisible
We would like to improve this project taking other data into account, such as road traffic and distance to road.
Built With
- jupyter
- python

Log in or sign up for Devpost to join the conversation.