-
-
⚡ Next-gen Crypto Intelligence Terminal engineered for surgery-grade precision. Built with Next.js 16, Tailwind v4, and native WebSockets
-
Live analytics
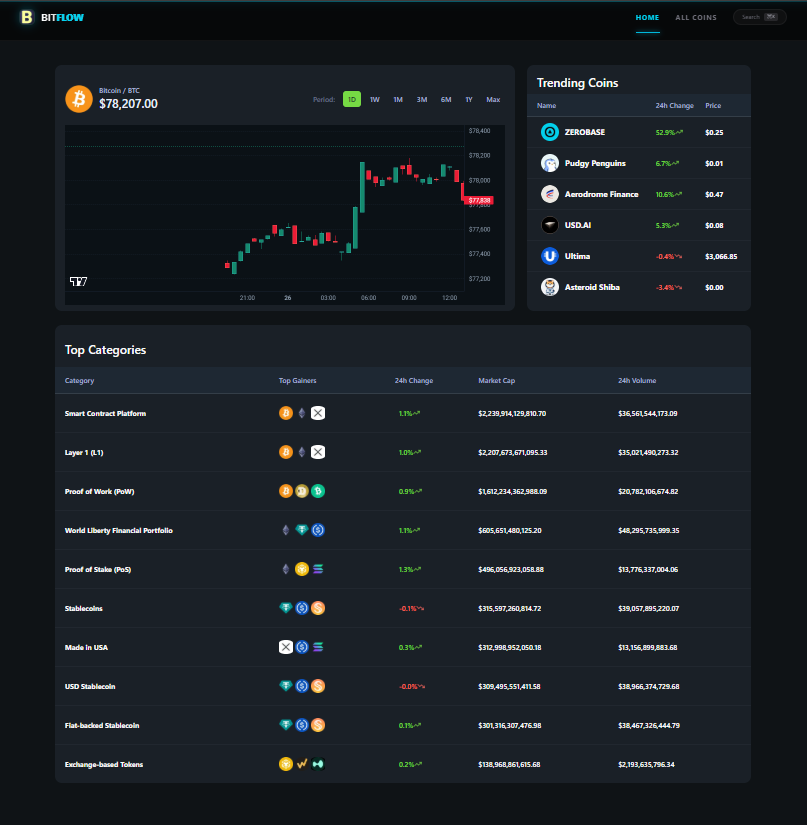
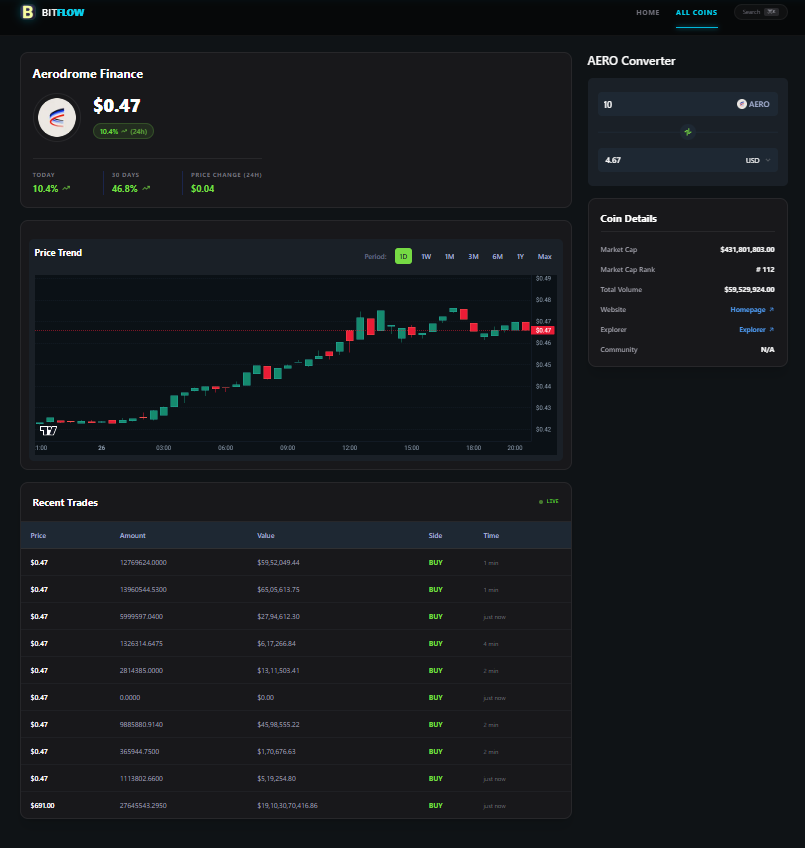
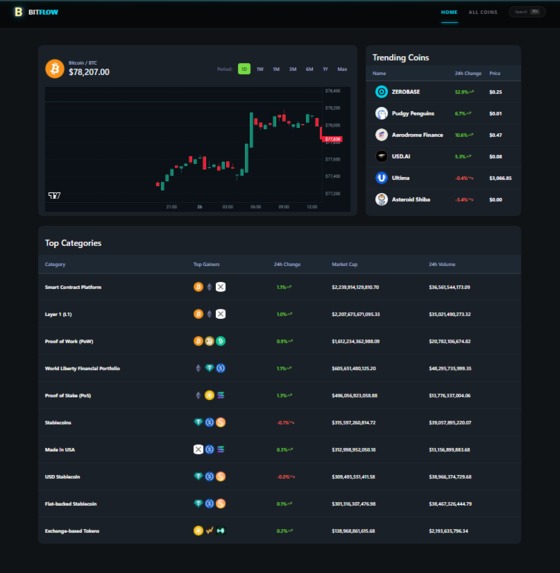
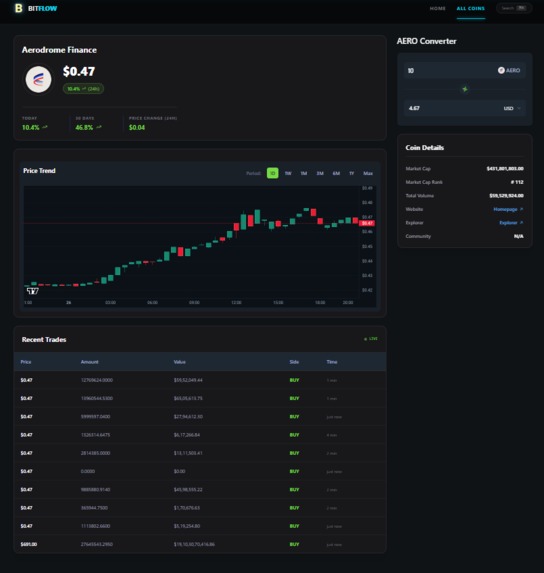
The volatile nature of the cryptocurrency market often leaves traders overwhelmed by fragmented data. I was inspired to create BitFlow Pro to bridge the gap between complex financial metrics and an intuitive, cinematic user experience. My goal was to build a dashboard that doesn't just show numbers but tells a visual story of market movements.
What I Learned Building BitFlow Pro deepened my expertise in managing high-frequency data streams and optimizing frontend performance. I mastered:
State Management: Handling real-time API updates without compromising UI fluidity.
Advanced Animations: Using GSAP to create scroll-triggered interactions that guide the user's focus.
API Architecture: Efficiently fetching and caching data from the CoinGecko API.
What it does
BitFlow Pro is an advanced cryptocurrency analytics platform designed to convert raw market data into an immersive, cinematic experience.
Key Functionality: Real-Time Market Tracking: It fetches and displays live data for global market capitalization, 24-hour volume, and individual coin price metrics using the CoinGecko API.
Dynamic Data Visualization: The dashboard utilizes Chart.js to render interactive price-action charts across multiple timeframes, allowing for deep technical analysis.
Cinematic Interaction: It leverages GSAP (GreenSock) and ScrollTrigger to create fluid, scroll-based UI transitions and high-performance animations.
Performance Optimization: Built with Next.js 16 and Tailwind CSS v4, the application is optimized for speed, ensuring smooth interactions even while handling high-frequency data streams.
Seamless User Experience: It features a "Glassmorphism" design aesthetic, providing a modern and intuitive interface for monitoring digital asset portfolios.
How i built it
The project is architected using the MERN stack with a focus on modern frontend tooling.
Frontend: I used Next.js 16 and Tailwind CSS v4 to ensure a lightning-fast, responsive interface.
Data Layer: Integrated Axios to fetch live price action, market cap, and volume metrics.
Visualization: I utilized Chart.js to render dynamic price trends over multiple timeframes.
Challenges Faced The biggest challenge was maintaining 60 FPS performance while rendering complex GSAP animations and real-time charts simultaneously. I overcame this by implementing code-splitting and optimizing React's rendering lifecycle to ensure that only the necessary components updated during price fluctuations.
Challenges we ran into
State Synchronization: Managing real-time data streams from the CoinGecko API while maintaining synchronized GSAP animations required careful optimization of React’s rendering lifecycle.
Performance Overhead: Ensuring a 60 FPS experience was difficult when rendering heavy charts alongside scroll-triggered transitions.
API Rate Limiting: Implementing efficient data fetching and caching strategies to stay within the free tier limits of external market data providers.
Accomplishments that we're proud of
Cinematic UI: Successfully integrated GSAP and ScrollTrigger to create a "Glassmorphism" aesthetic that stands out from traditional financial dashboards.
Speed & Scalability: Achieving lightning-fast load times by leveraging the server-side capabilities of Next.js 16.
Responsive Analytics: Delivering a seamless data-viewing experience that remains fully functional and visually striking across mobile and desktop devices.
What we learned
Advanced Animation Techniques: Gained deep expertise in using GSAP for performance-heavy web interactions.
Financial Data Management: Developed a better understanding of how to handle high-frequency data and visualize it accurately for end-users.
Modern CSS Architectures: Mastered the utility-first approach of Tailwind CSS v4 to build complex layouts with minimal custom CSS.
What's next for BitFlow Pro: Real-Time Crypto Analytics Dashboard.
Agentic Integration: Implementing AI Agents (similar to my work on ZenithRAG) to provide automated market sentiment analysis.
Portfolio Tracking: Adding a secure user dashboard with OAuth2 for tracking personal asset performance over time.
Enhanced Visuals: Incorporating Three.js and WebGL Shaders to create a 3D interactive "Global Market Map".
Built With
- chart.js
- coingecko
- css
- express.js
- gsap
- next.js
- node.js
- react
- tailwind


Log in or sign up for Devpost to join the conversation.