-
-

main dashboard
-
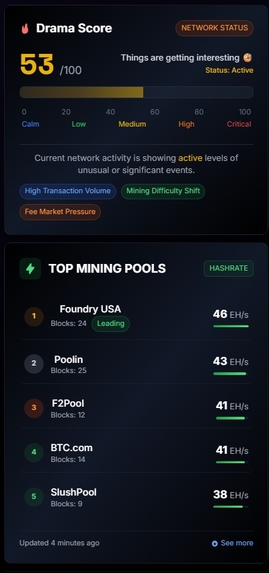
drama score
-
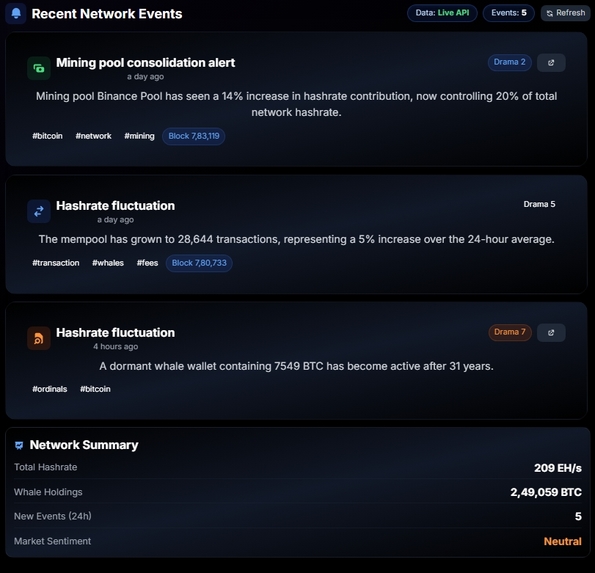
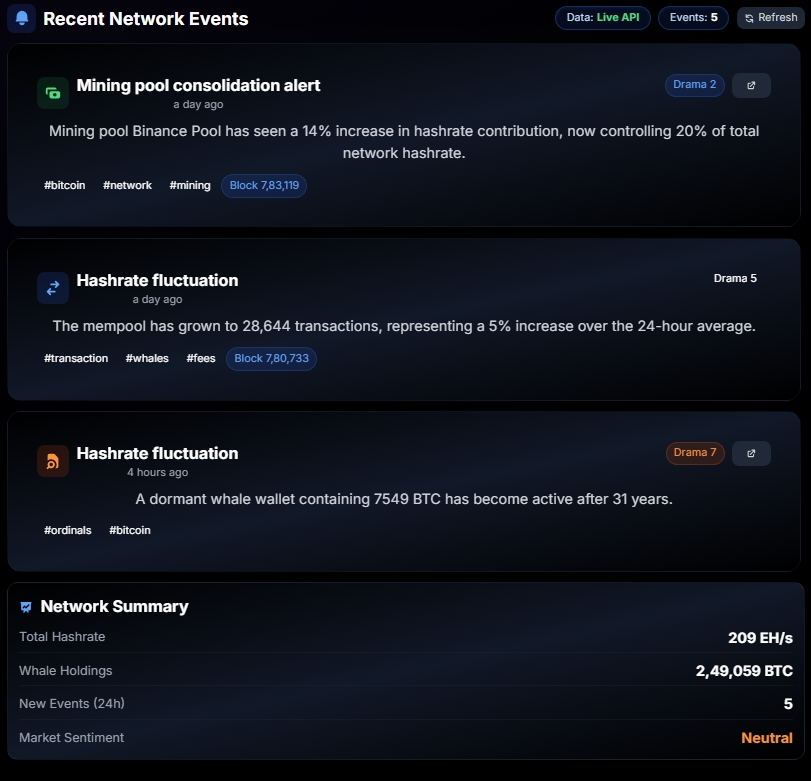
realtime live updates
-
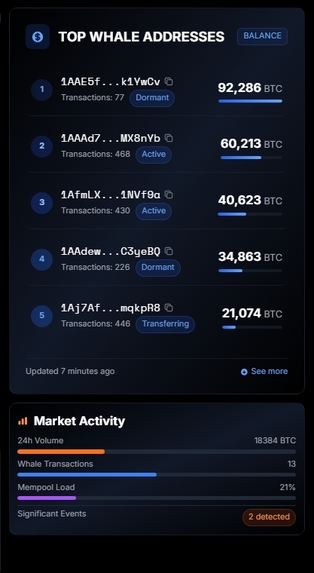
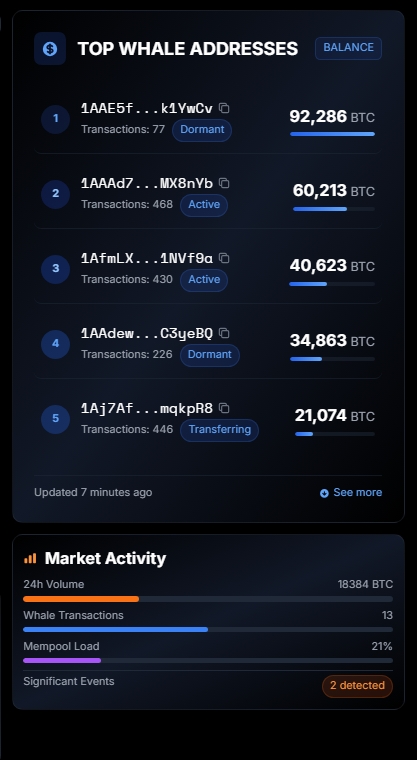
whale scanner
-
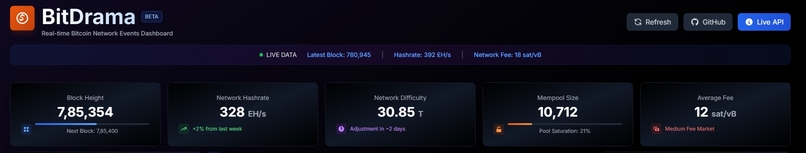
overall information bar
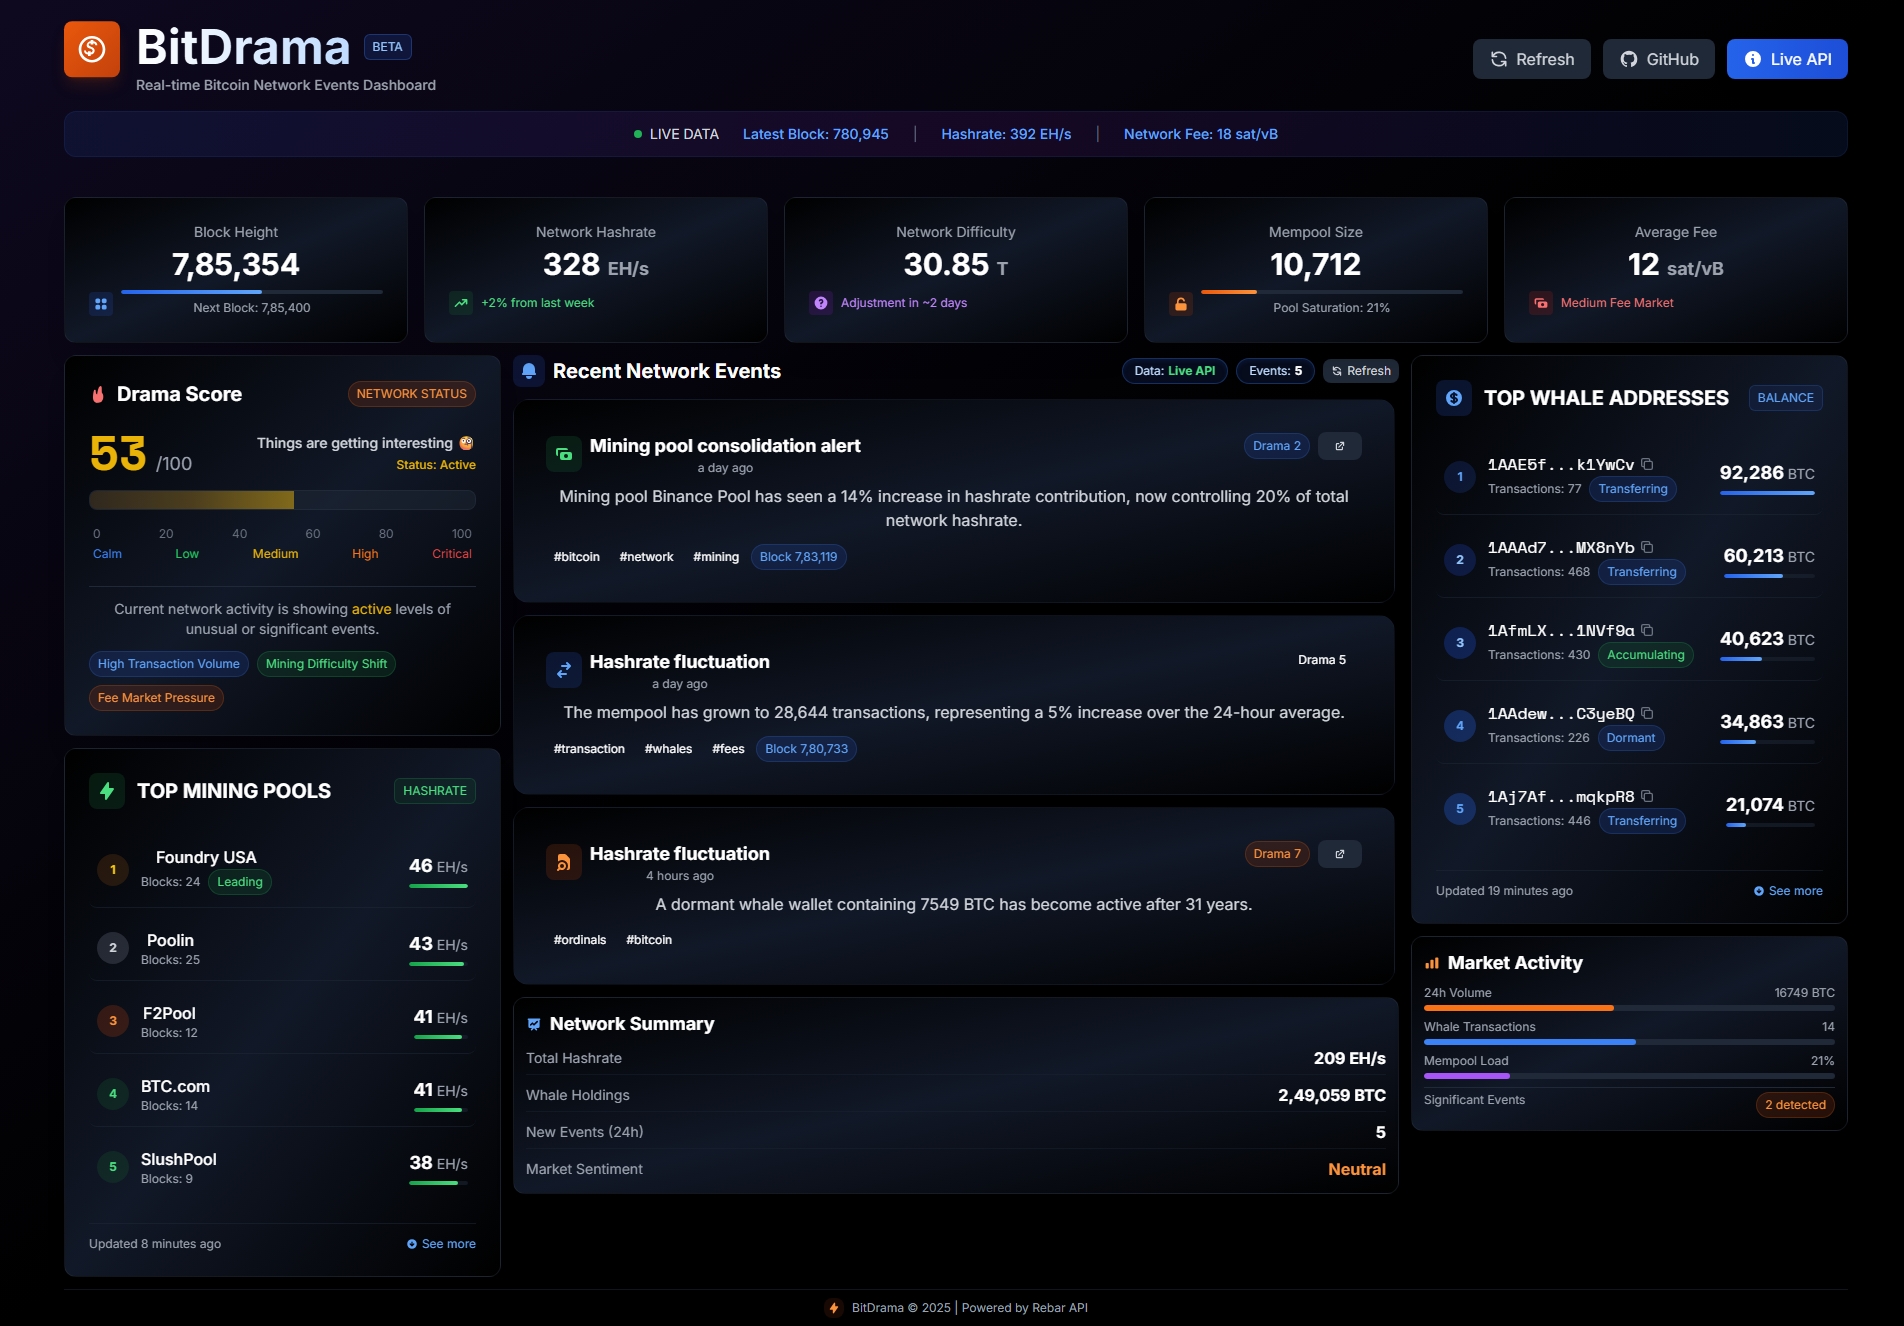


🚀 About the Project
BitDrama is a real-time Bitcoin network event monitoring dashboard designed to capture, visualize, and rank unusual on-chain events like mining pool consolidations, whale transfers, mempool spikes, and hashrate fluctuations. It gamifies blockchain observability by adding a Drama Score to the network — quantifying activity surges and anomalies in an intuitive, narrative-driven format.
💡 What Inspired Us
We’ve always been fascinated by how unpredictable and dramatic blockchain networks can be under the hood — sudden hashrate drops, high-fee market pressure, and whales moving thousands of BTC in minutes. Yet, most analytics tools focus on dry charts and numbers.
We wanted to turn Bitcoin network activity into a dynamic, live dashboard experience — something you could leave open and watch like a digital stock ticker, where every fluctuation feels like a headline event.
🛠️ How We Built It
Frontend: Built using React and Tailwind CSS for a clean, responsive, and interactive UI. Backend/API: Leveraged live Bitcoin network data via Rebar Data API and custom monitoring scripts to detect on-chain anomalies. Real-time Updates: Integrated WebSocket streams for continuous data ingestion and stateful UI updates without page refresh. Custom Logic: Created an internal Drama Score Engine that quantifies the severity of events based on: Size of whale transactions Mempool congestion rate Mining pool dominance shifts Chain reorganization frequency Fee market anomalies
📊 What We Learned
How to efficiently handle and visualize real-time blockchain data. The intricacies of mining pool dominance, transaction fee dynamics, and mempool management in the Bitcoin network. Crafting a UI/UX around event storytelling in a technical space. Optimizing WebSocket-based apps for high-frequency updates without UI lag.
⚙️ Challenges We Faced
Data Volume Management: Handling large streams of live transaction data while maintaining smooth UI performance. Anomaly Detection Logic: Defining what constitutes “drama” in an objectively verifiable yet engaging way. Consistent Real-time Sync: Ensuring consistent state management and UI sync when processing dozens of data events per second. API Rate Limits & Test Data: Dealing with limited access to live network APIs during testing phases.
🎉 Outcome
We built an addictive, interactive dashboard where users can track dramatic shifts in Bitcoin network activity in real-time. It not only surfaces critical events but also makes the blockchain's living, breathing nature visible and engaging for both crypto enthusiasts and data nerds alike.


Log in or sign up for Devpost to join the conversation.