-
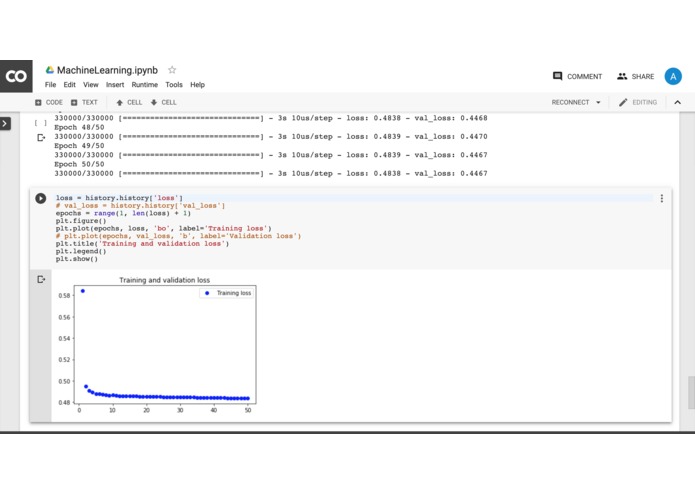
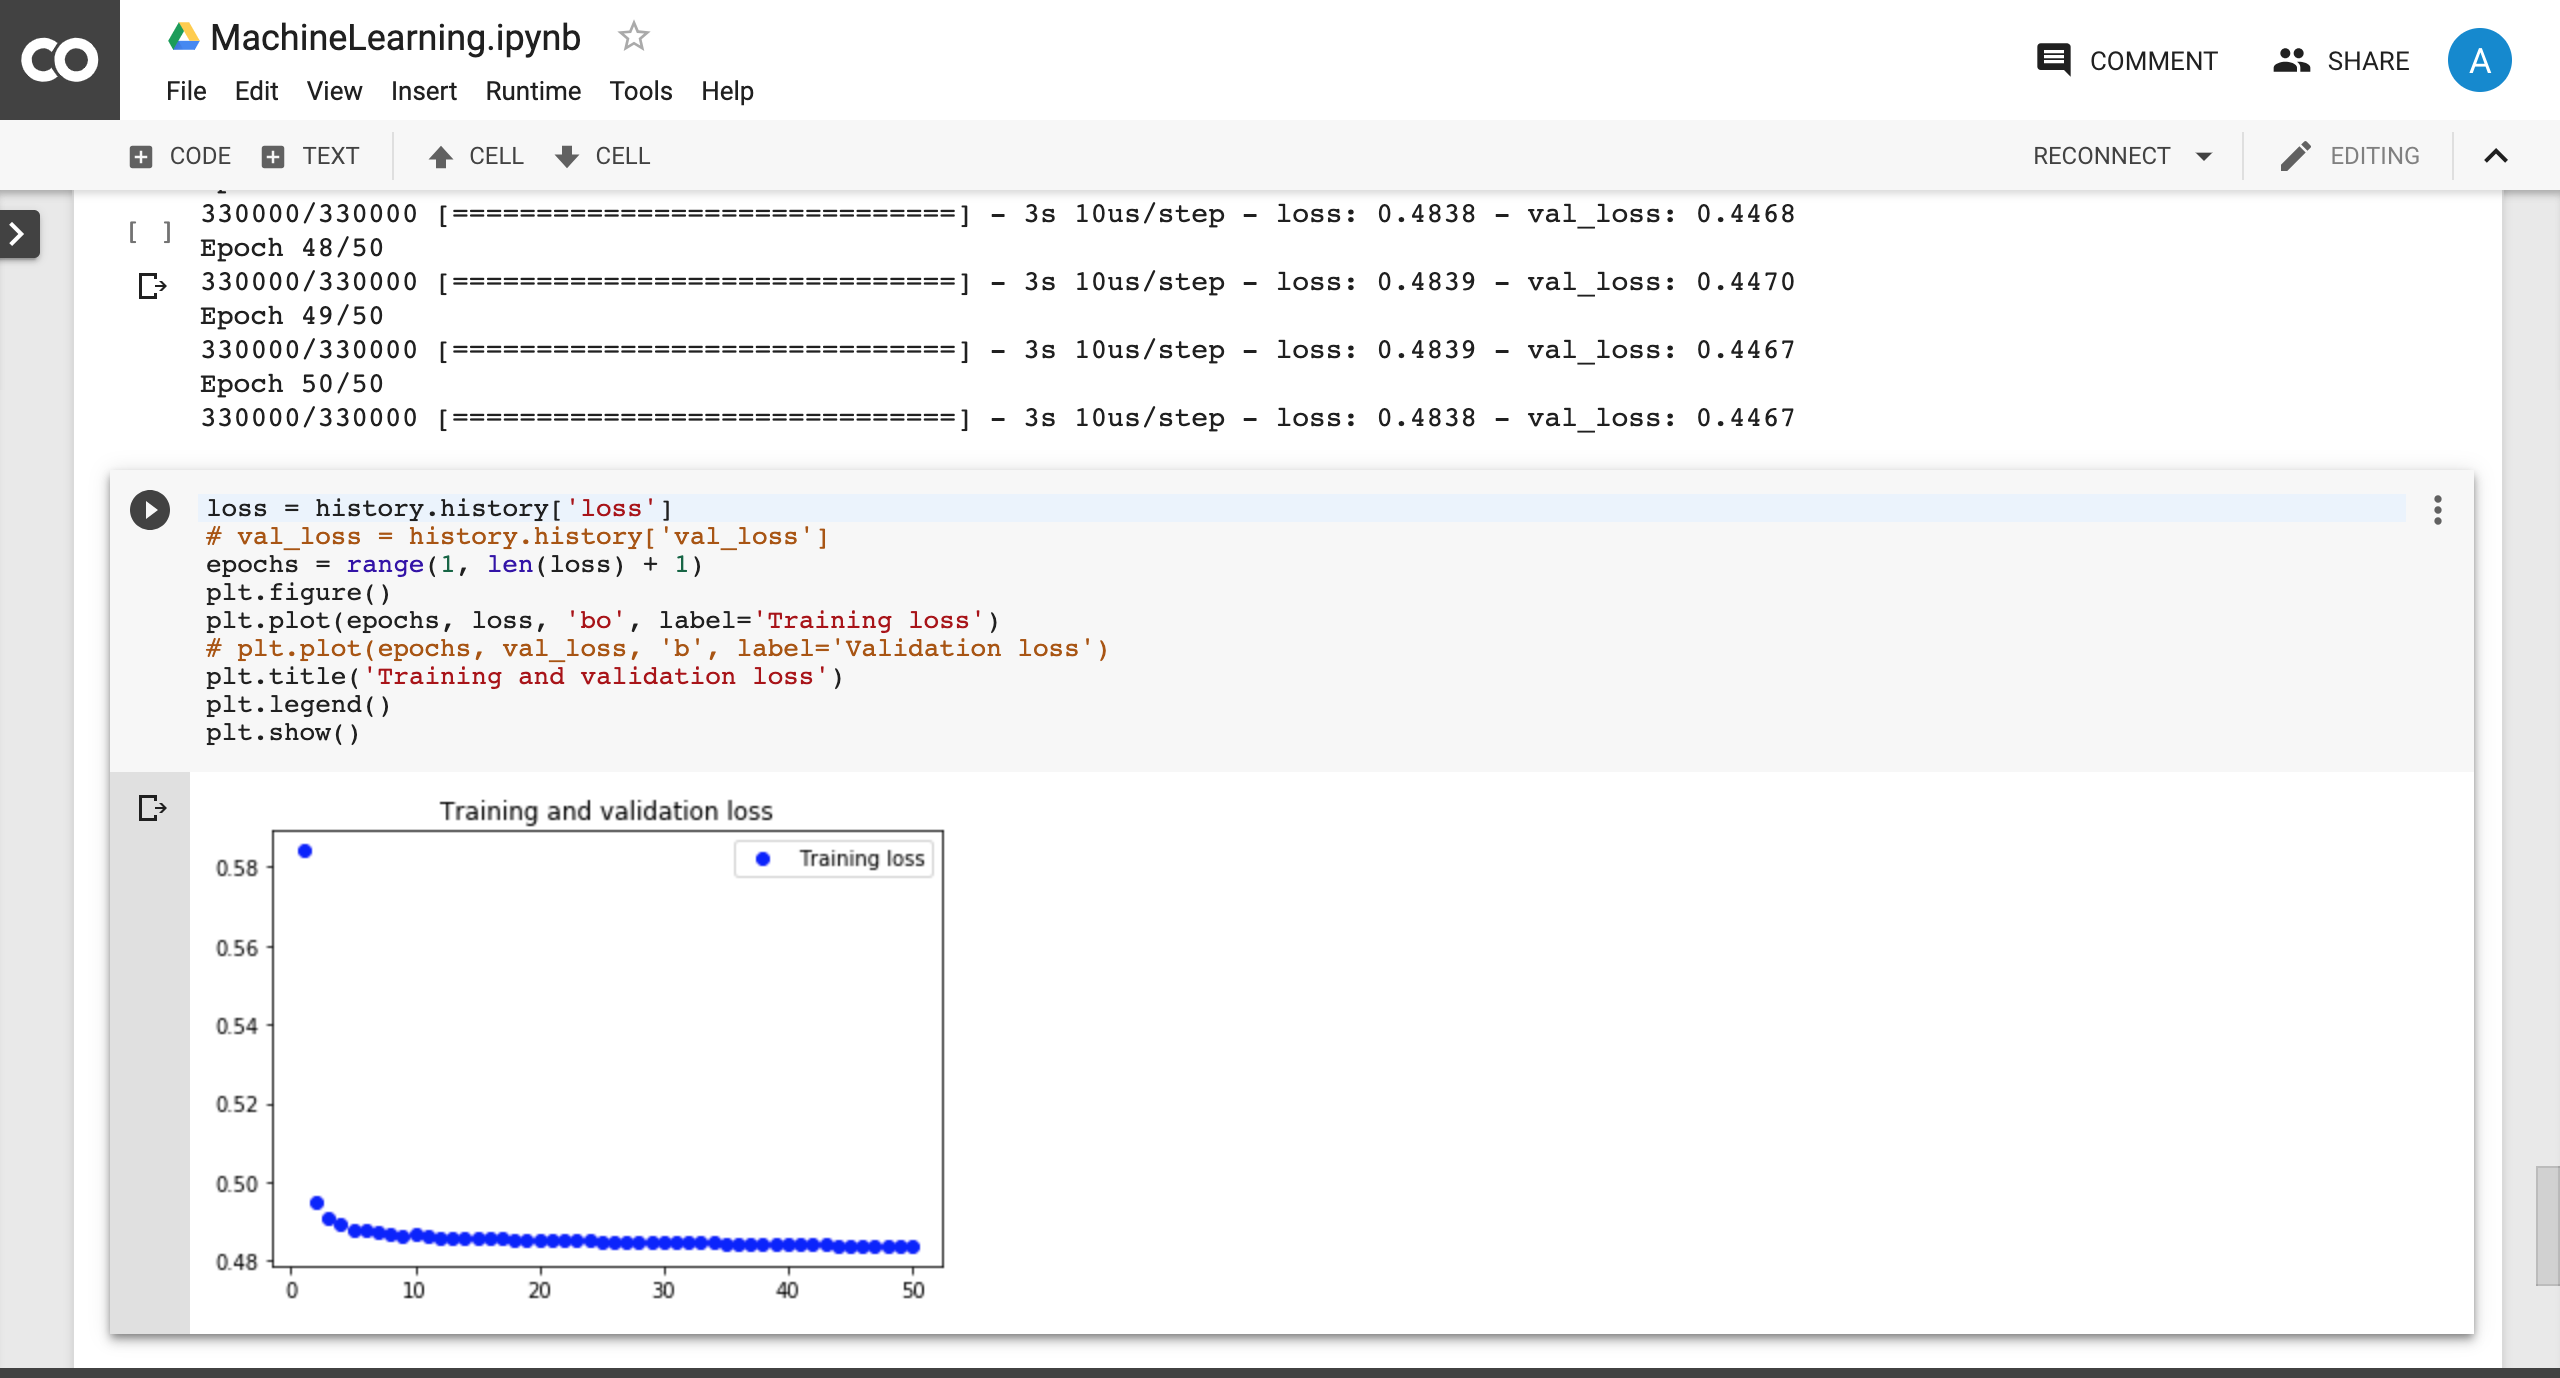
Graph of learning curve of Neural network
-
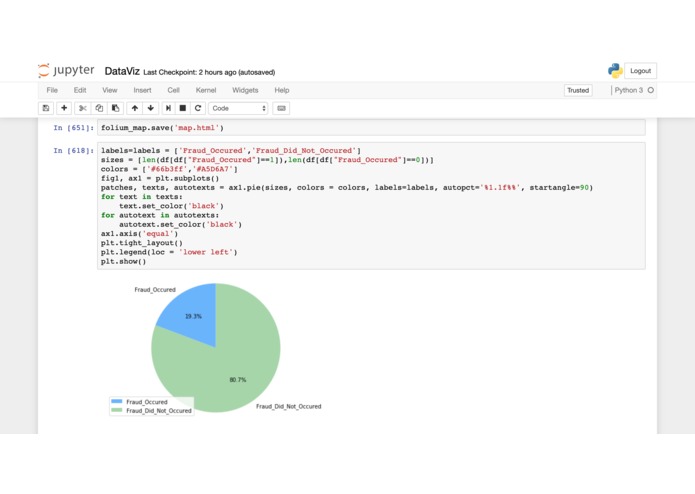
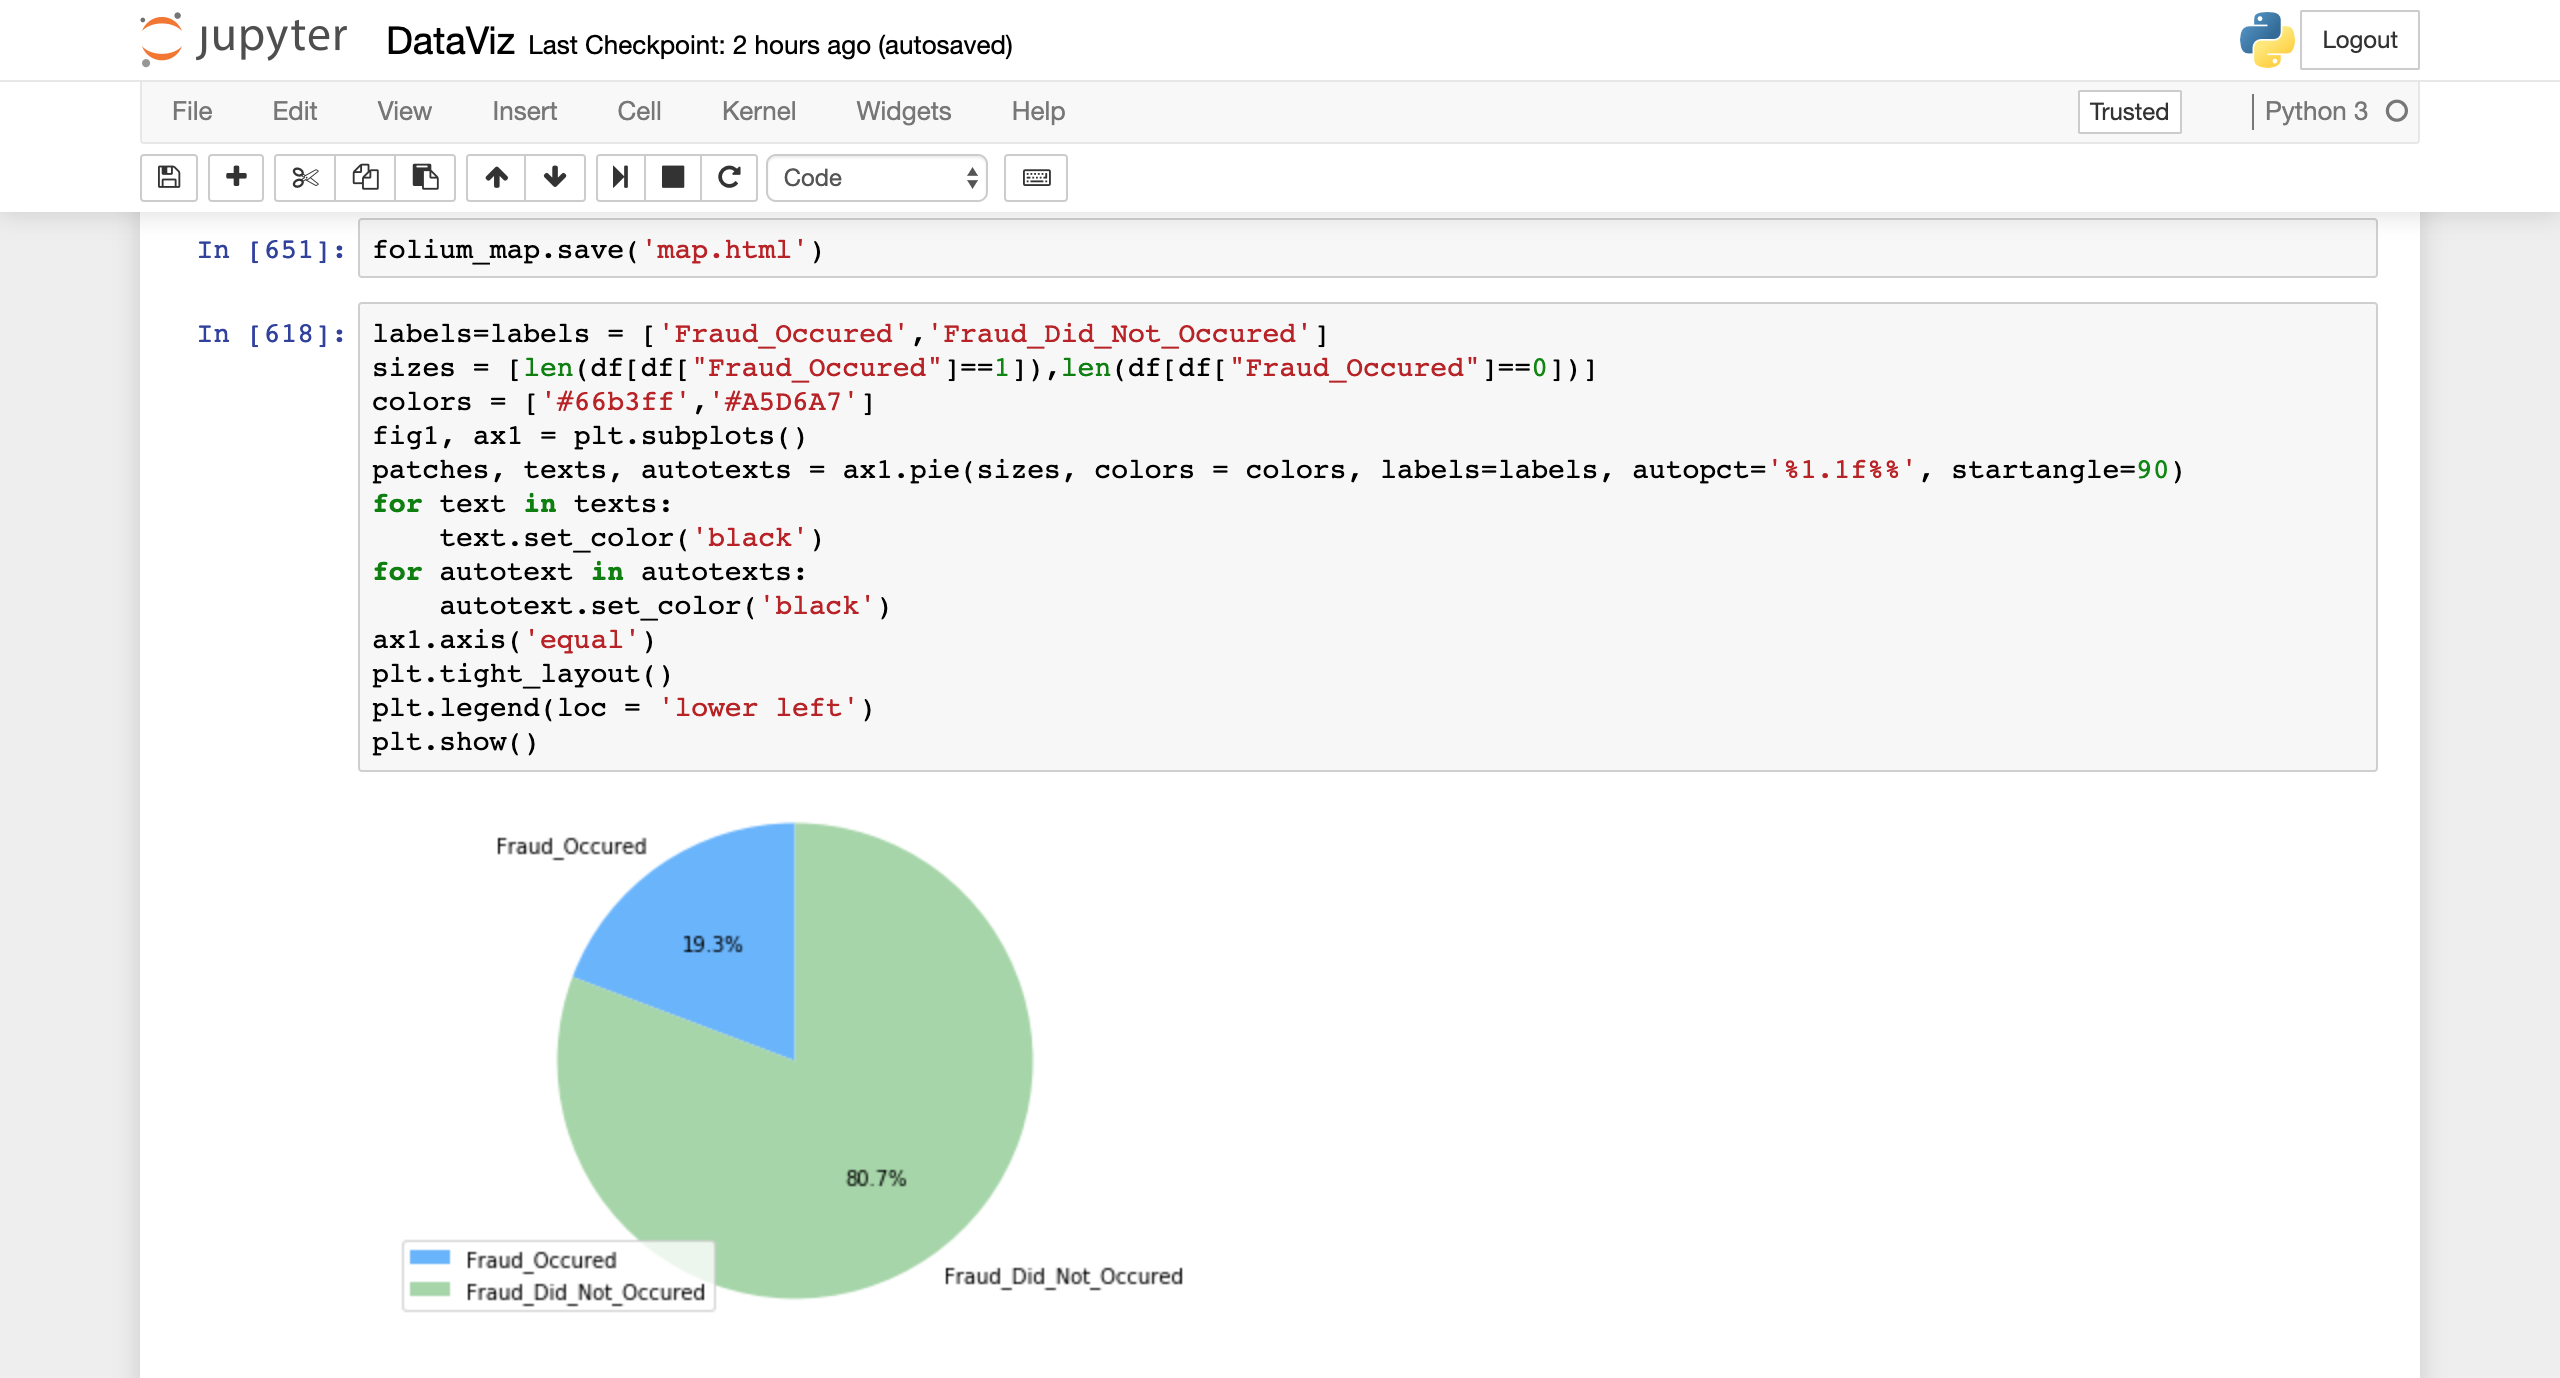
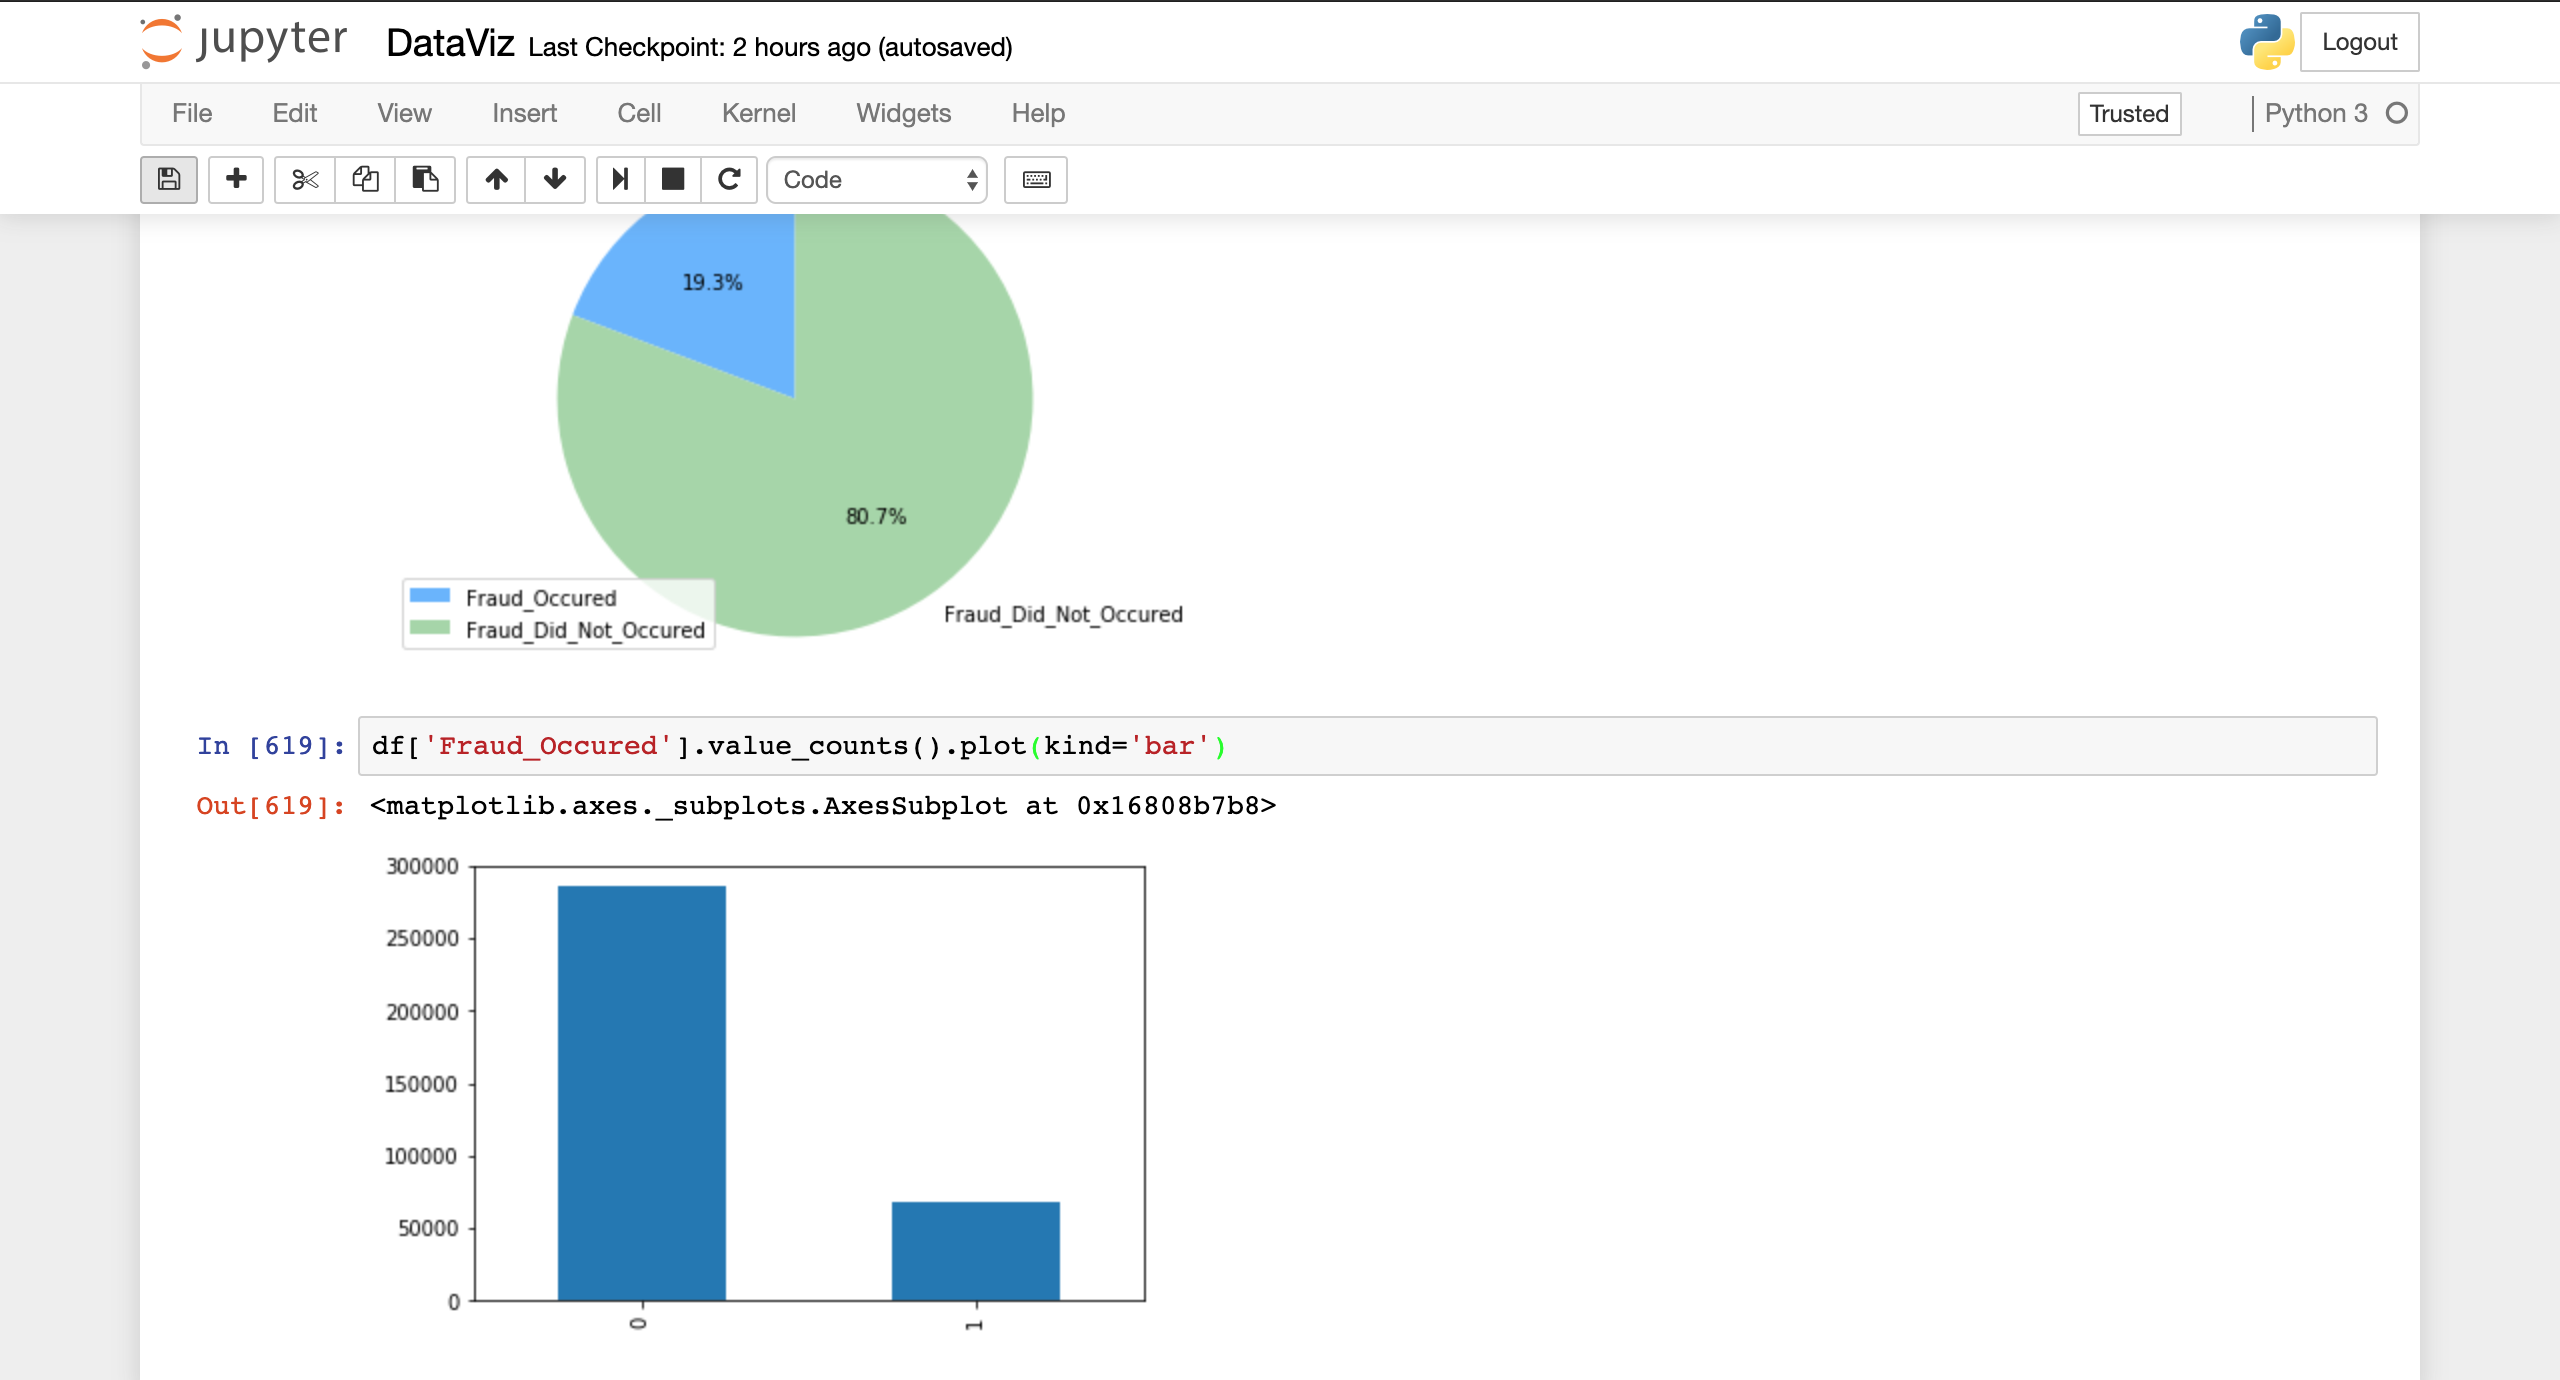
Pie chart of fraudulent %
-
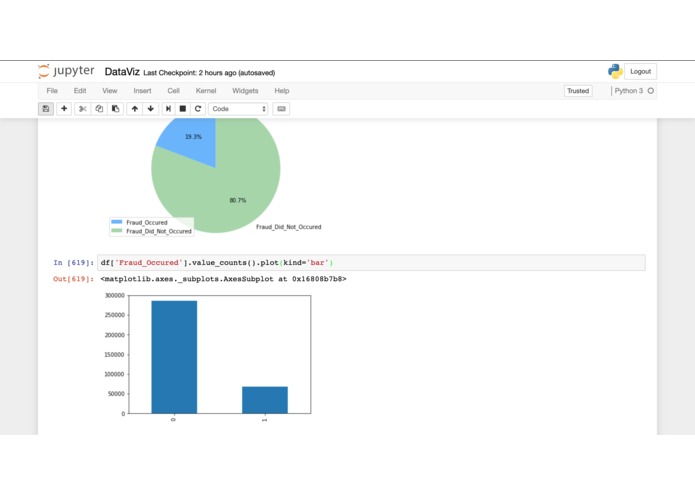
Bar graph of number of frauds
-
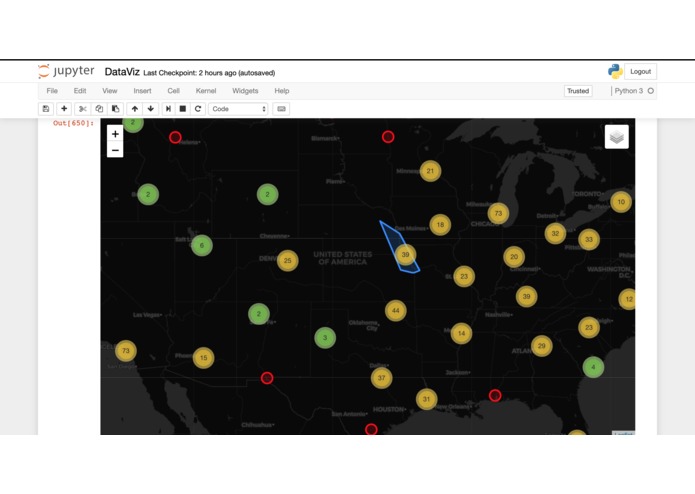
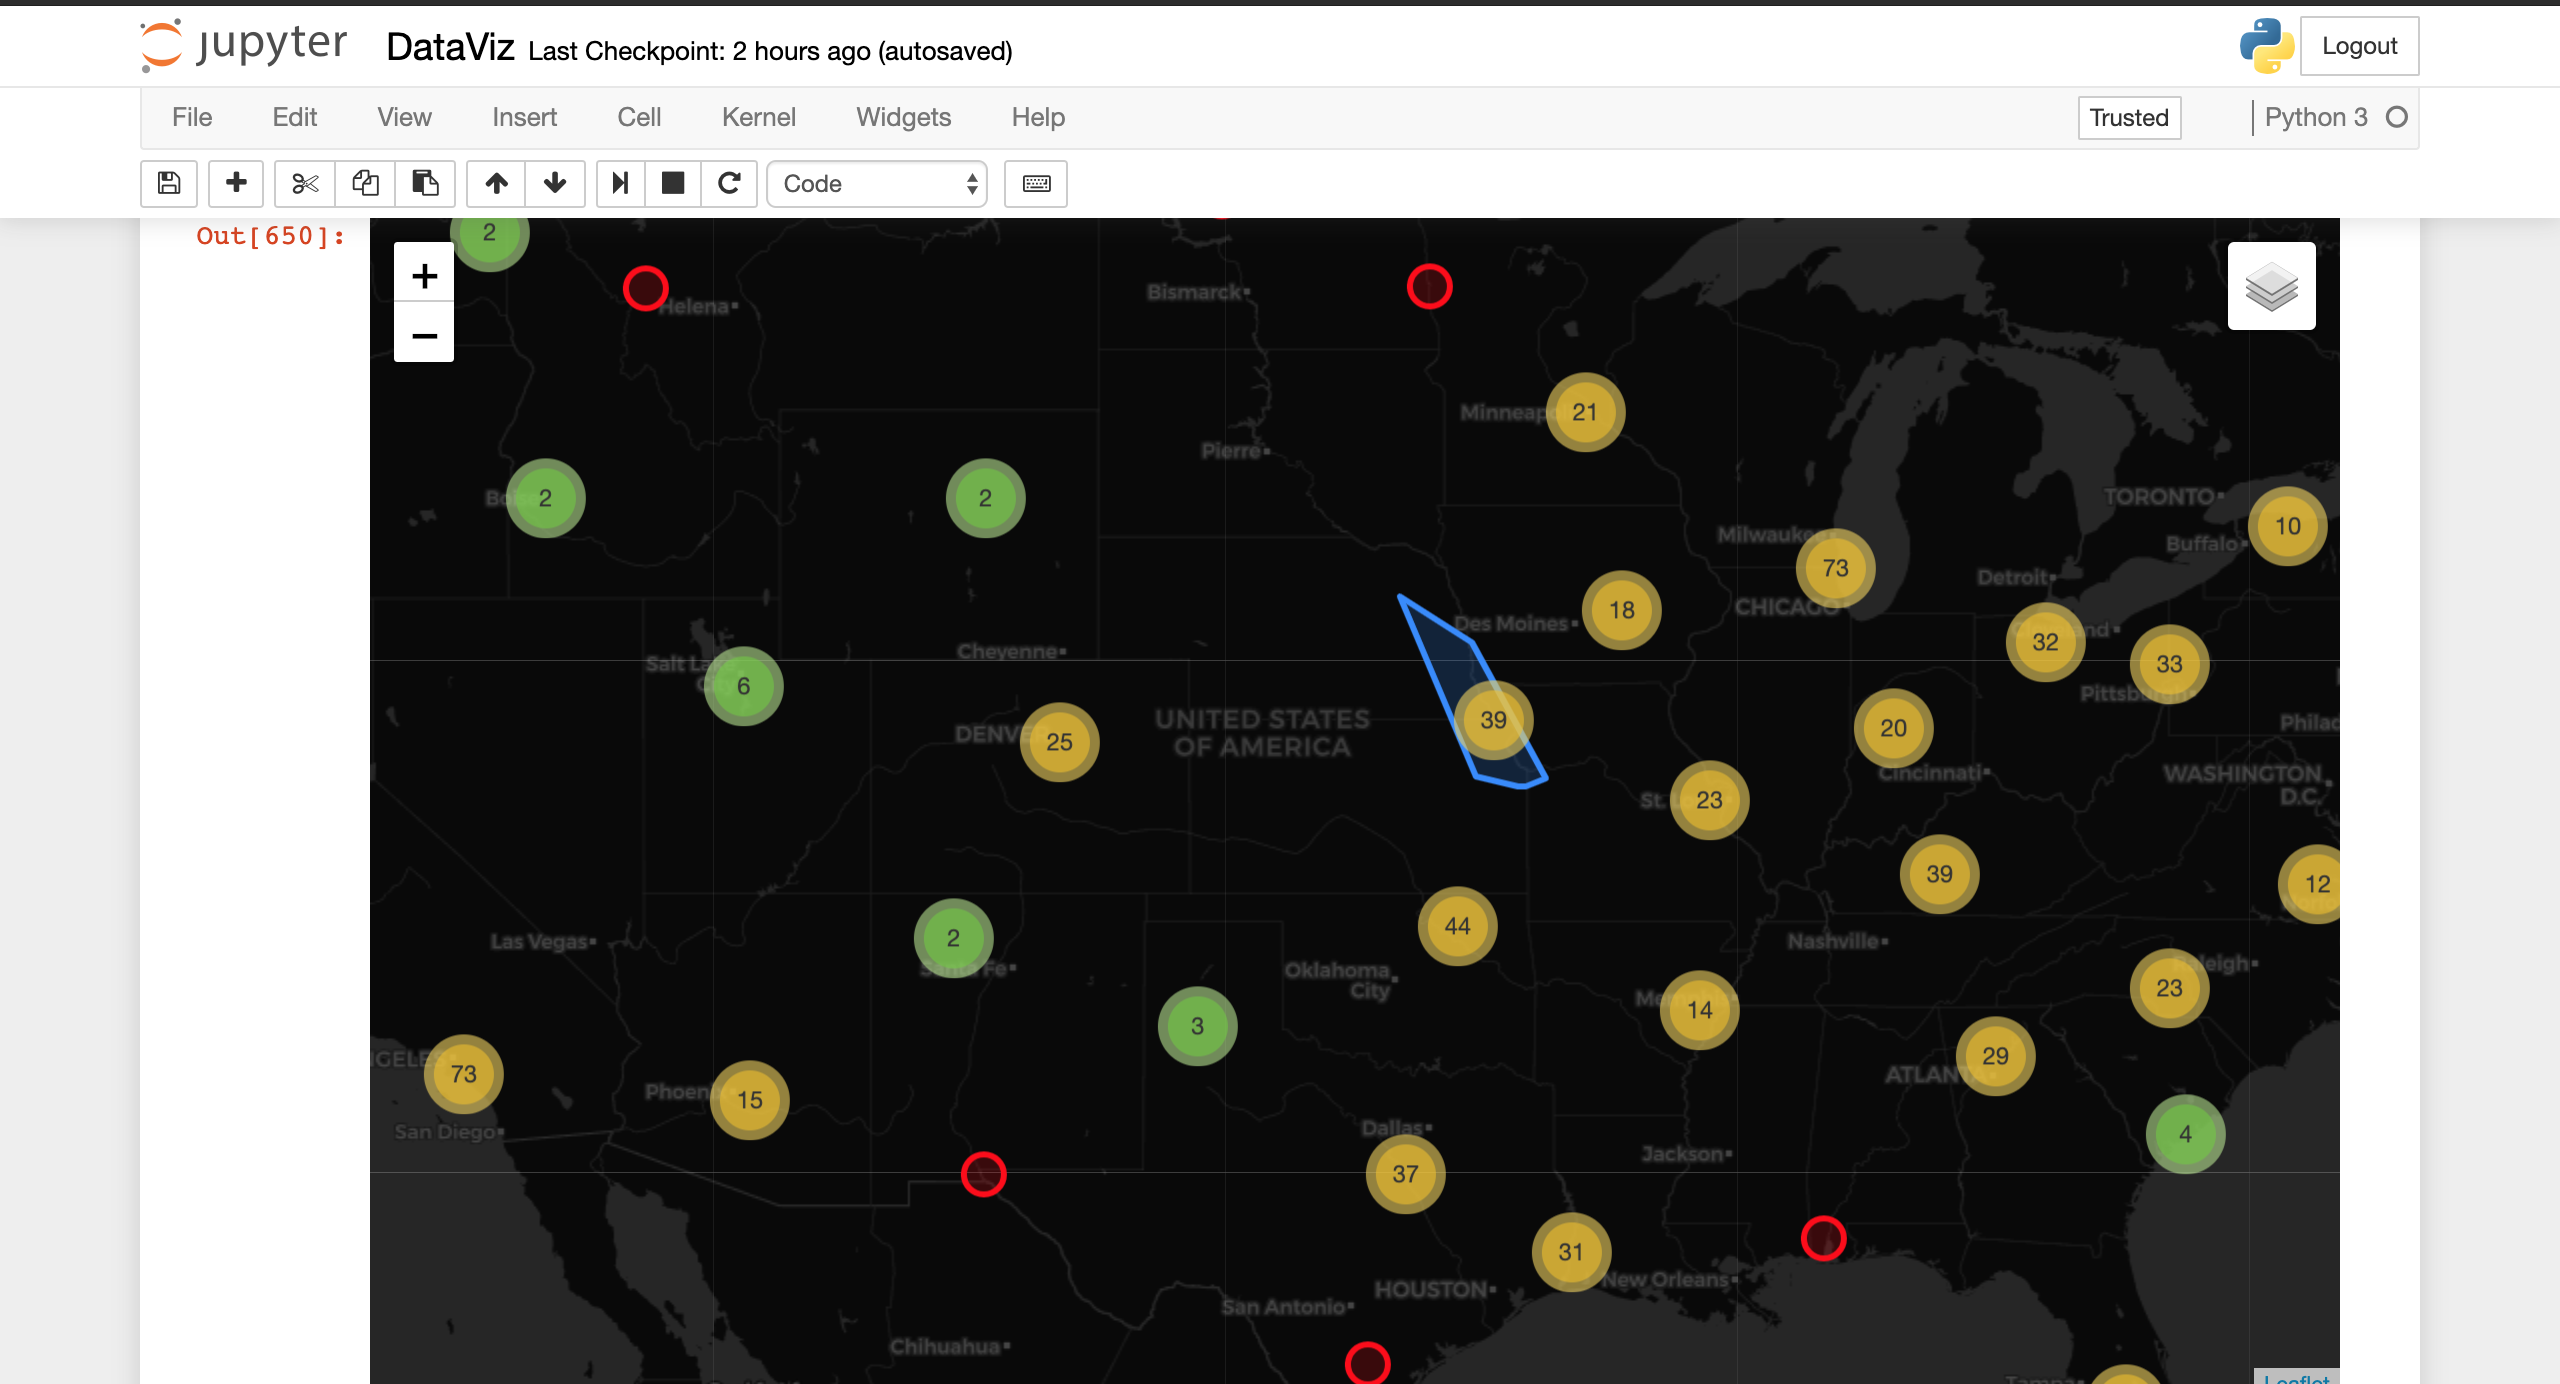
Graphical overview of United States
-
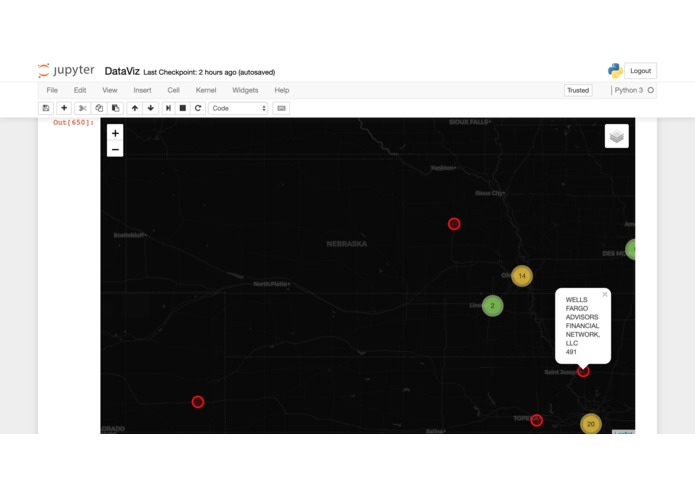
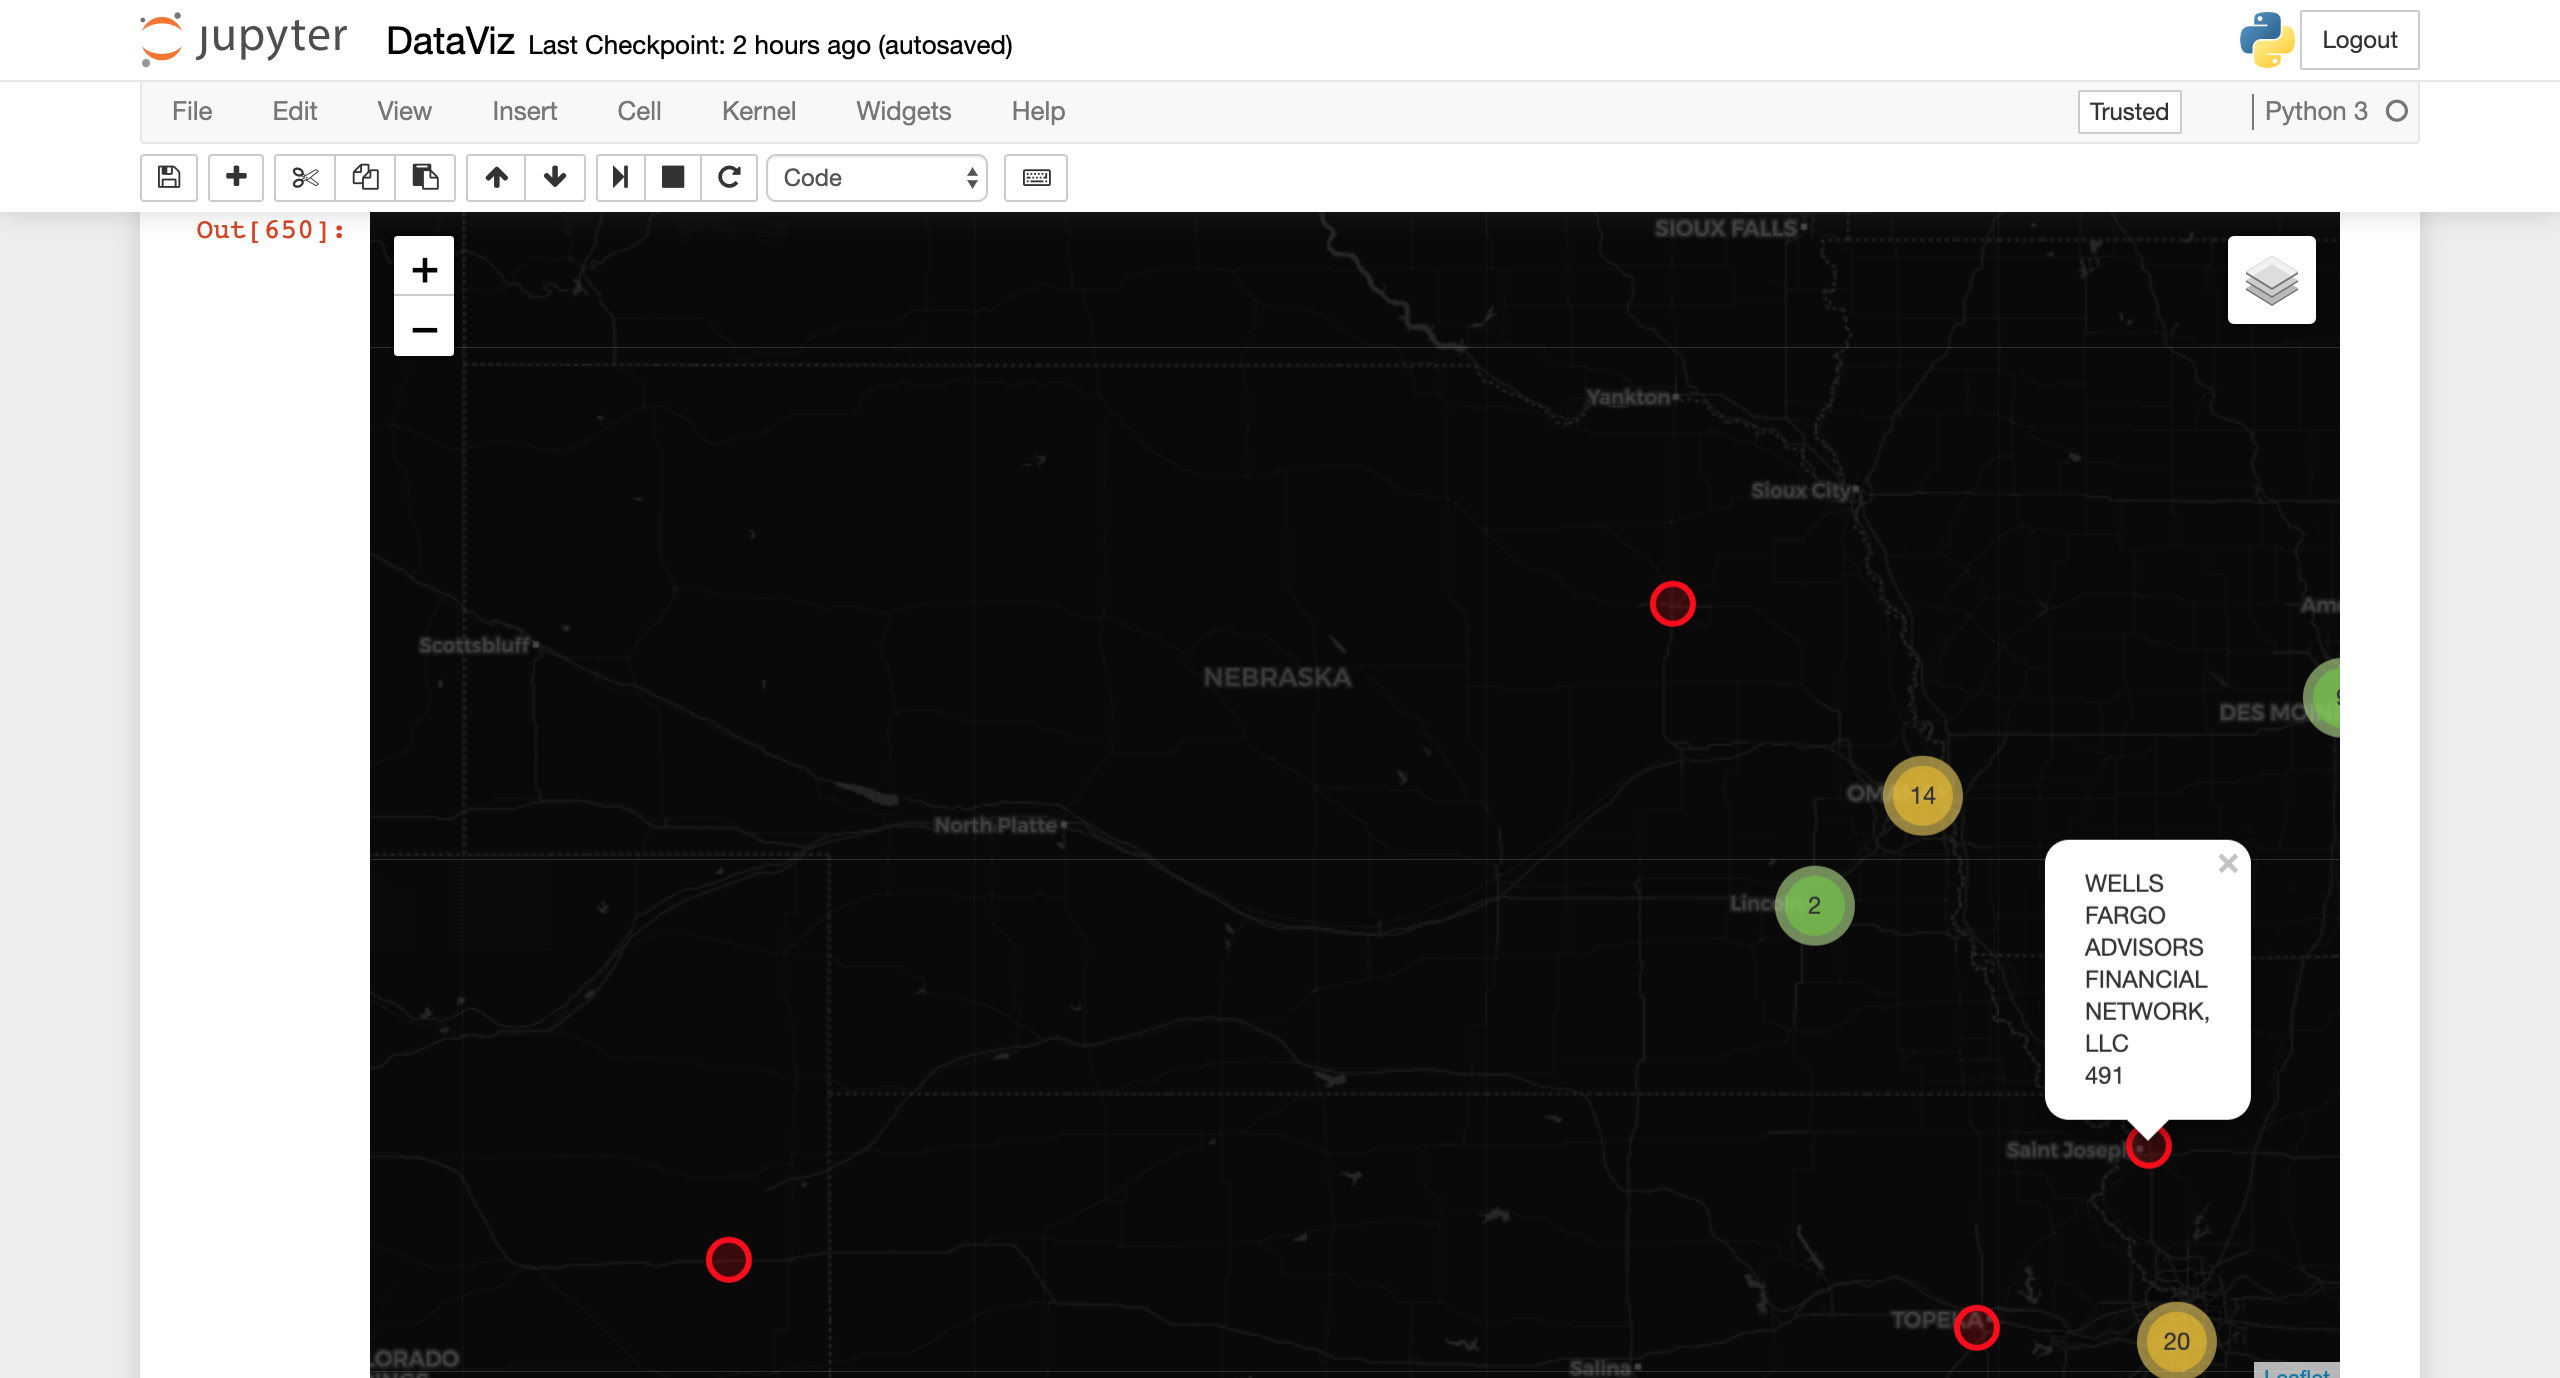
Graphical representation of Firms w/ Fraudulent employees
-
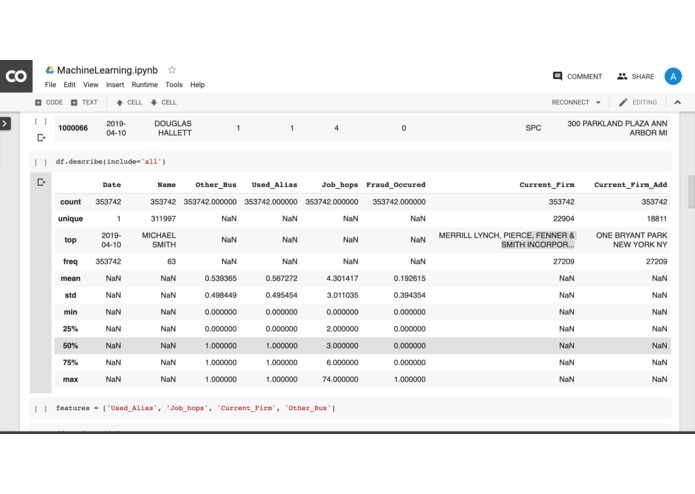
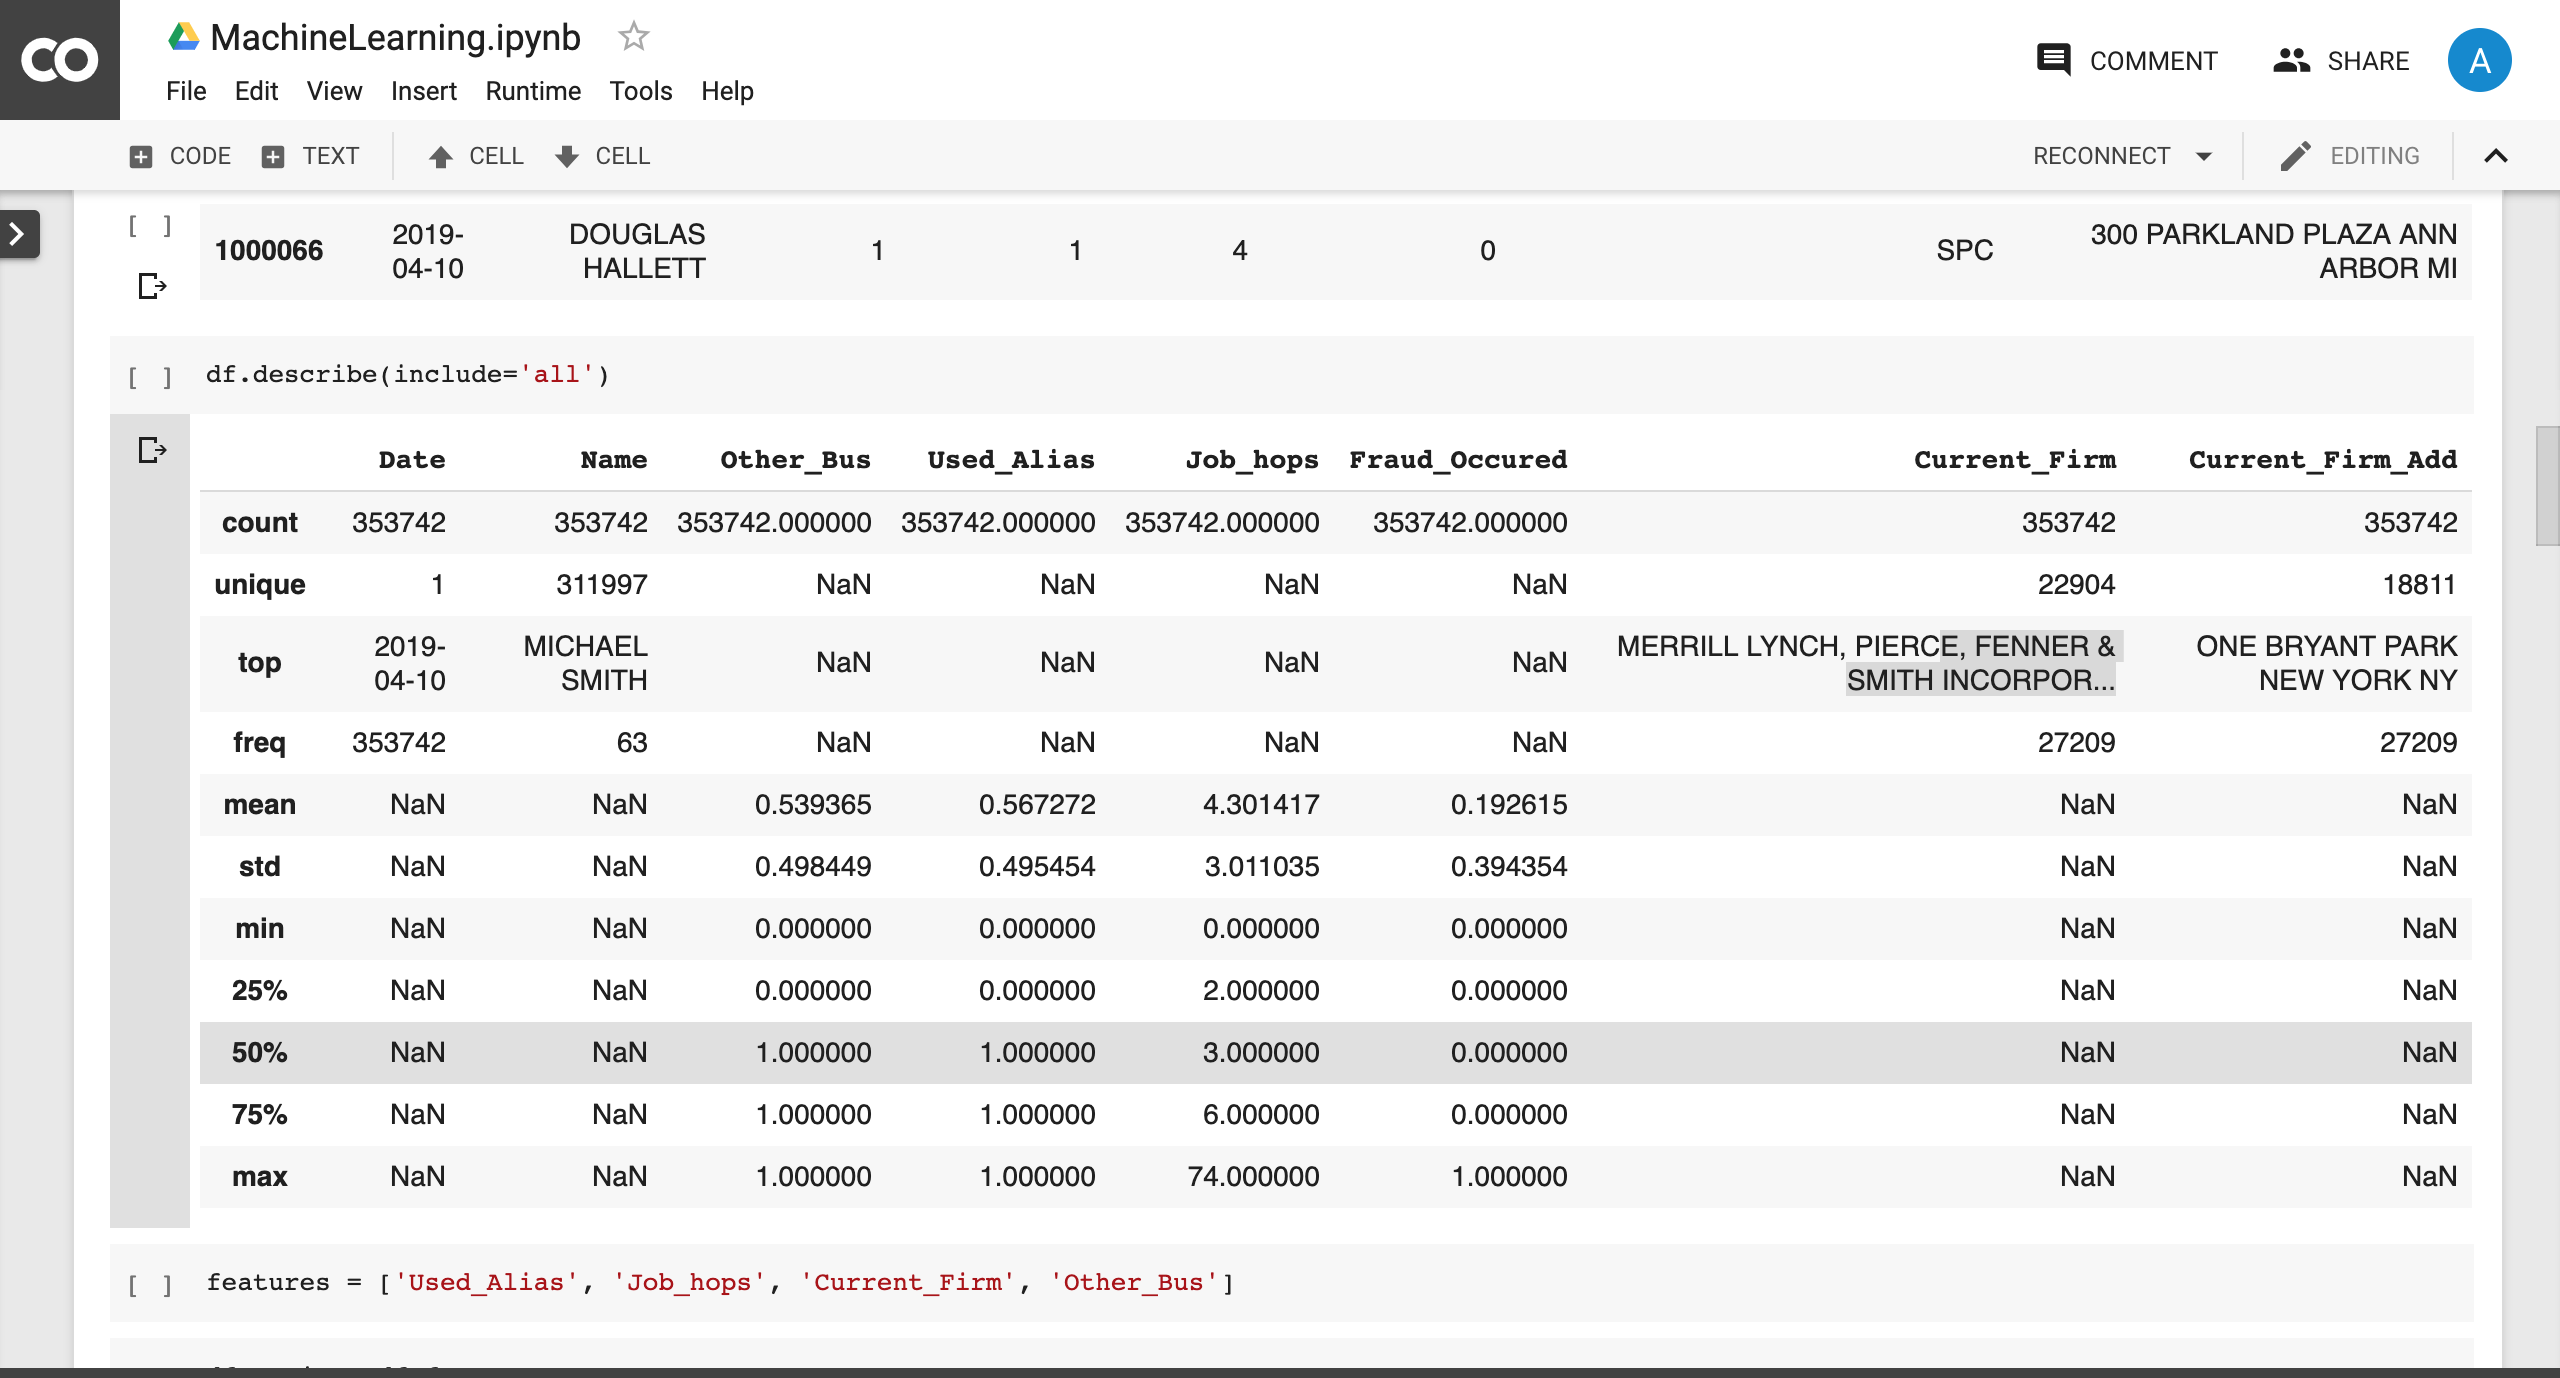
Statistical data analysis
Inspiration
The project started off with us trying to predict fraudulent brokers based on the given dataset. It later culminated into multiple Jupyter notebooks of scientific analysis and Data Visualization.
What it does
Provides Visualization of multiple firms throughout the United States and employes that have indulged in fraudulent activities in the past. Also provides statistical analysis of the Dataset provided by Finra.
How we built it
We parsed the given XML files using lxml parser in Python after reading through the documentation provided. We used pandas to convert the xml files to Dataframes. We extracted the key features that we deemed necessary and performed feature engineering. We used the Google cloud api to get the geocodes for the locations of the firm and we used the folium api to represent the derived firm locations on the map. We also used Google collab to perform machine learning(Deep Neural nets) since they provided an online GPU.
Challenges we ran into
We planned on delivering a front end dashboard to represent better UI experience to the users, but could not deliver.
Accomplishments that we're proud of
It was a learning process, we were able to deliver some beautiful visualizations, implemented and successfully ran a machine learning algorithm on the dataset the we feature engineered, established cloud connection with Google credits provided.
What we learned
The workflow of performing data analysis and exploring huge datasets, also we learned a lot about the Financial industry through the Finra dataset and website.
What's next for BitCamp2019_FDA
We are going to complete the UI, incorporate a bigger dataset that we are currently scraping so that we have features to run the deep learning algorithms on.
Built With
- google-drive-api
- google-maps
- jupyter
- keras
- matplotlib
- pandas
- python


Log in or sign up for Devpost to join the conversation.