Wearables collect an enormous amount of health data, but most people are still left staring at disconnected numbers: heart rate, HRV, sleep stages, stress, respiration, and Body Battery.
The problem is not a lack of data. It is a lack of understanding.
We built bioTwin to close that gap. Instead of creating another dashboard that simply reports what a watch measured, we wanted to build a physiological digital twin that learns one person's patterns, forecasts their near-term recovery, and explains what the data means through natural conversation.
Your watch tells you what happened. BioTwin tells you what it means.
What it does
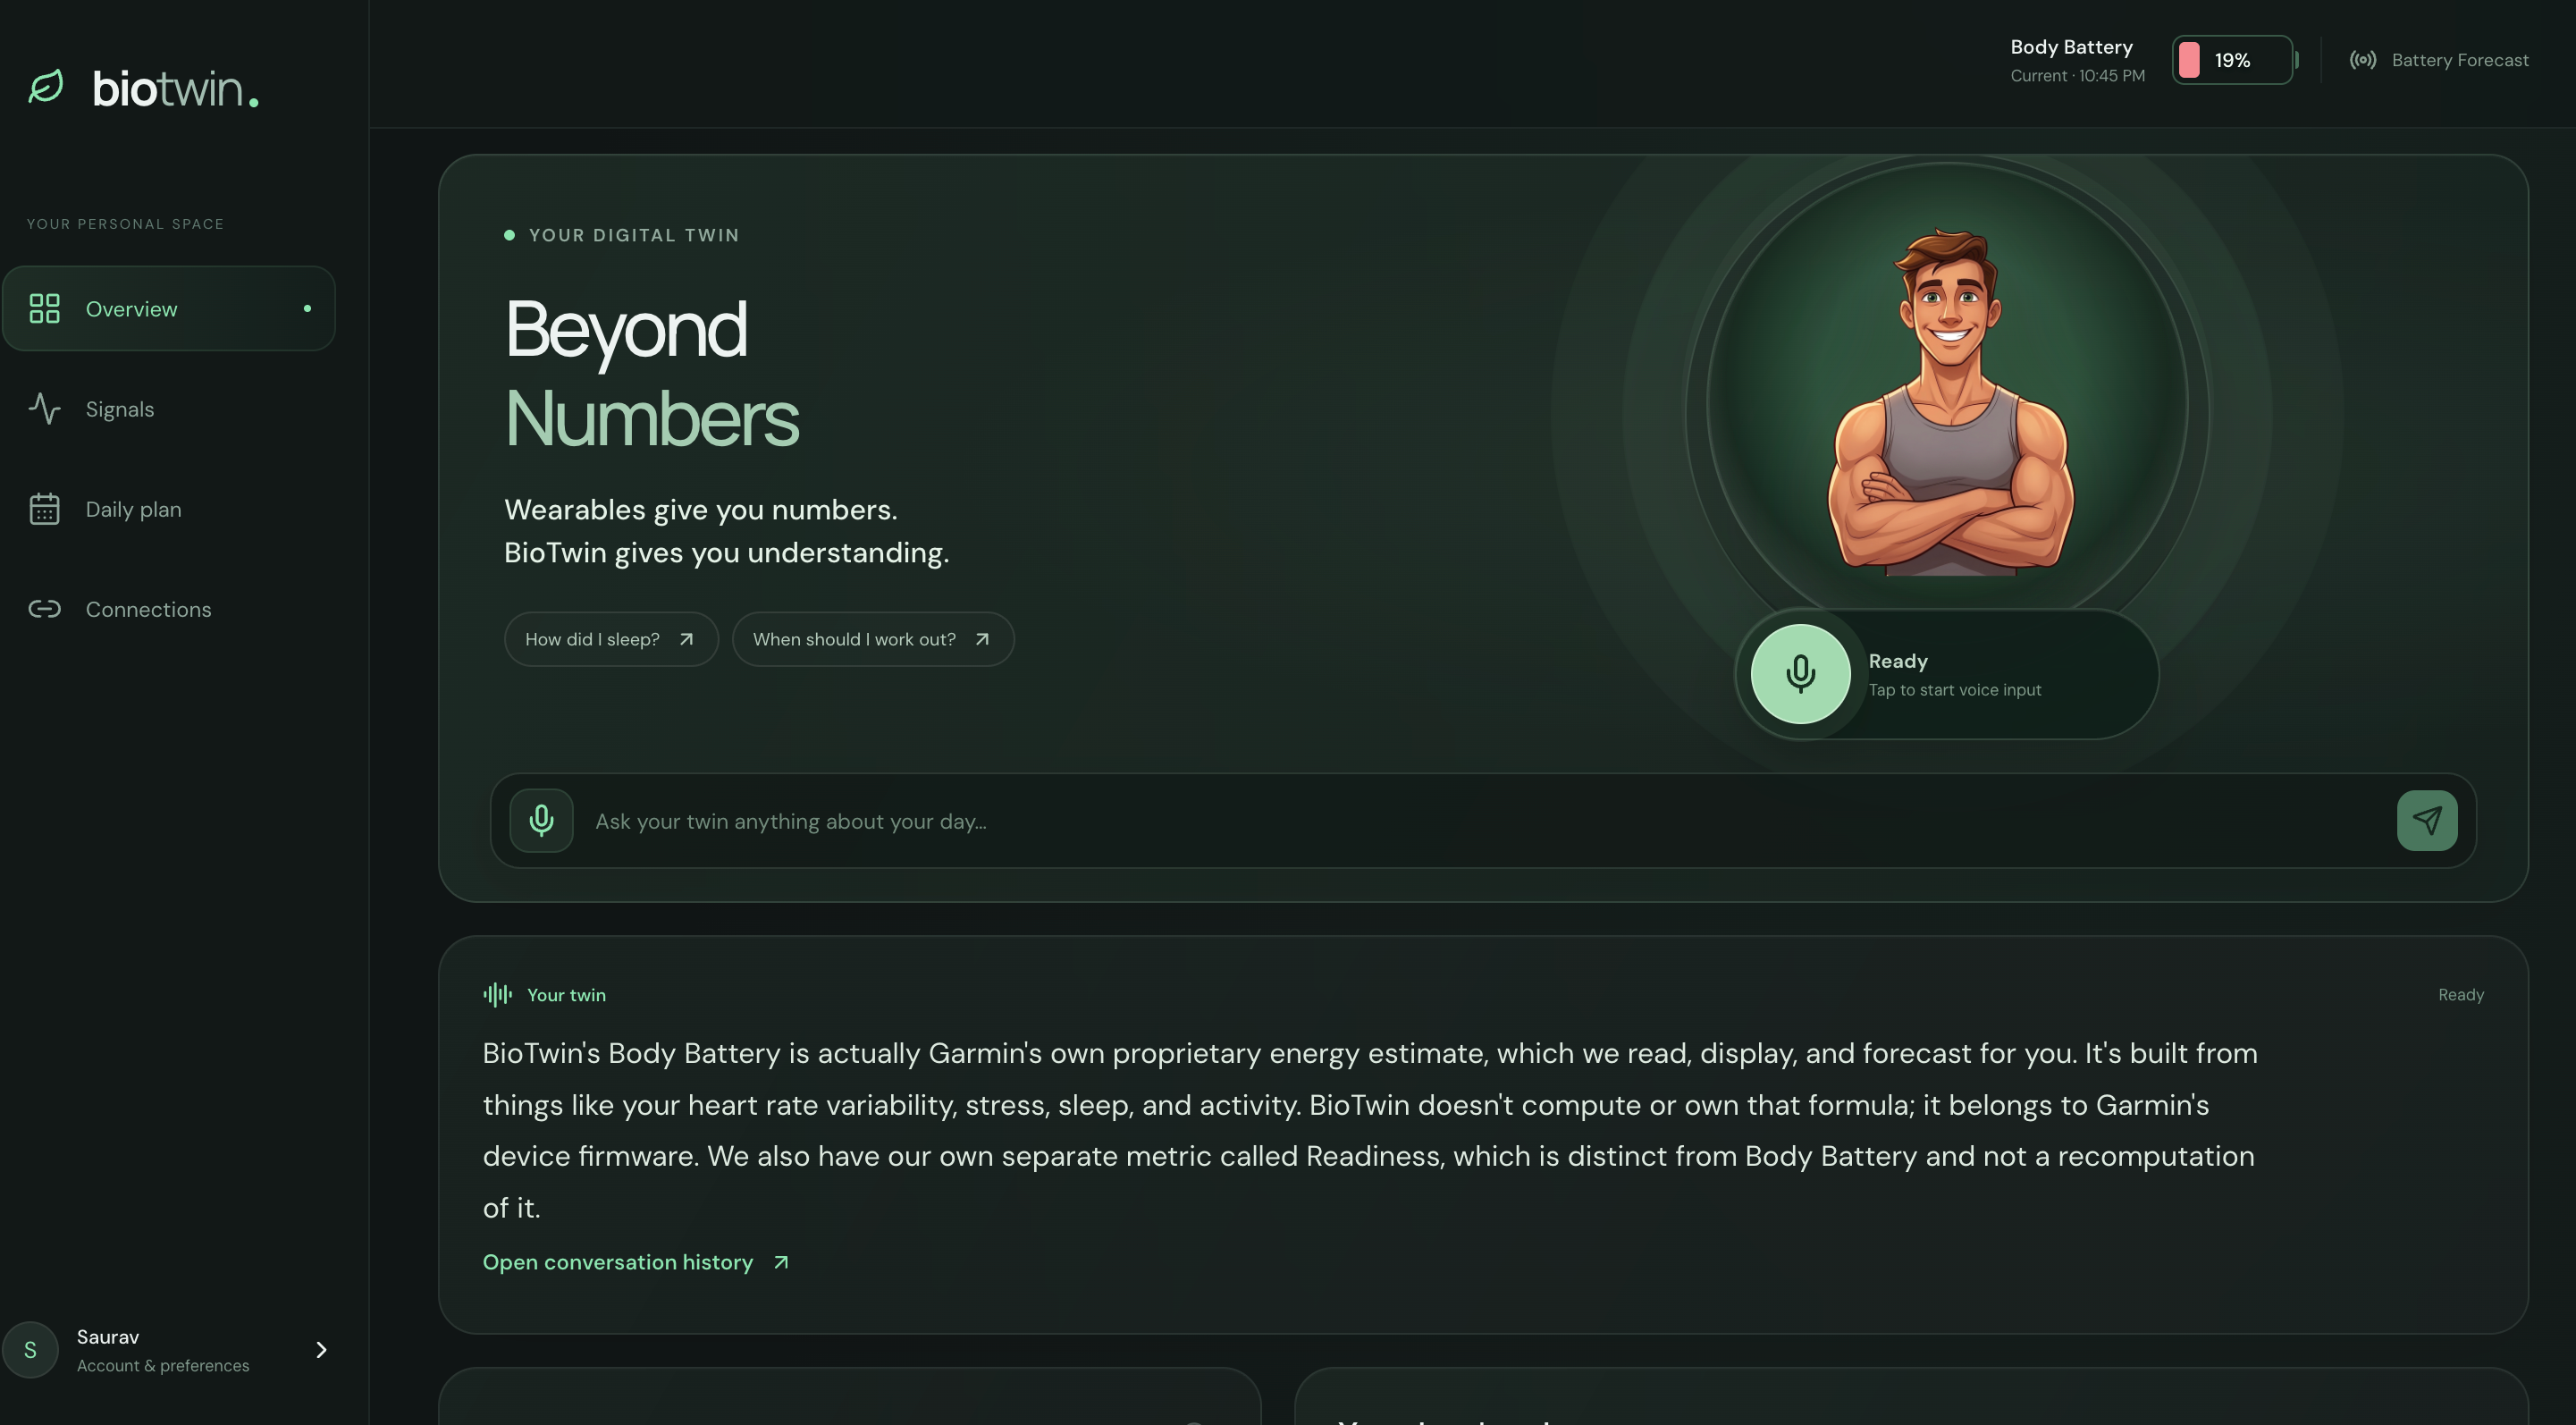
BioTwin transforms wearable measurements into an interactive, voice-enabled 3D representation of the user.
It can:
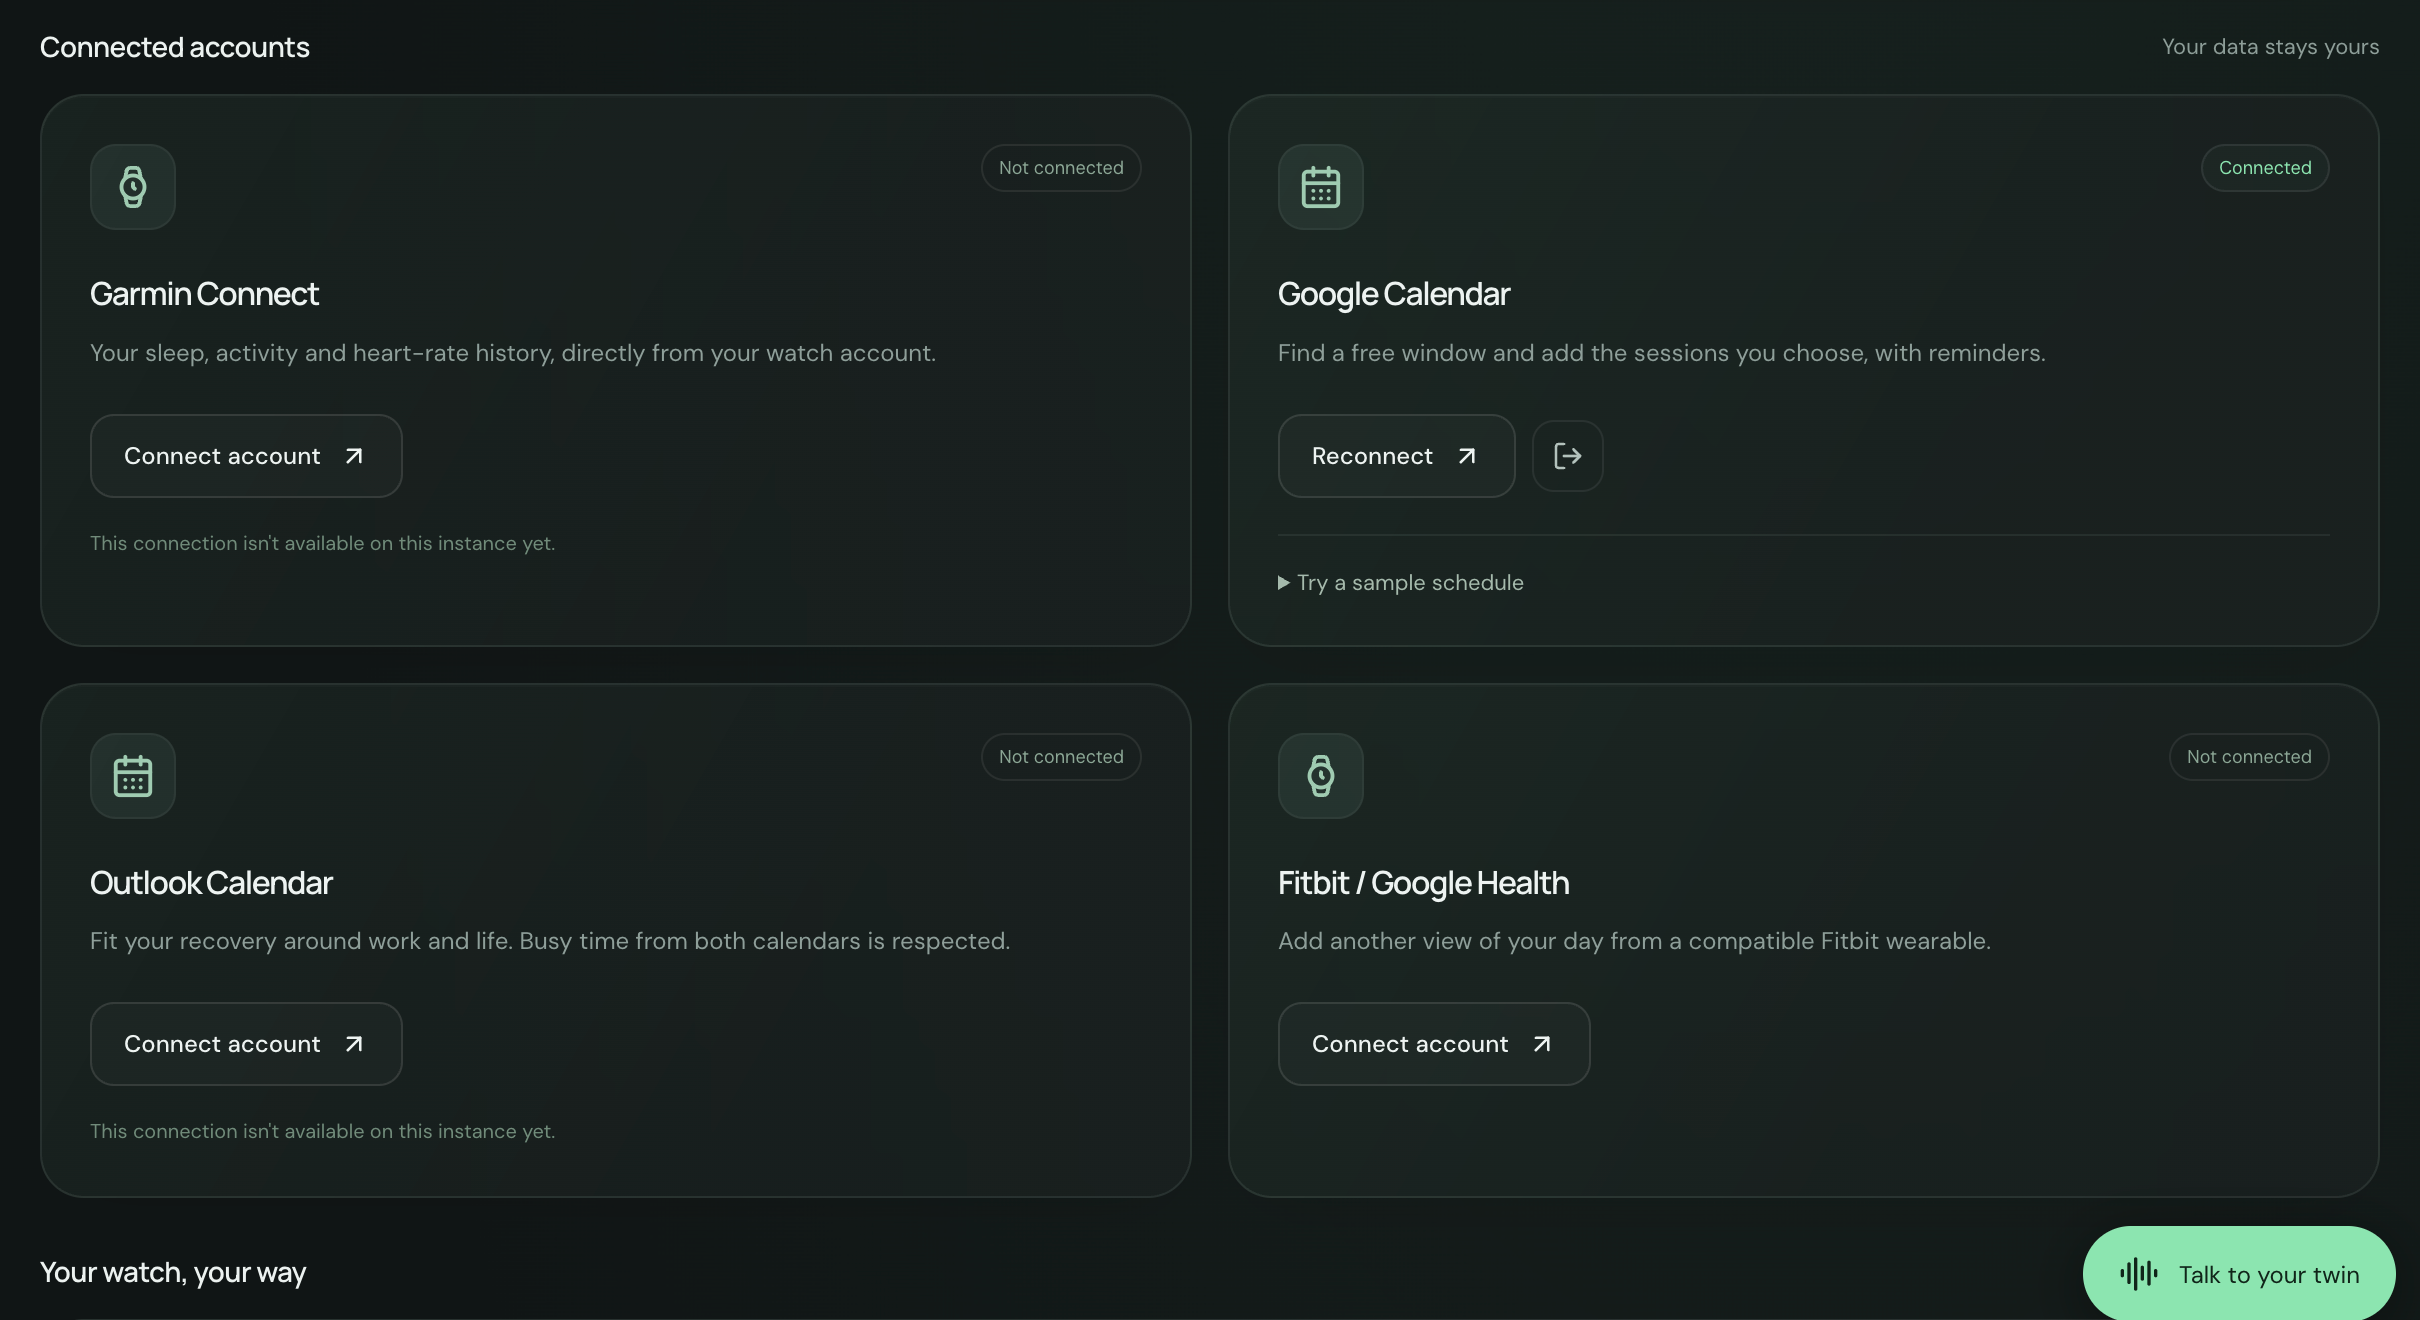
- Import Garmin FIT and supported health-data exports
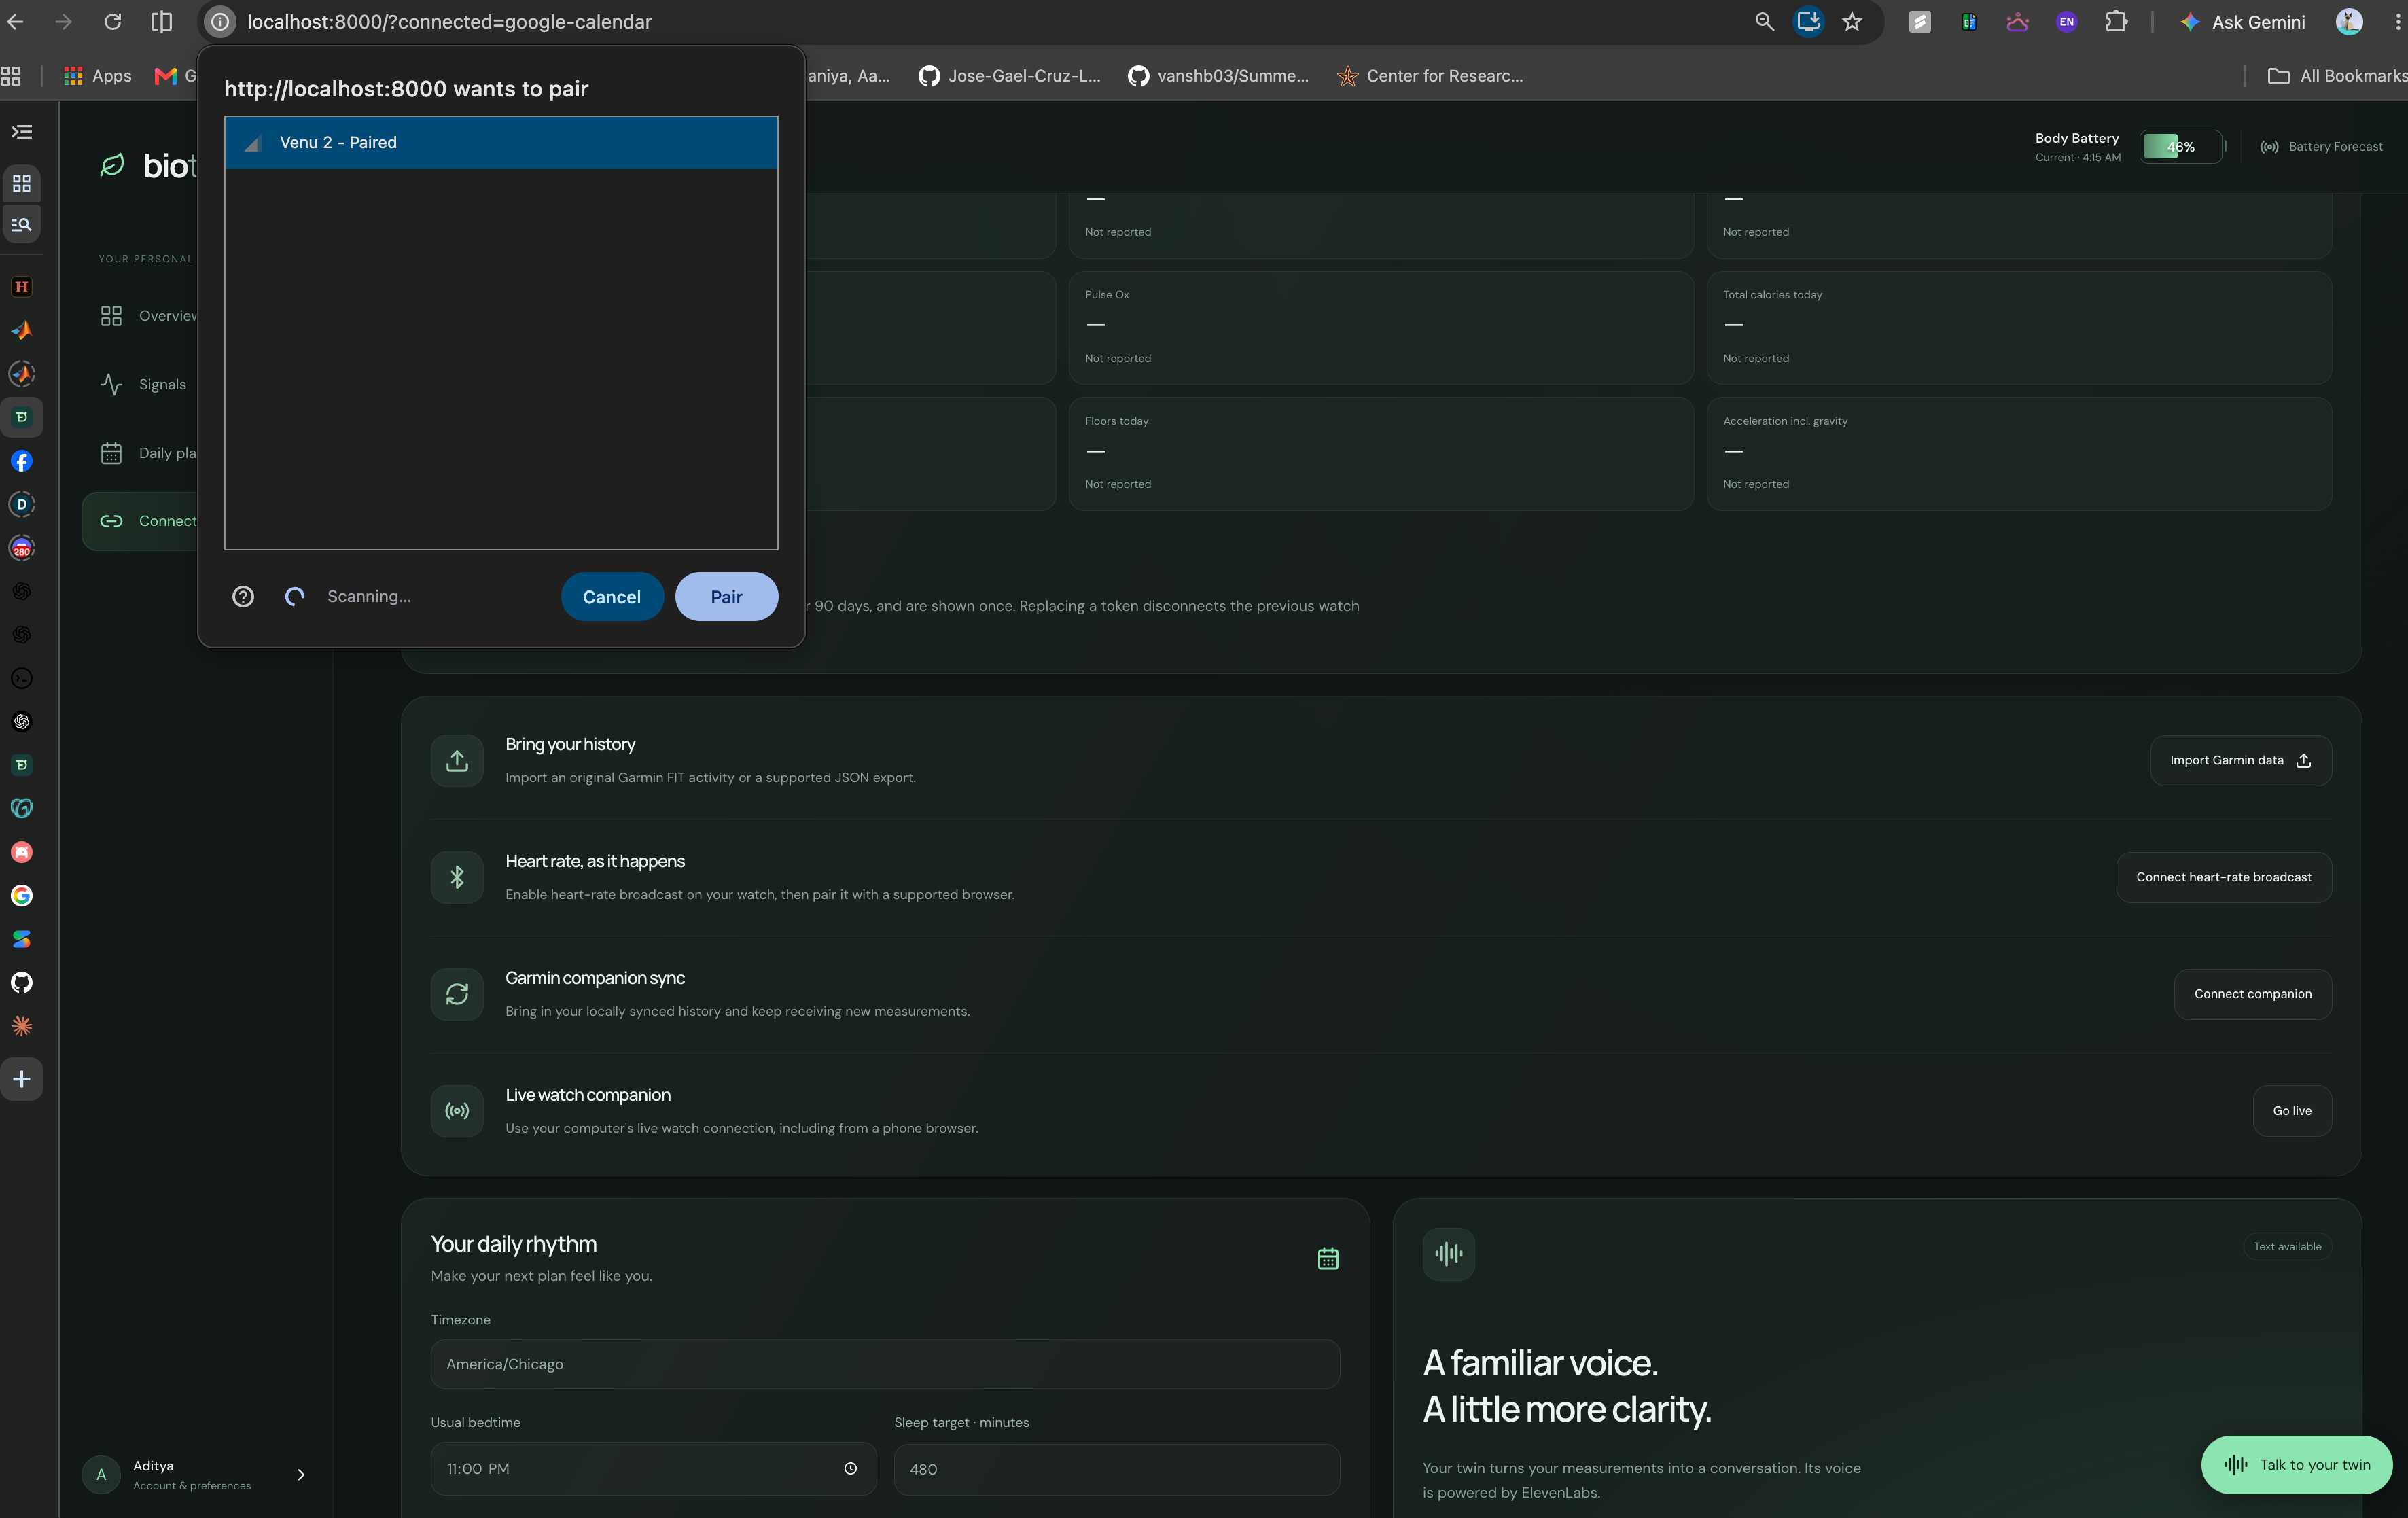
- Receive supported live heart-rate broadcasts over Bluetooth
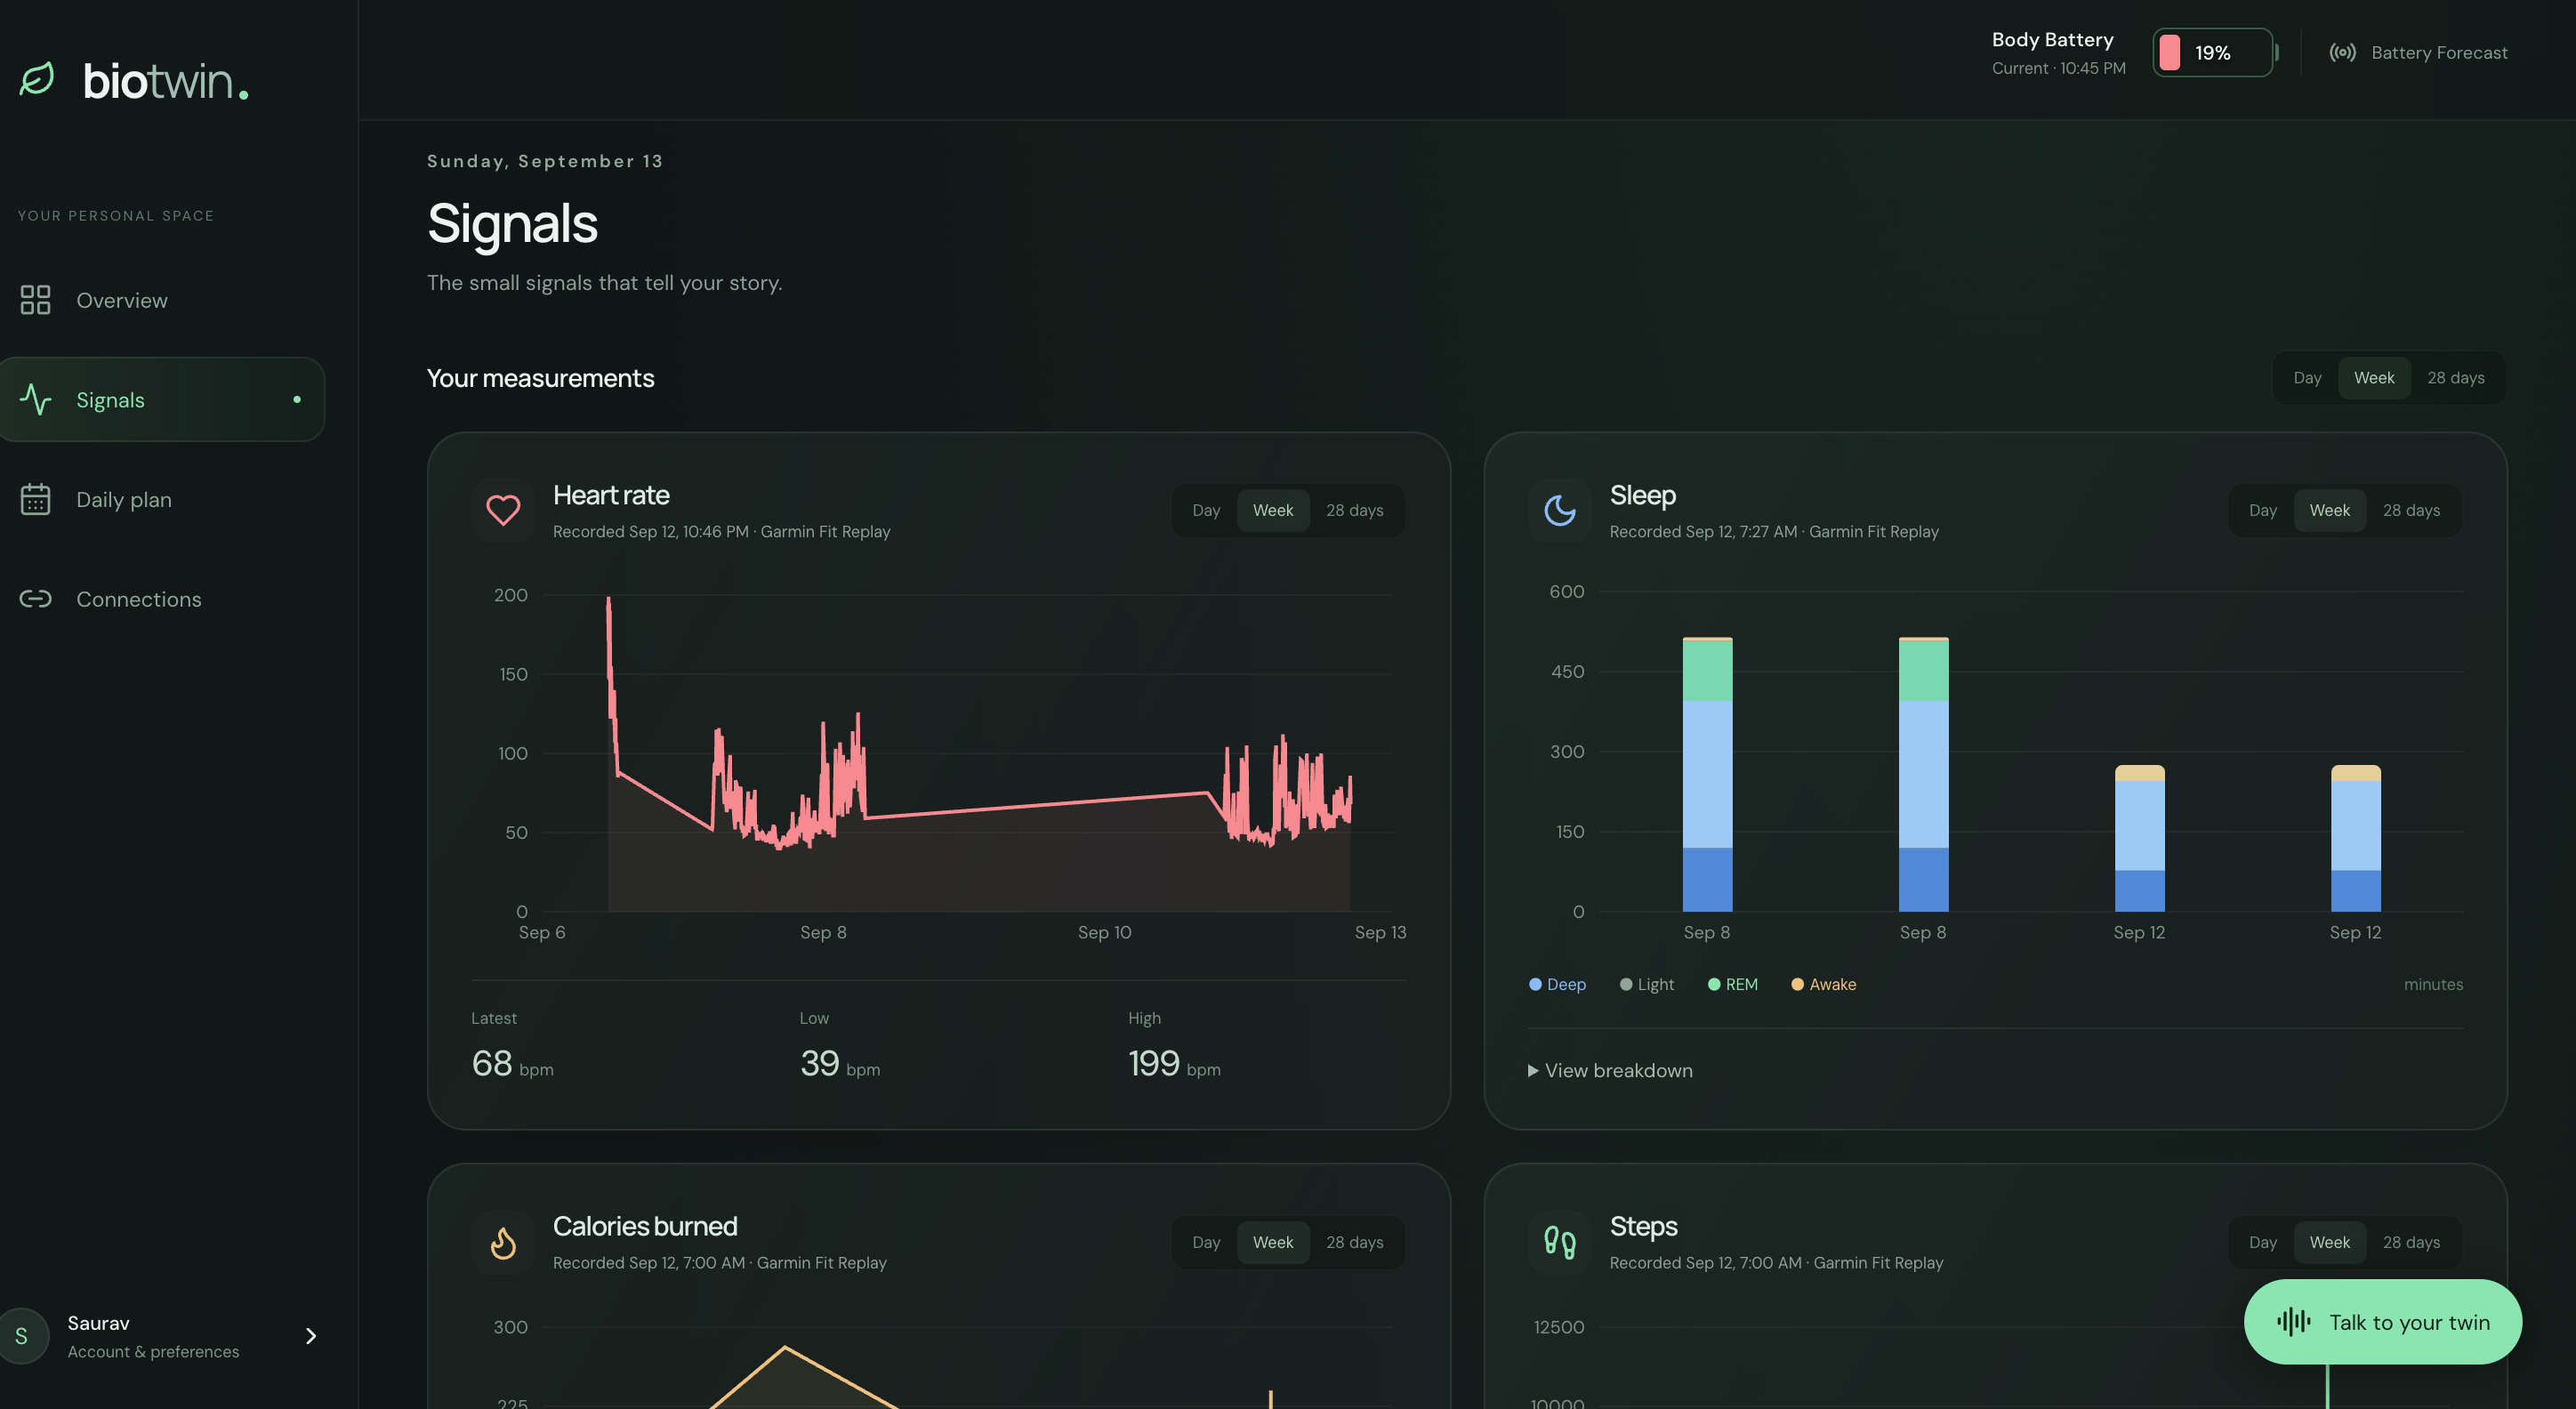
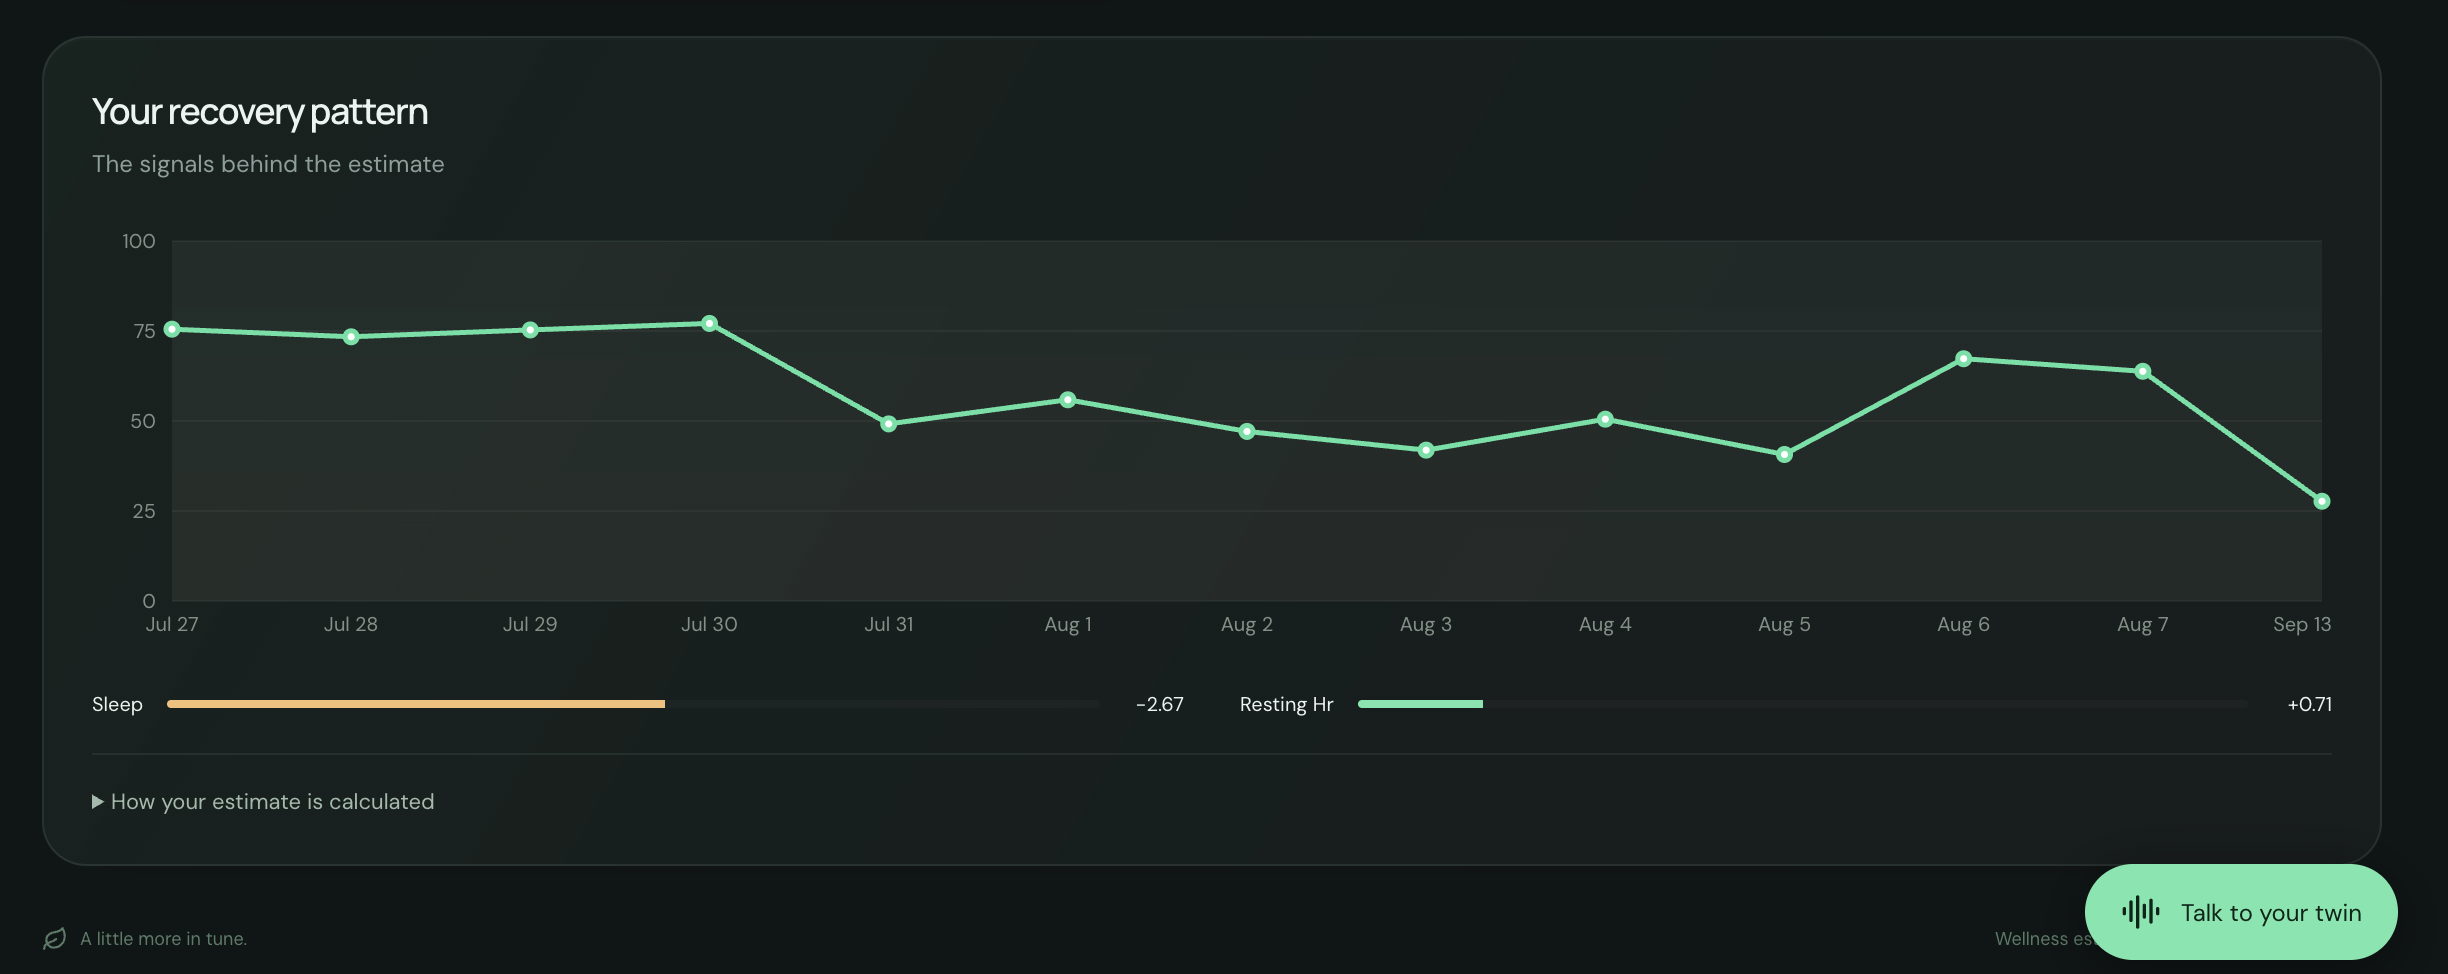
- Visualize heart rate, HRV, sleep, respiration, activity, and recovery
- Learn a personalized baseline instead of relying only on population averages
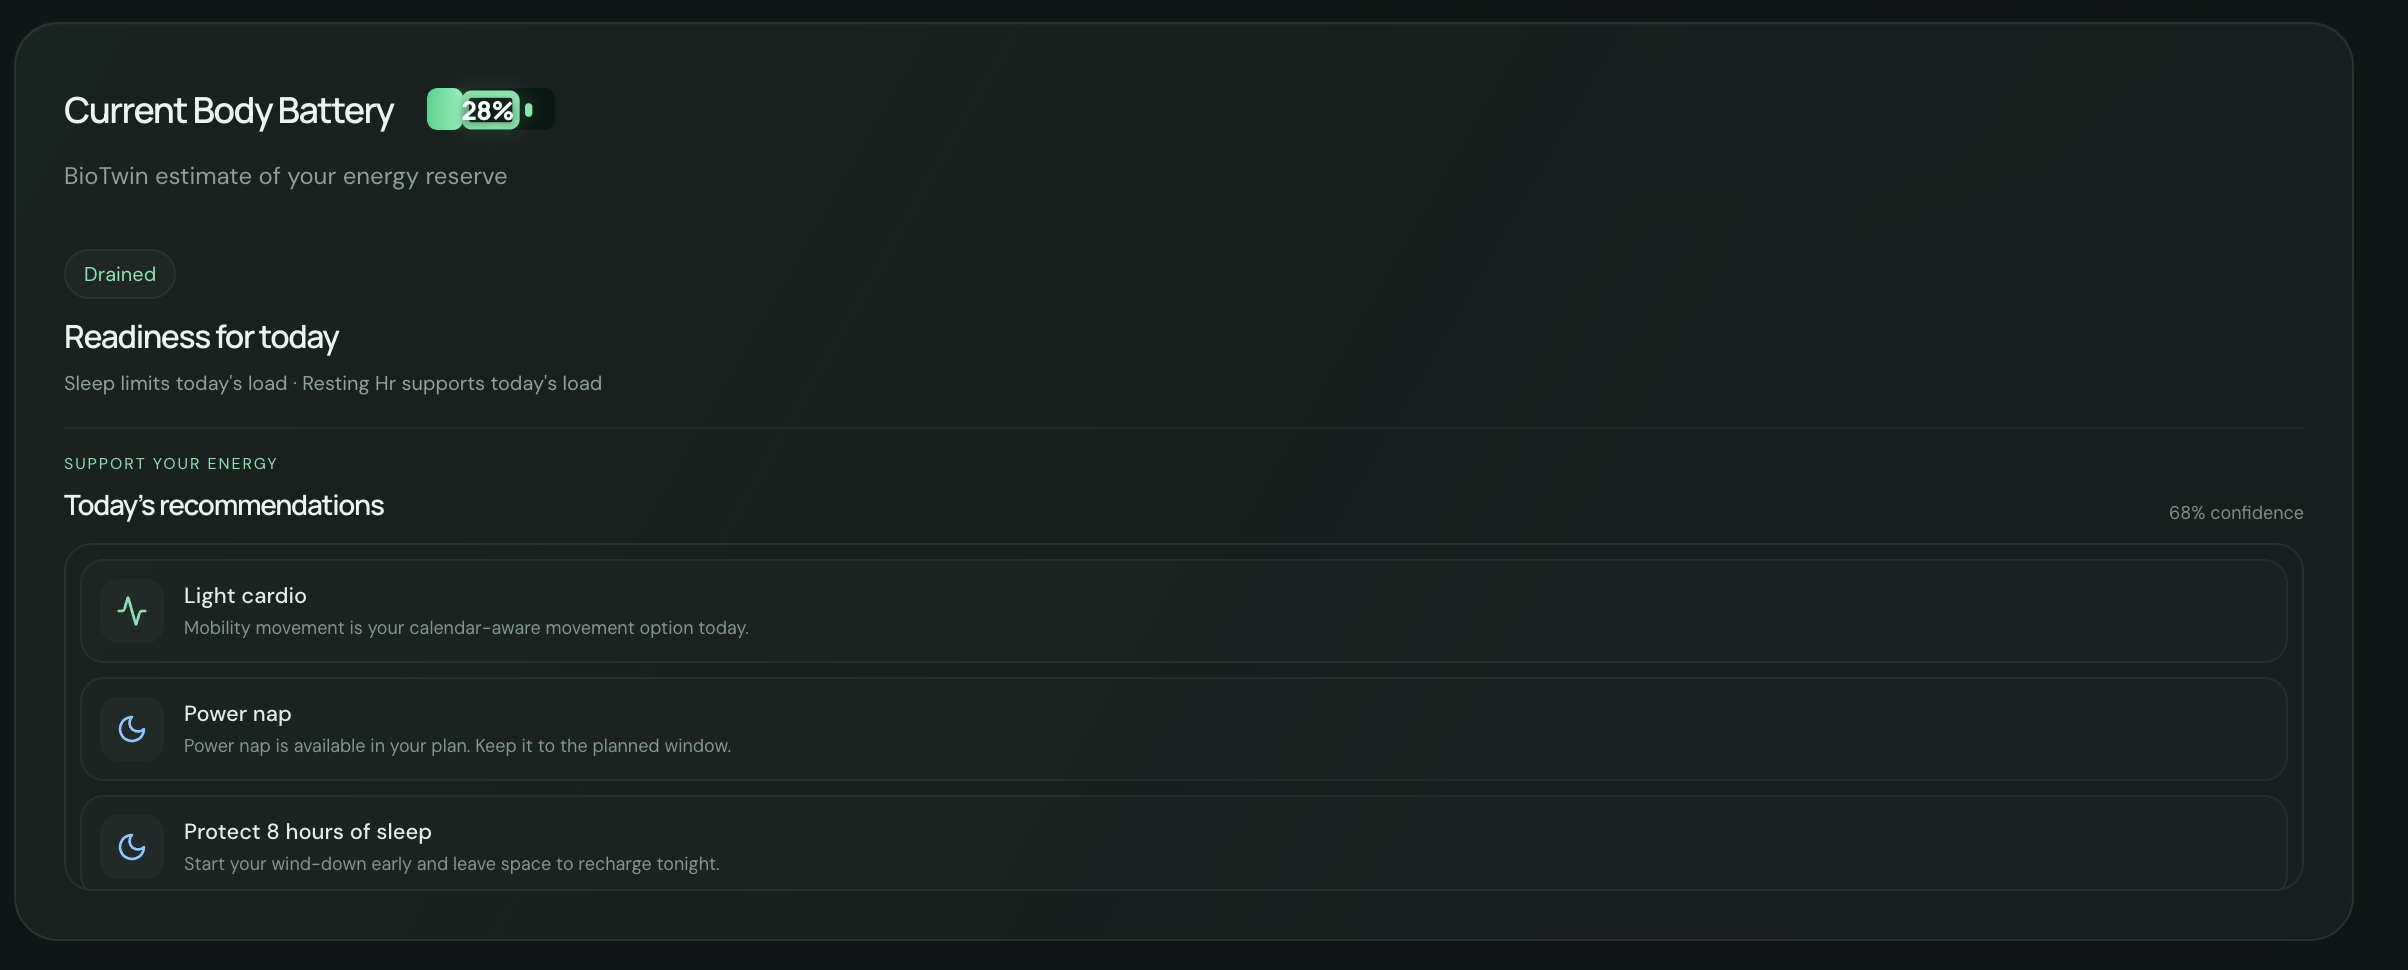
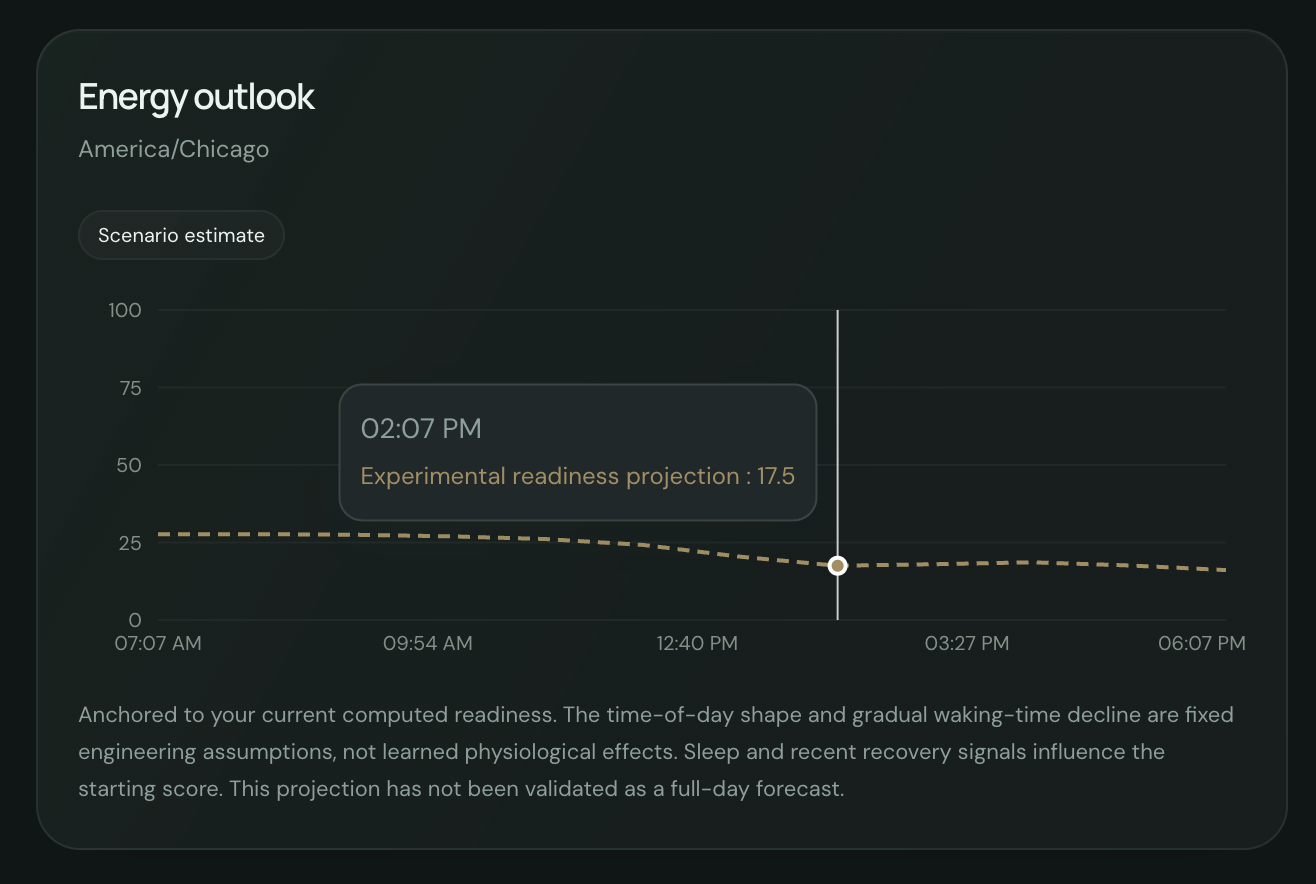
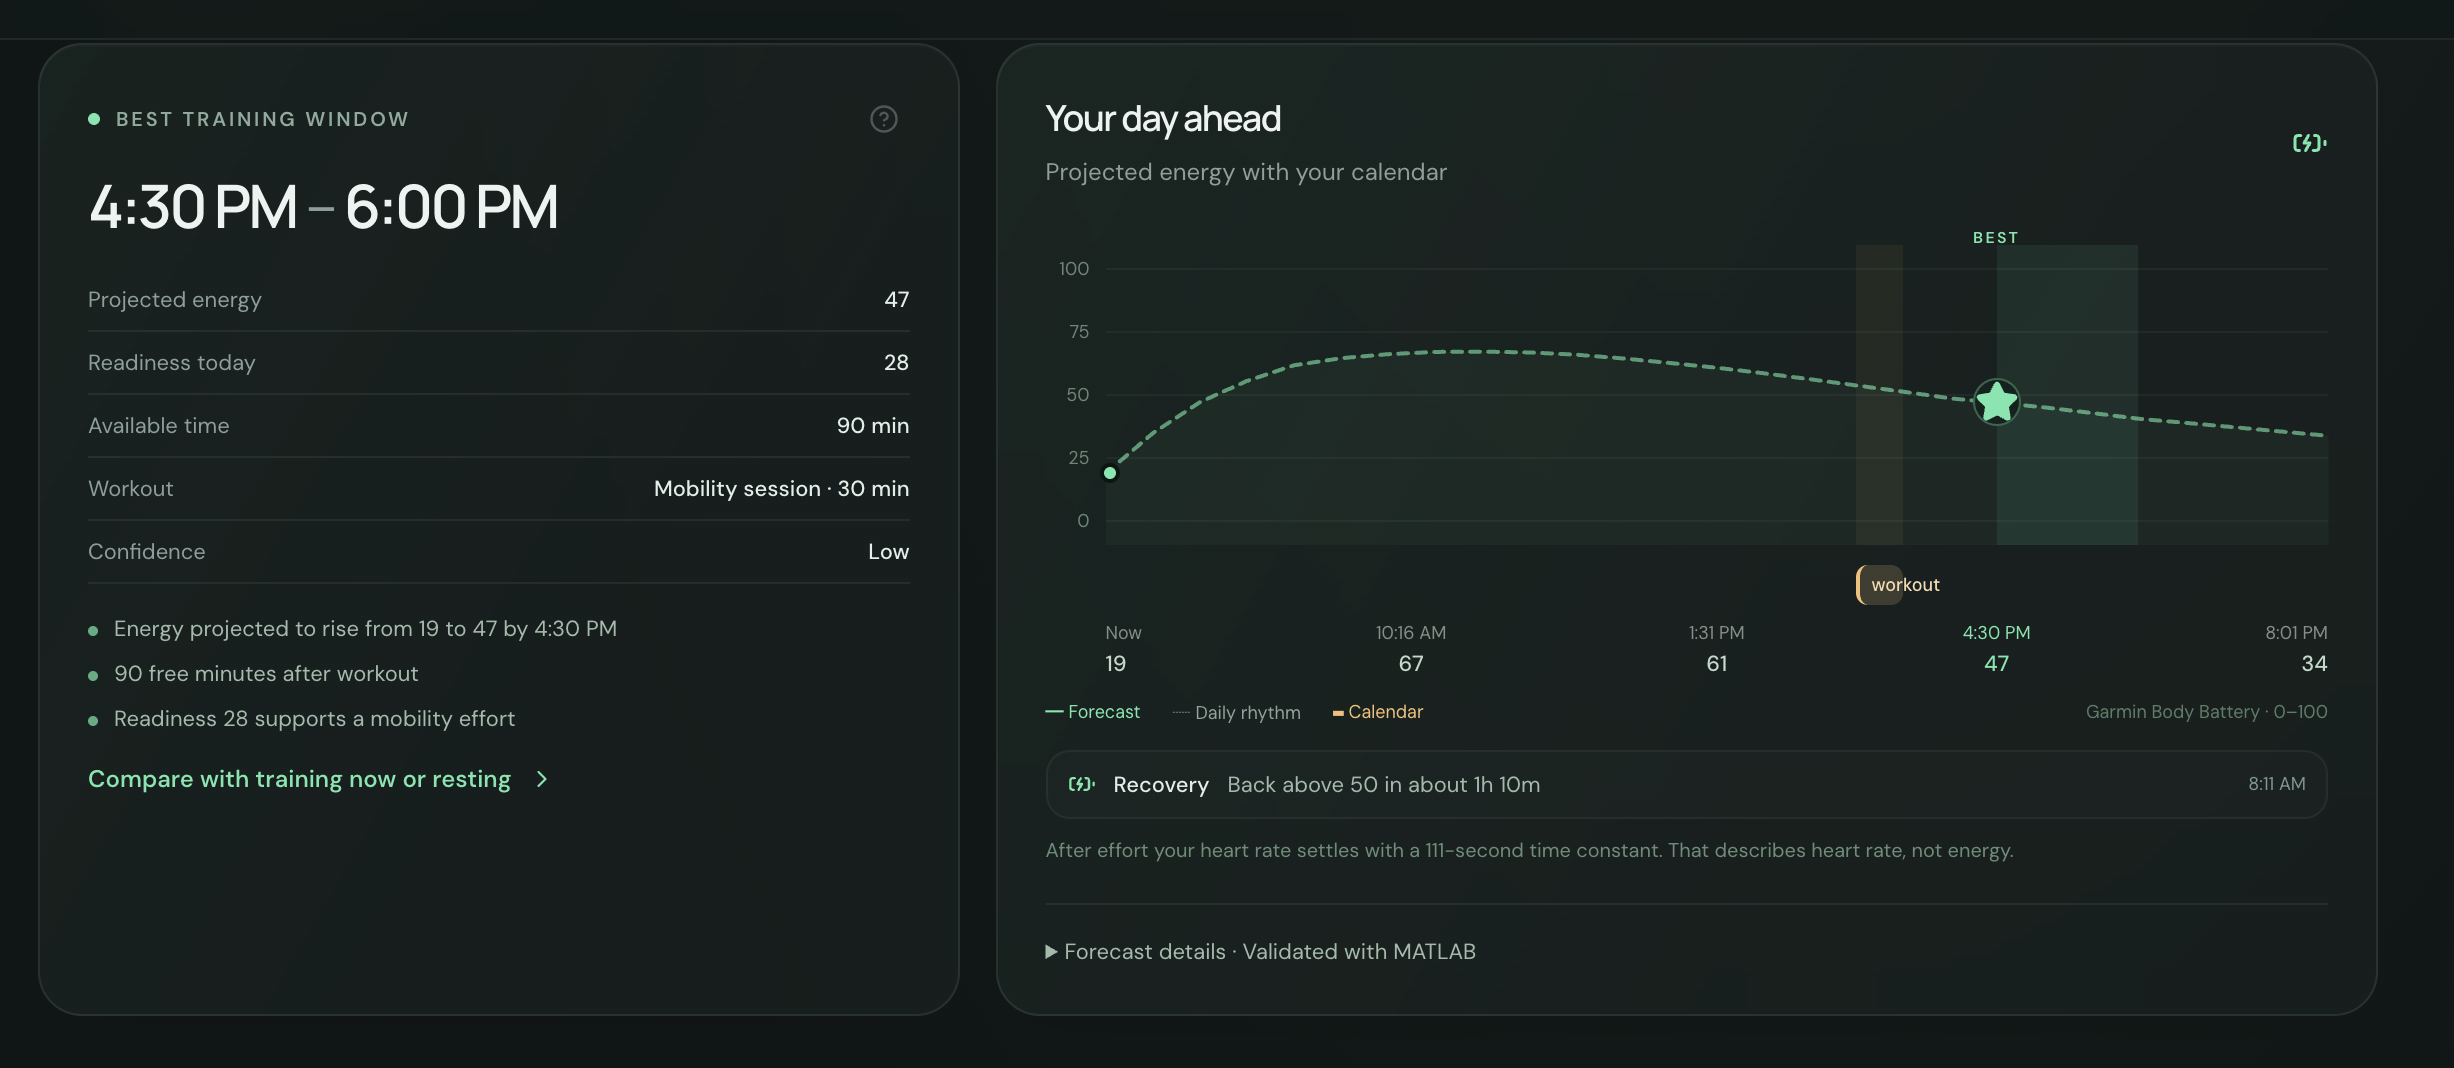
- Forecast Garmin Body Battery at multiple time horizons
- Fit a personalized heart-rate recovery curve after activity
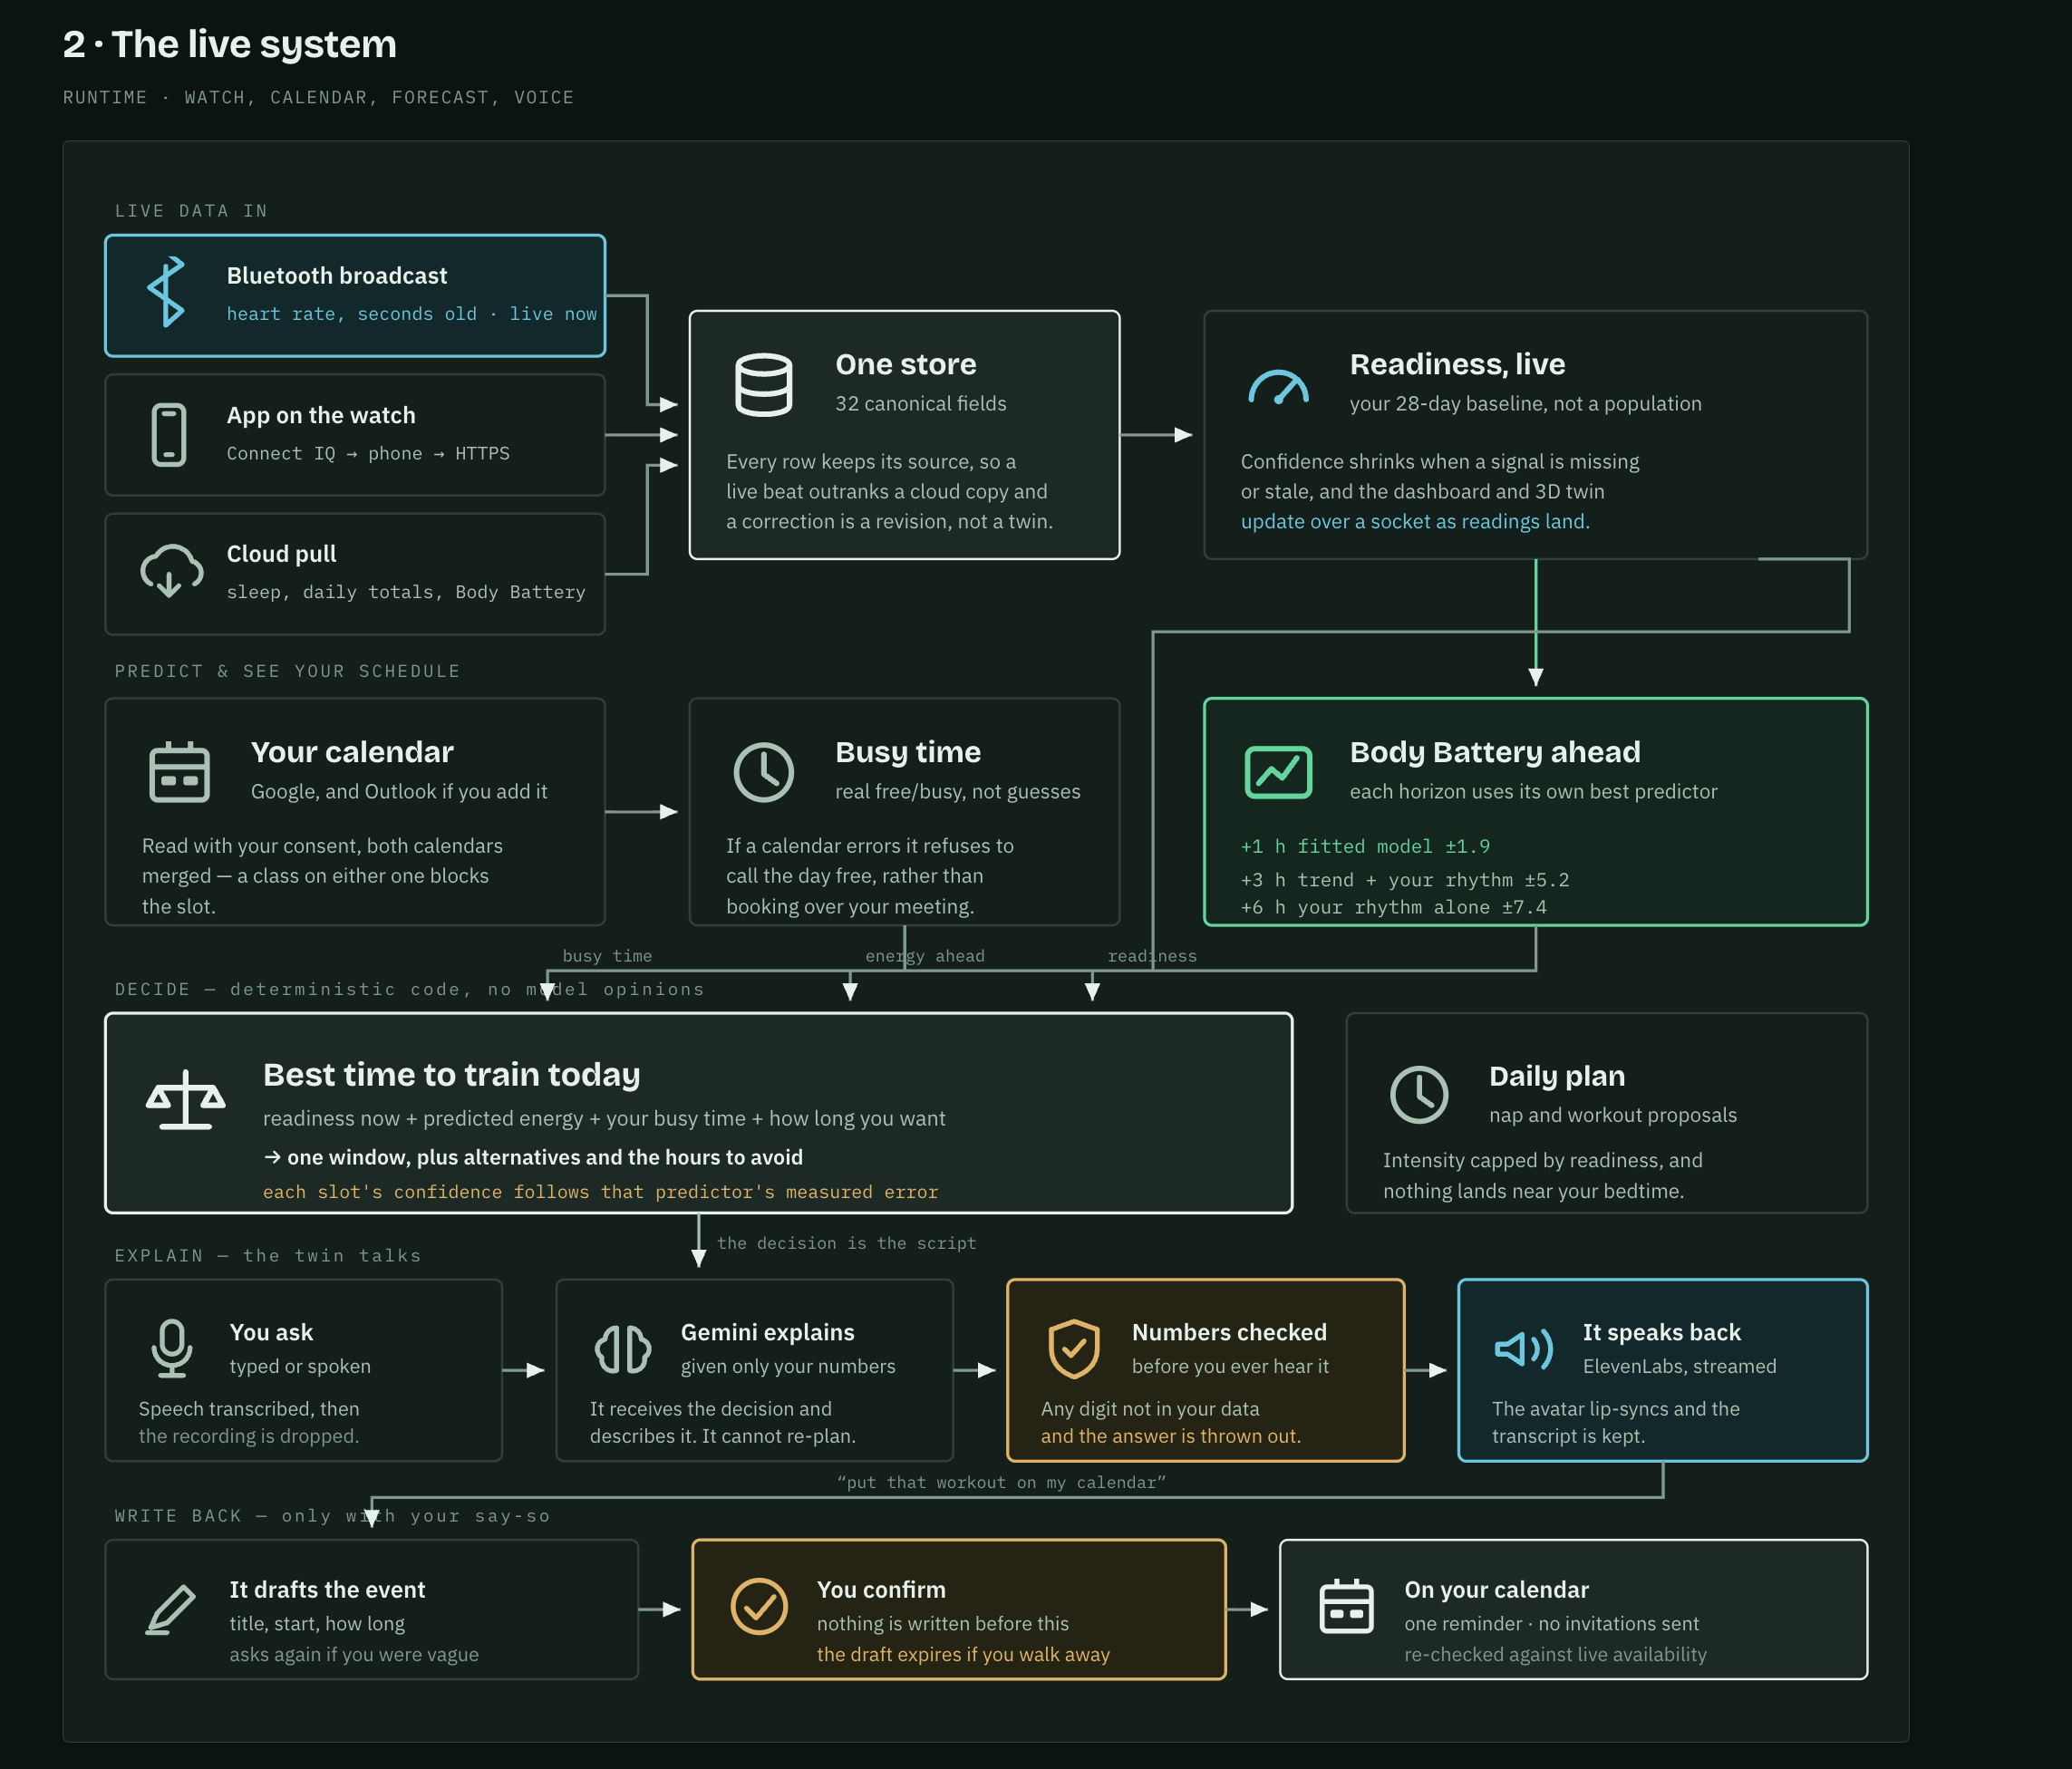
- Answer spoken or typed questions using the user's computed physiological context
- Speak its answers naturally through ElevenLabs
- Synchronize captions and avatar behavior with the generated audio
- Explore clearly labeled rest, light-activity, and exercise scenarios
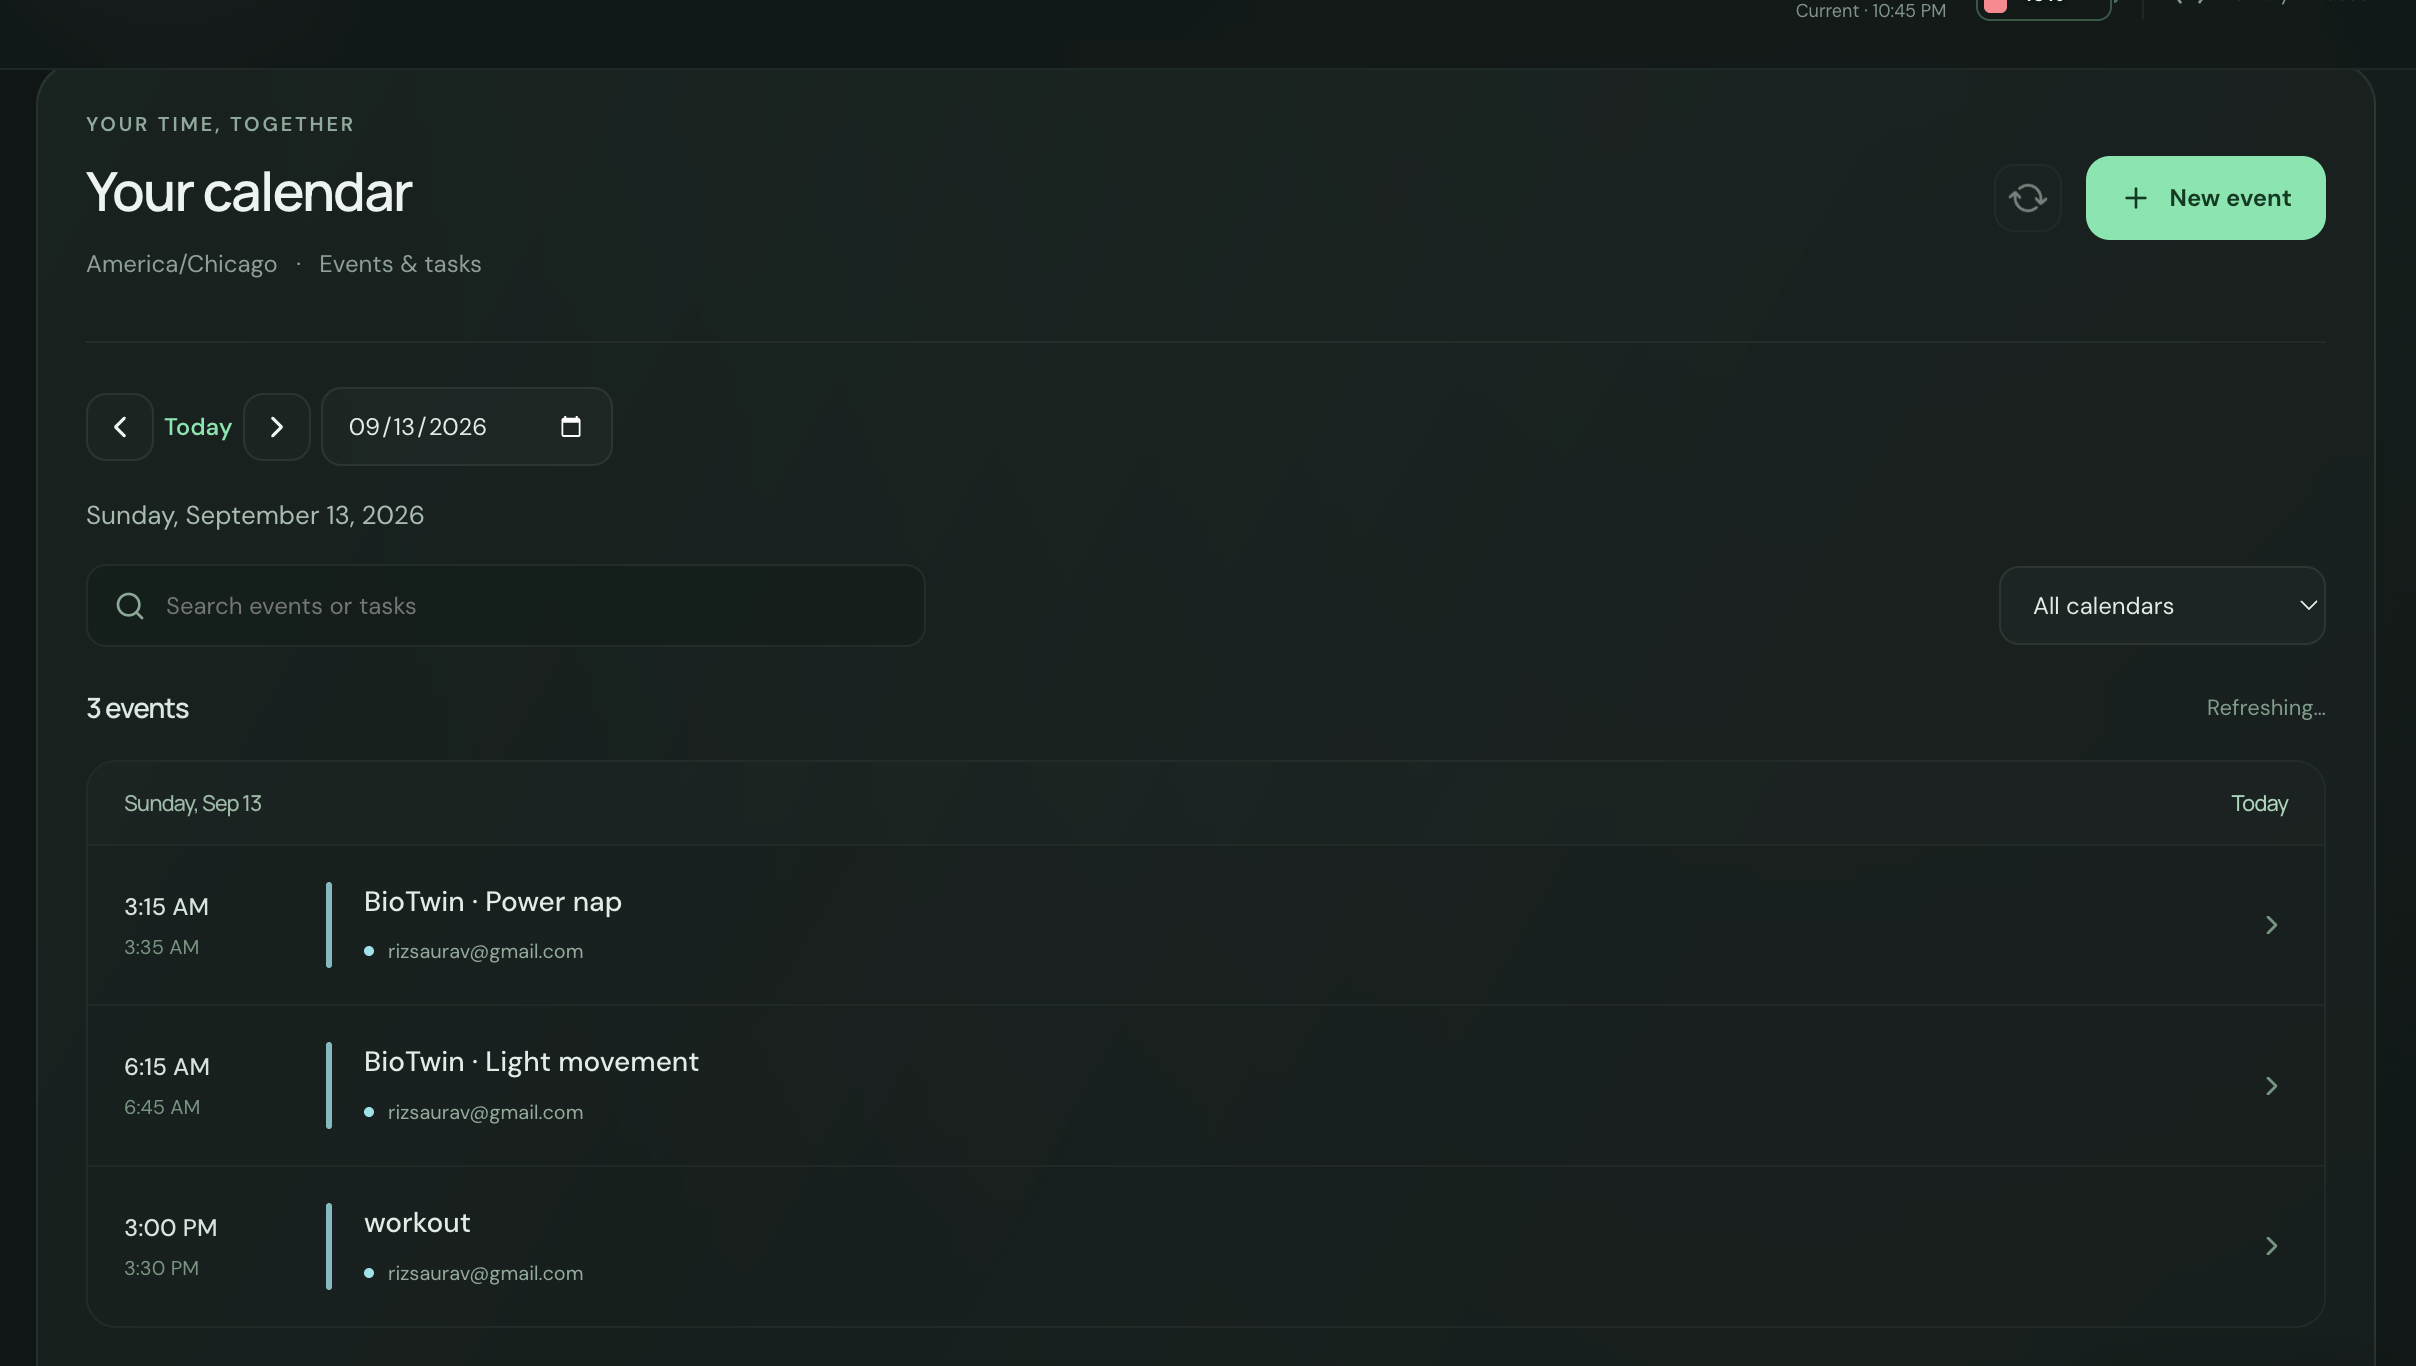
- Suggest calendar-feasible recovery or workout periods
- Prepare Google Calendar events that require explicit user confirmation
When a user asks about a specific topic, such as heart rate or sleep, BioTwin immediately opens the relevant visualization while the digital twin explains the result.
BioTwin is a wellness and experimentation platform, not a medical diagnostic system. Forecasts, simulations, and estimates are labeled honestly and remain separate from measurements reported directly by Garmin.
# How we built it
The frontend is built with React, TypeScript, Three.js, React Three Fiber, and Recharts. It includes an avatar, responsive desktop and mobile layouts, live physiological charts, synchronized captions, and installable Progressive Web App support.
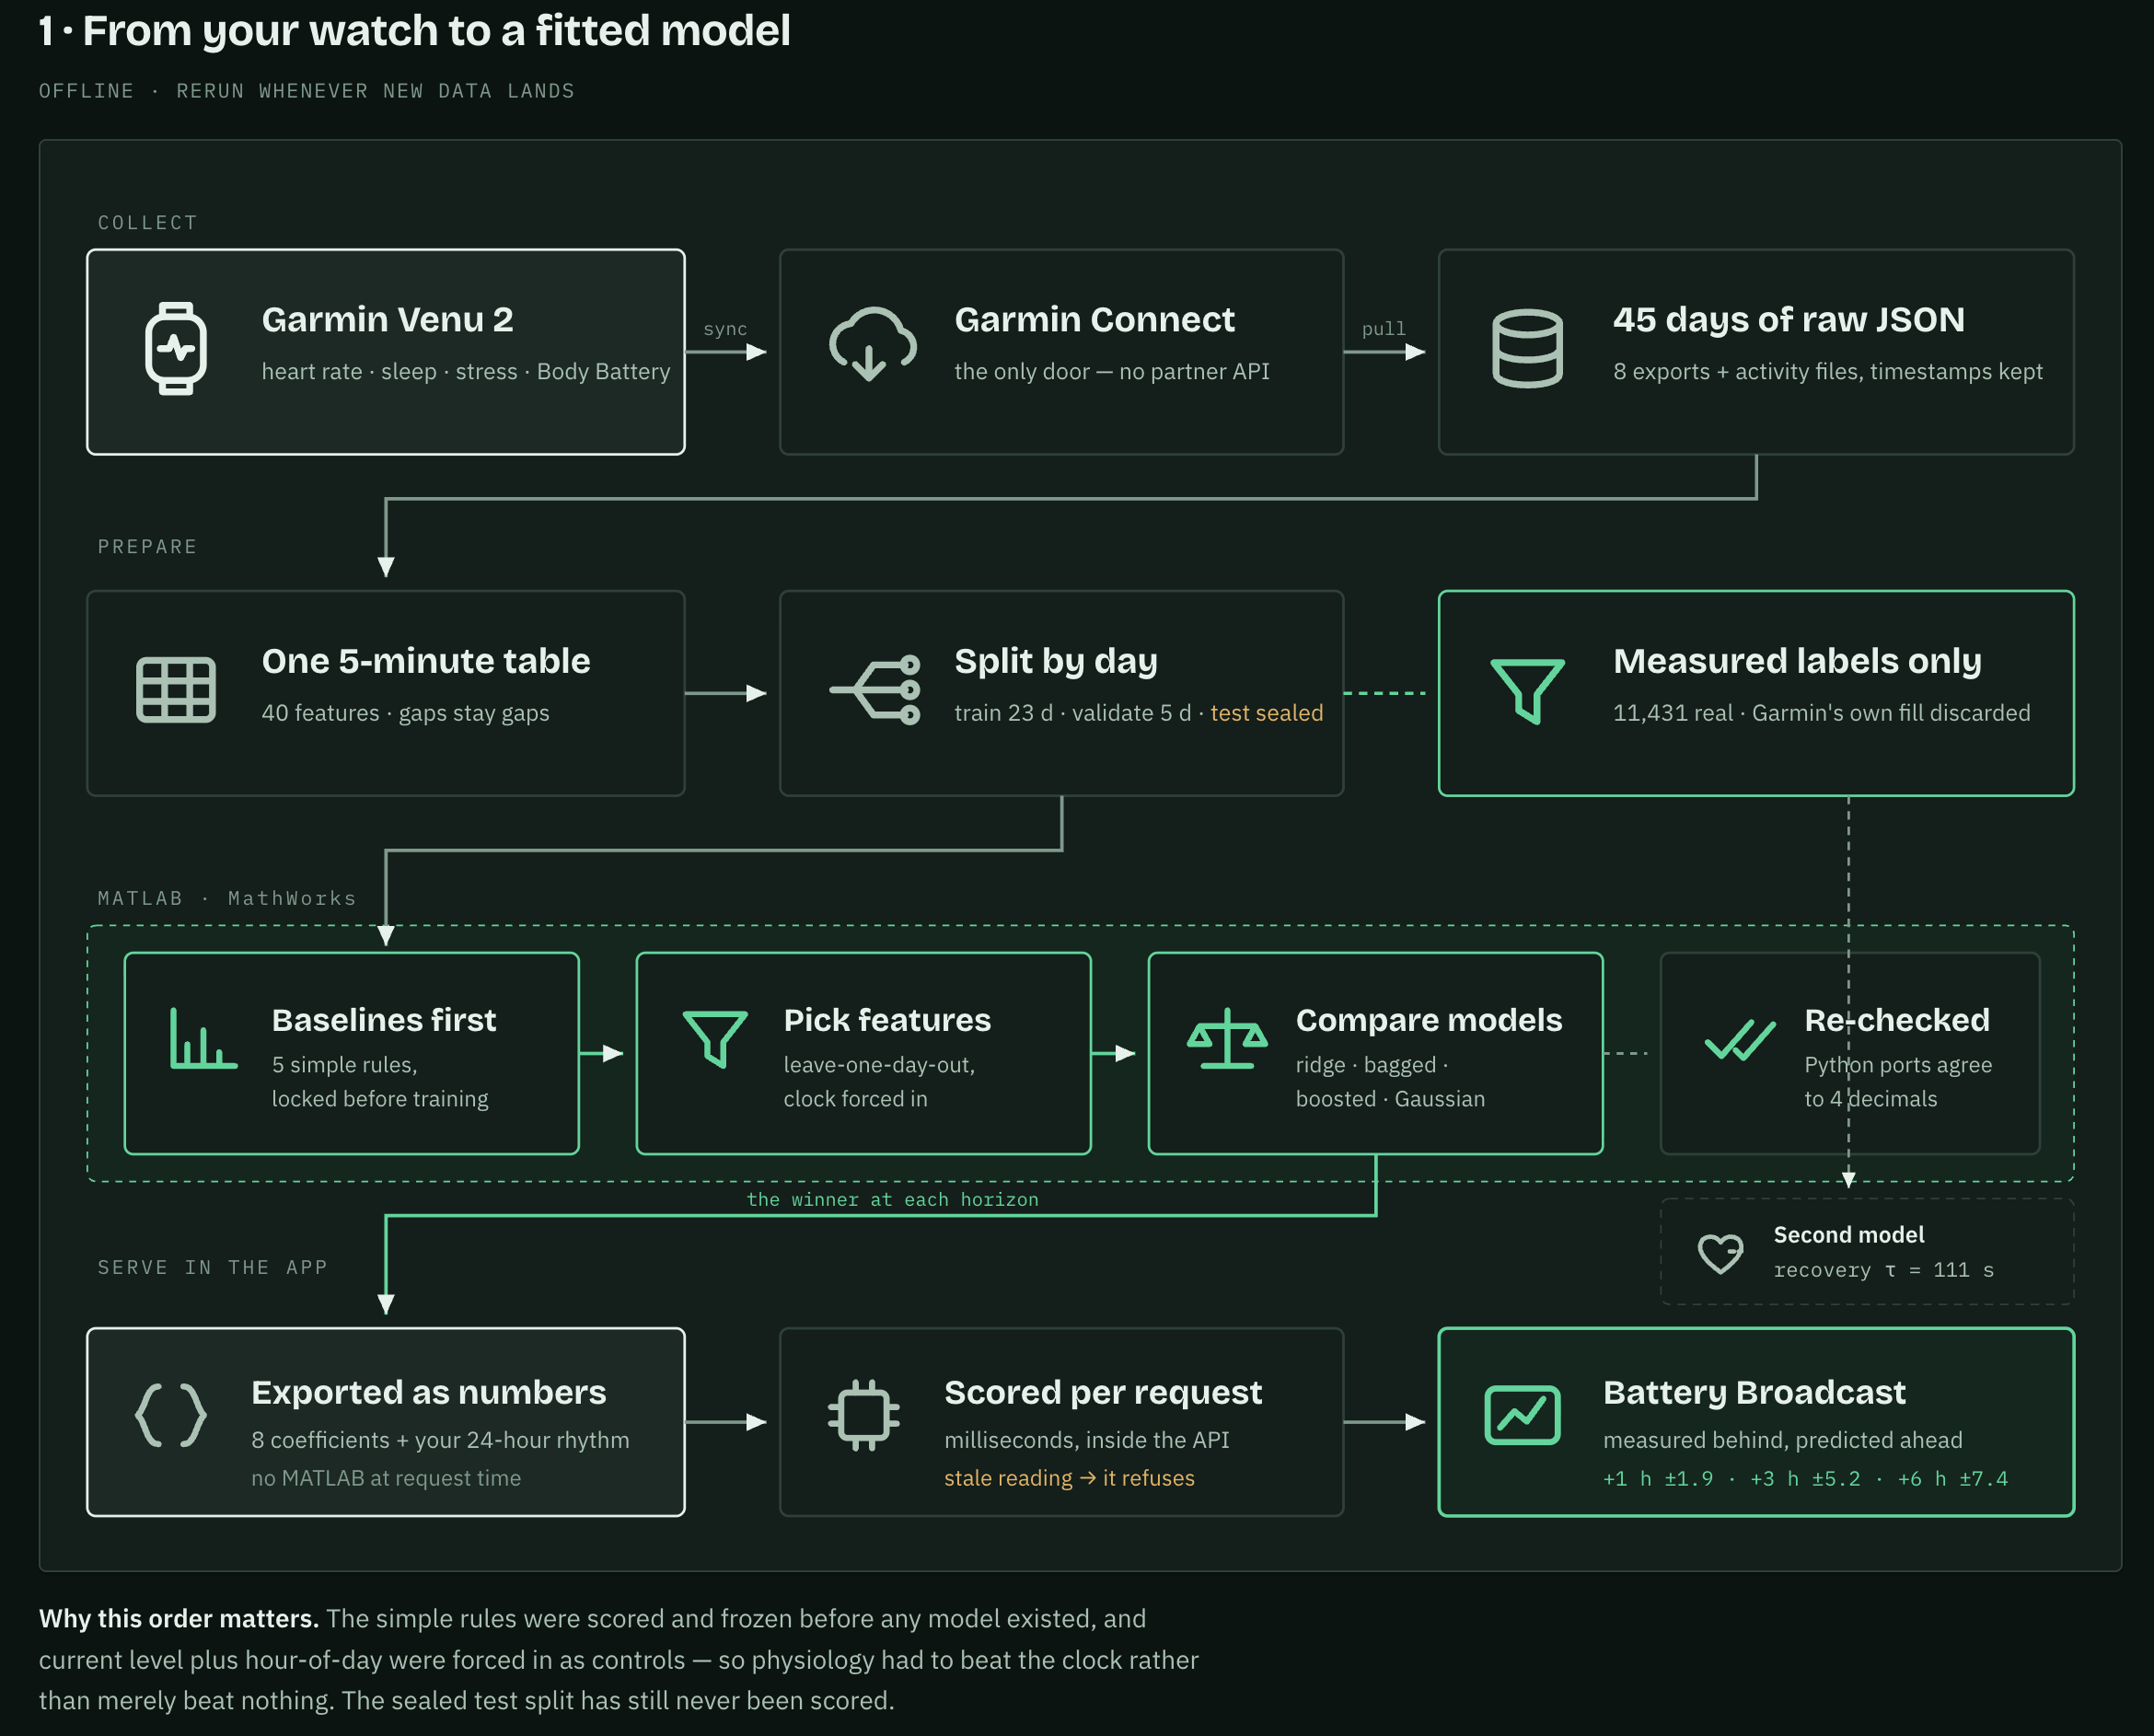
The backend uses MATLAB, Python, and FastAPI. Physiological measurements are normalized into a shared format, stored with account and source provenance, and processed into personalized baselines, readiness states, forecasts, and recovery curves. MATLAB is the modeling and validation engine behind these forecasts: rather than immediately training a machine-learning model, we first built strong baselines using persistence, recent Body Battery trend, and time-of-day behavior, then compared Ridge Regression, Bagged Trees, Boosted Trees with LSBoost, and Gaussian Process Regression across 30-minute, 1-hour, 3-hour, and 6-hour forecast horizons. At 1 hour, boosted trees reduced MAE from 2.35 for trend extrapolation to about 1.92; at 3 hours, bagged trees improved the strongest handcrafted rule from 5.20 to 4.84 MAE. At 6 hours, the simple time-of-day baseline still won, which we report honestly rather than presenting a more impressive but weaker model. MATLAB also supported our personalized heart-rate recovery model, fitting an exponential recovery curve and estimating a recovery constant of about 111 seconds from the user's own Garmin data. These models feed directly into the FastAPI/React application, so the dashboard moves beyond displaying health data and into forecasting the user's near-term physiological state. Authenticated WebSockets deliver live updates without requiring the interface to repeatedly poll the server.
For conversational reasoning, we use Google Gemini through Vertex AI. Gemini receives a structured snapshot of the user's computed health context rather than unrestricted access to raw application data. BioTwin validates numerical claims and evidence references before displaying the answer. If a provider fails or produces an unsupported result, the application preserves a grounded text fallback instead of inventing an answer.
We use ElevenLabs to turn each validated response into natural speech. Timestamped alignment information is matched against the browser's actual audio position, allowing captions, speaking indicators, and avatar behavior to remain synchronized throughout playback.
How we used MathWorks
MATLAB is BioTwin's modeling and validation layer. The web app shows the result, but MATLAB is where we actually tested whether our predictions meant anything.
We took real Garmin Venu 2 history and broke it into synchronized five-minute windows, each one carrying Body Battery, recent Body Battery change, heart rate, stress, sleep context, respiration, activity, and time of day. Before touching any machine learning, we asked a simpler question first: can a basic rule already solve this? So we built strong baselines: persistence, recent-trend extrapolation, time-of-day behavior, a combined trend-and-clock rule, and a daily-mean prediction. Any model we trained after that had to actually beat these, not just look sophisticated.
We then trained and compared four real modeling approaches: Ridge Regression, Bagged Regression Trees, Boosted Regression Trees using LSBoost, and Gaussian Process Regression, across four forecasting horizons: 30 minutes, 1 hour, 3 hours, and 6 hours. Because nearby five-minute windows are highly correlated with each other, we grouped our evaluation by calendar day instead of treating every row as an independent data point, which would have made our models look far more confident than they actually were.
The results told a genuinely interesting story, one where the answer changes depending on how far out you're forecasting:
At 30 minutes, trend extrapolation already reached 1.21 MAE, and Gaussian Process Regression pushed that down to 0.84.
At 1 hour, trend extrapolation sat at 2.35 MAE. Boosted trees brought that down to about 1.92.
At 3 hours, the strongest handcrafted rule (trend plus clock) reached 5.20 MAE. Bagged trees improved it to 4.84. This result mattered more than it might look: we also trained a linear Ridge Regression model on the exact same physiological inputs, and it did not beat the baseline at this horizon. Only the nonlinear tree ensemble did. That told us the relationship between stress, heart rate, sleep, time of day, and future Body Battery isn't a straight line, model class mattered here, not just which features we fed it.
At 6 hours, the simple time-of-day rule still won. No trained model beat it. We kept that result and reported it honestly, because BioTwin is built to report what the evidence actually supports, not to dress up a weaker model as a breakthrough.
Our current production forecast uses a lightweight Ridge Regression model, evaluated live by the FastAPI backend from exported coefficients, predicting Body Battery about one hour ahead at roughly 1.91 validation MAE. It also refuses to generate a forecast at all if the latest Body Battery reading is stale, rather than confidently predicting from outdated data.
MATLAB also carried the weight of our personalized heart-rate recovery model:
HR(t)=HR∞+A e−t/τHR(t) = HR_{\infty} + A \, e^{-t/\tau}
HR(t)=HR∞+Ae−t/τ
Here τ (tau) is the personal recovery time constant, how fast a specific person's heart rate actually comes back down after exertion. Using real post-exercise Garmin data, we estimated τ at approximately 111 seconds. Getting there wasn't clean on the first try: our initial fit constrained the asymptotic heart rate too tightly toward resting heart rate, which quietly inflated the fitted recovery constant into something artificially large. Once we let the asymptote get estimated directly from the observed recovery segment instead of assuming it, the fit stabilized and the residual error dropped. That's a real example of catching a modeling artifact before trusting the number it produced.
MathWorks is what turned BioTwin from a visualization project into an actual modeling project. It gave us a structured way to ask harder questions than "does this look right": can a simple rule already solve this, does physiology add real information beyond current Body Battery and time of day, is the underlying relationship linear or not, and at what point does a trained model stop earning its complexity.
What we learned
We learned that sophisticated machine learning is not automatically better than a simple, well-designed baseline. At shorter horizons, physiological signals and nonlinear models provided useful improvements. At longer horizons, time of day remained extremely difficult to beat.
We also learned that generative AI becomes much more trustworthy when it is placed behind a structured evidence boundary. Gemini is responsible for explanation, while BioTwin's physiological models remain responsible for the numbers.
ElevenLabs showed us that voice becomes more compelling when it is connected to the entire interface. The twin does not merely play an audio file: its captions, state, animation, and displayed data respond together.
Most importantly, we learned that a digital twin does not need to pretend to be clinically authoritative to be useful. It can help people understand patterns, explore possibilities, and make more informed decisions while remaining honest about uncertainty.
What's next
Next, we would validate the forecasting models using longer histories and more participants, evaluate the sealed test dataset, expand supported wearable integrations, and study whether personalized explanations improve real-world recovery decisions.
We would also explore continuous model recalibration, native mobile sensor integrations, stronger uncertainty estimates, and privacy-preserving learning across multiple users.
Our long-term goal is to make health data feel less like a spreadsheet and more like a conversation with a system that understands your individual pattern.
Built With
- api
- docker
- elevenlabs
- fastapi
- garmin
- gemini
- machine-learning
- matlab
- numpy
- postgresql
- python
- react
- scipy
- sqlalchemy
- sqlite
- statistics
- typescript
- vertex
- vite
- websockets


Log in or sign up for Devpost to join the conversation.