-
-
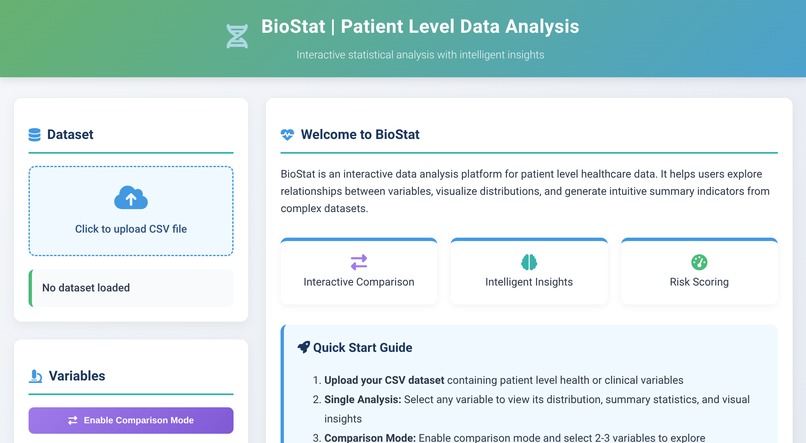
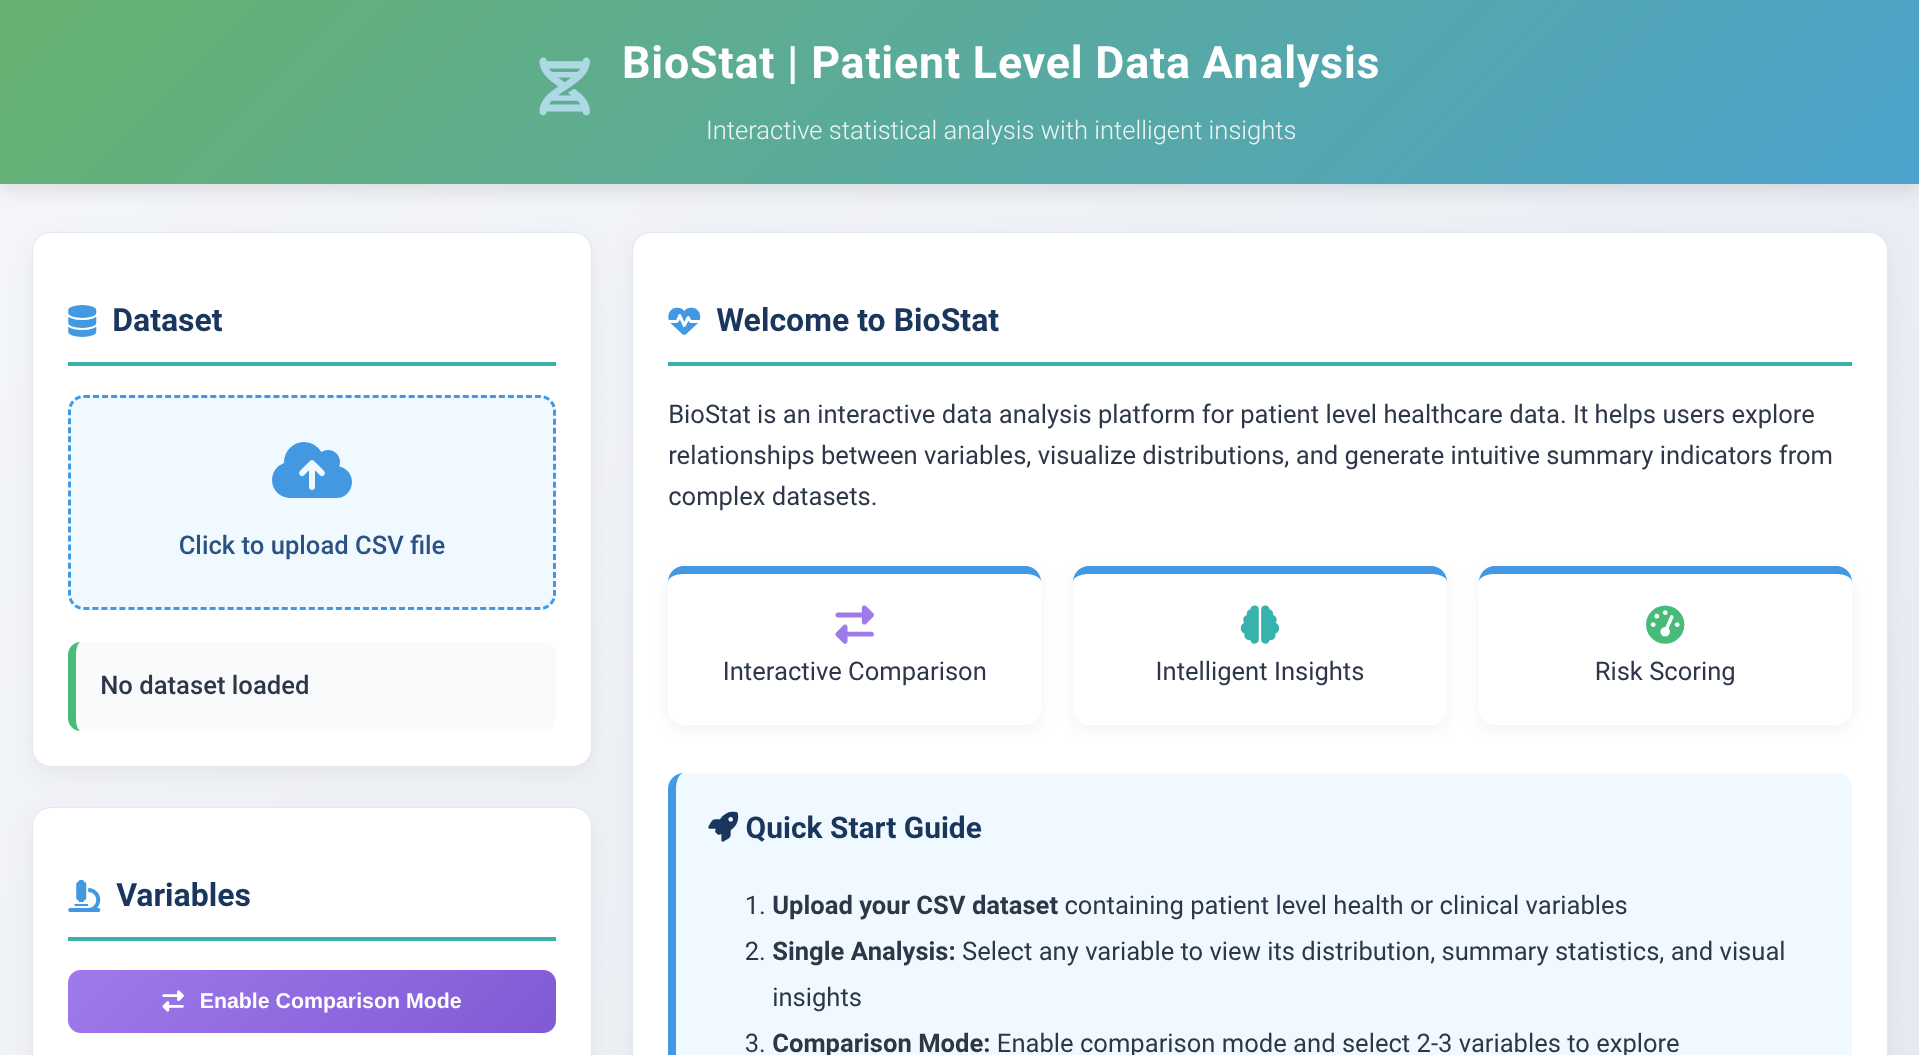
Website Home Page
-
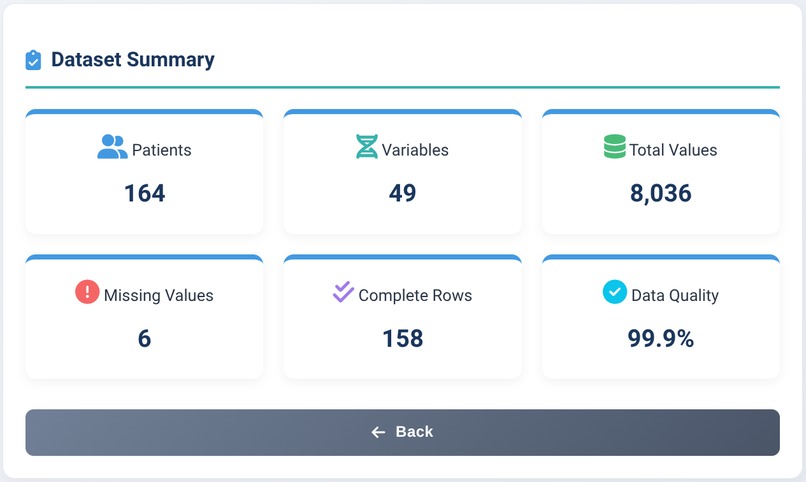
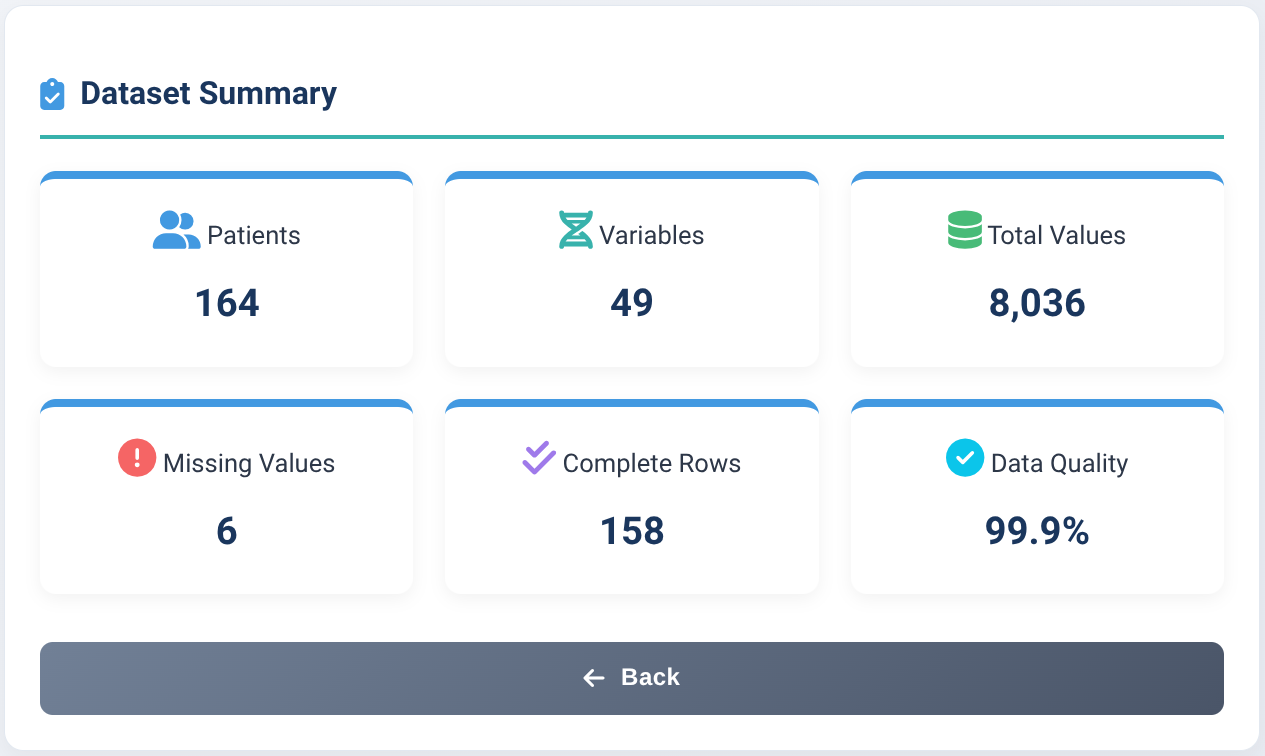
Dataset Summary
-
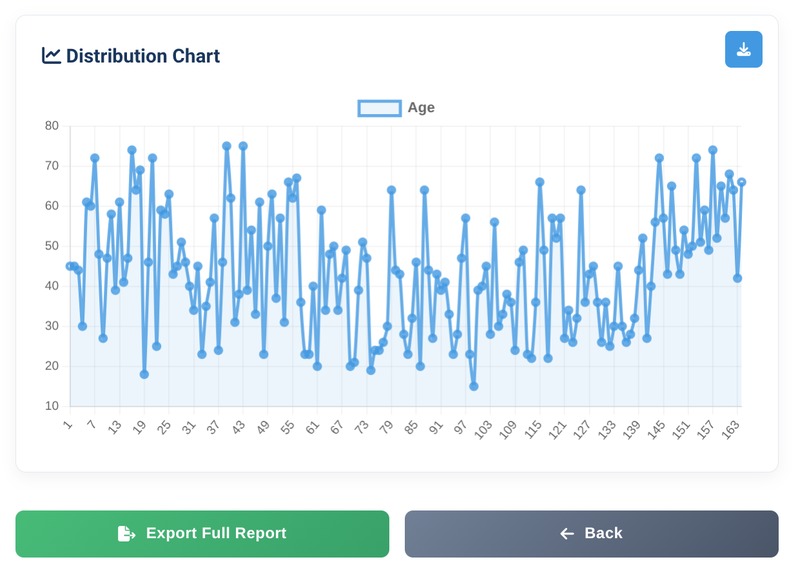
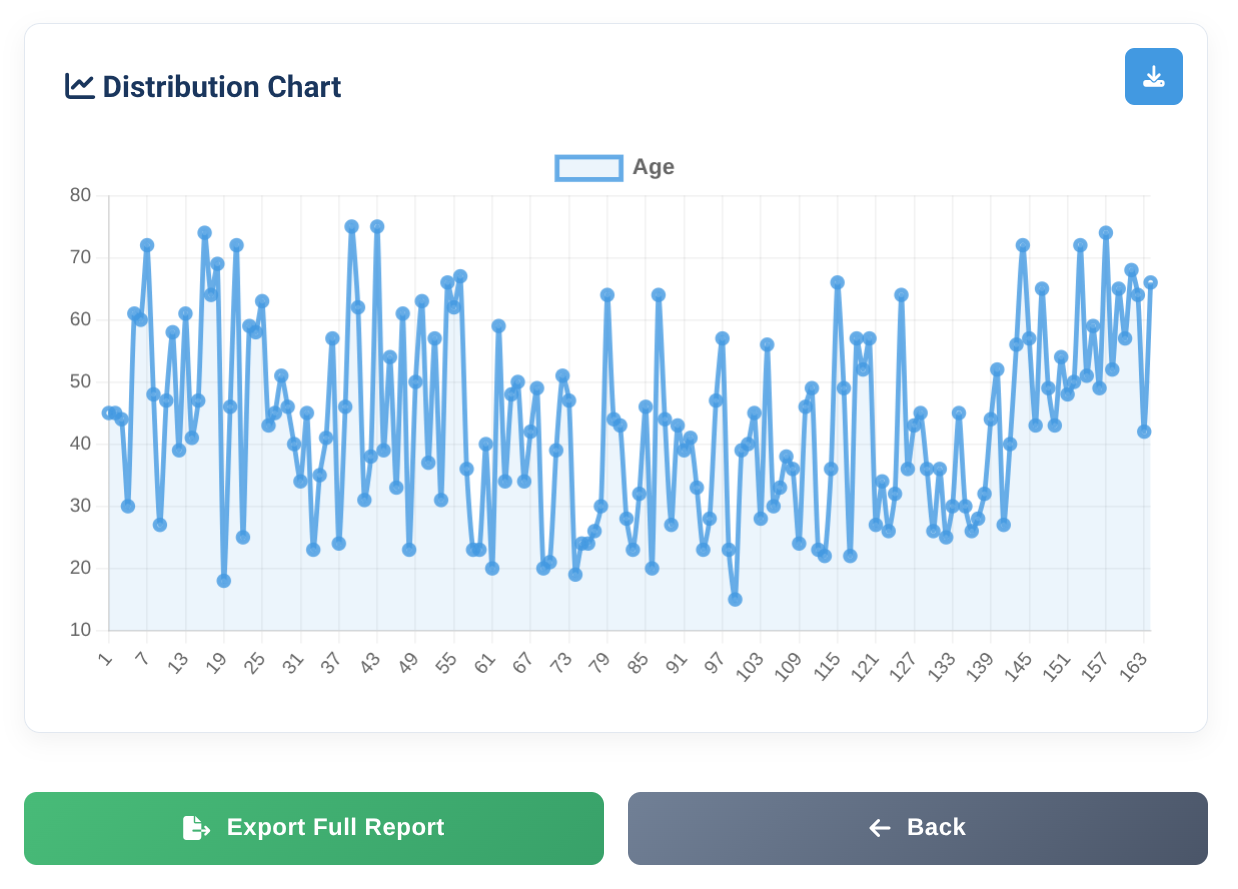
Statistical Distribution Graph
-
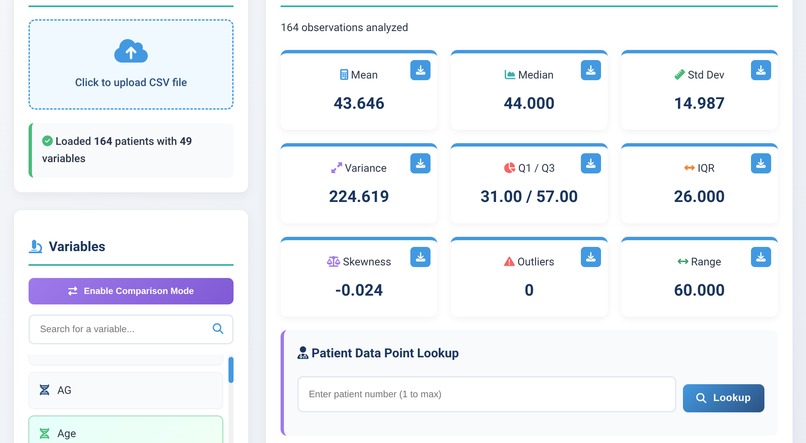
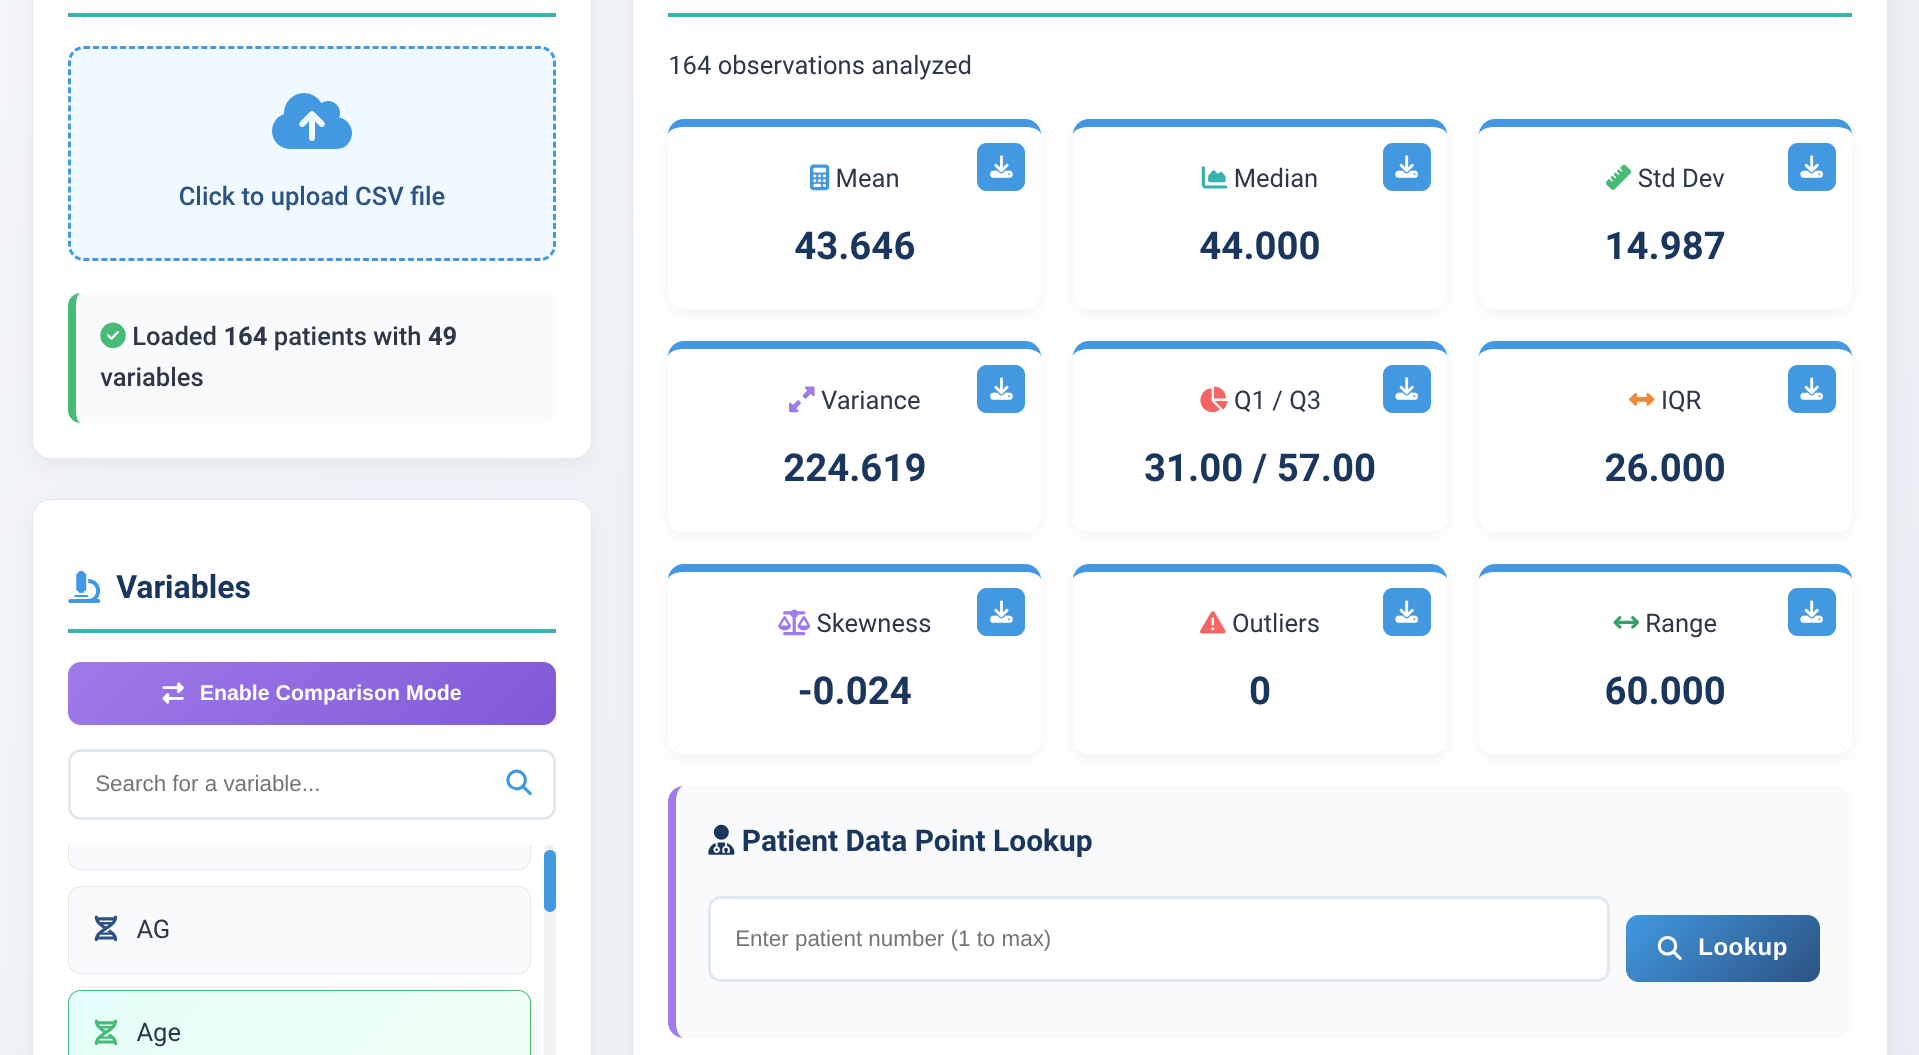
Central Tendency Values
-
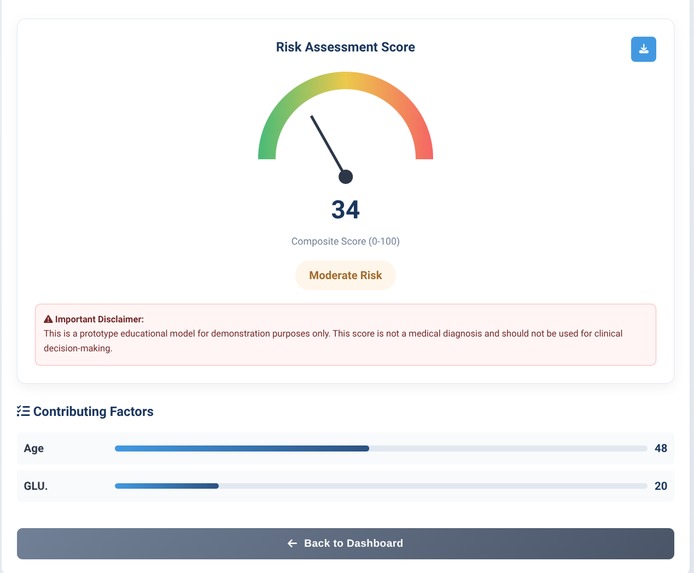
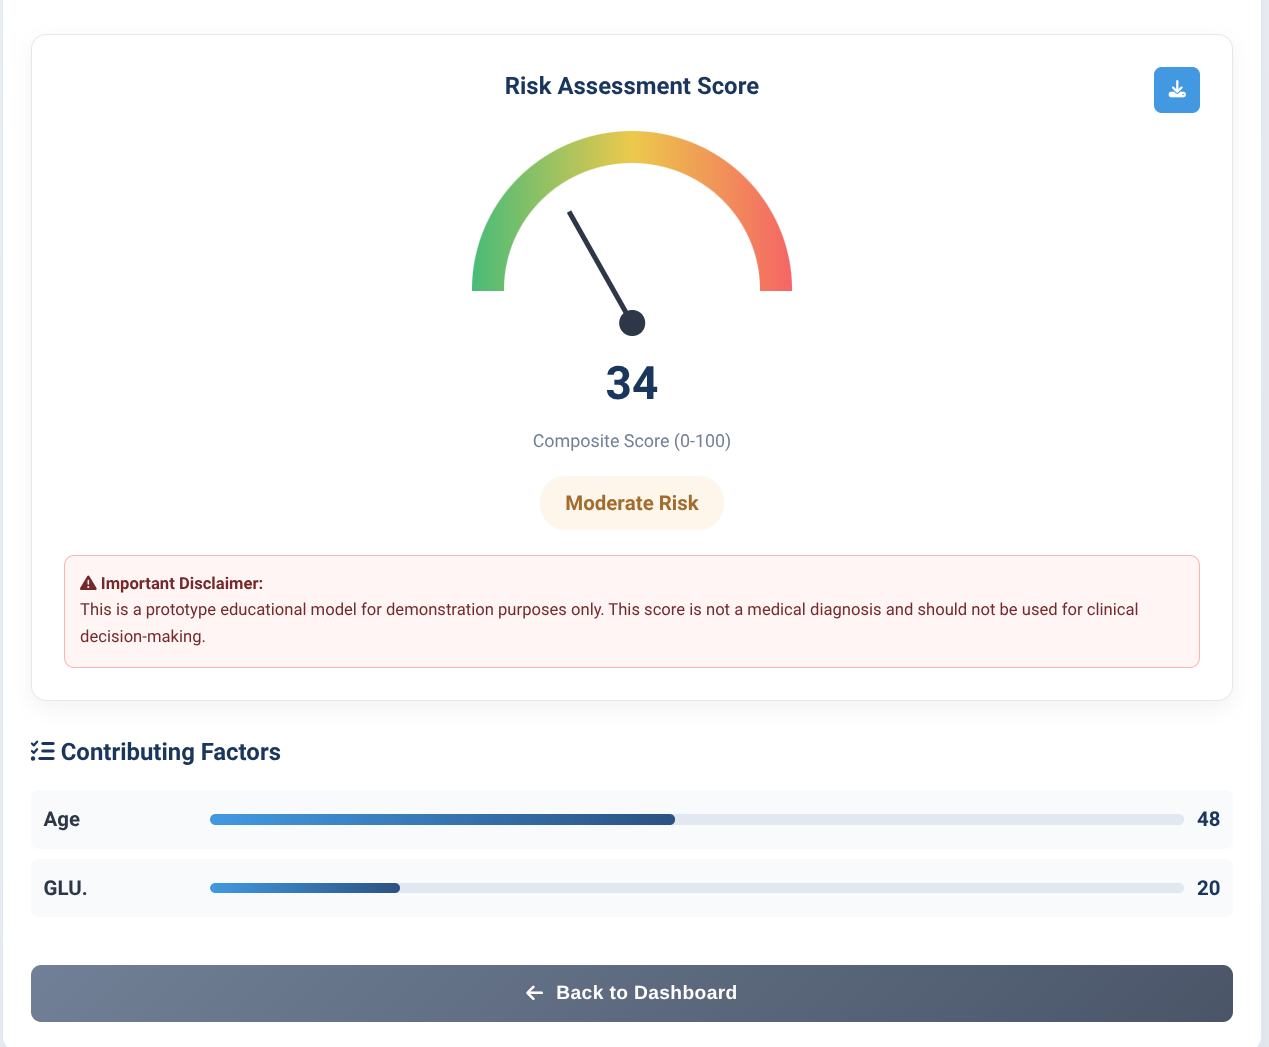
Risk Assessment Score Prediction
-
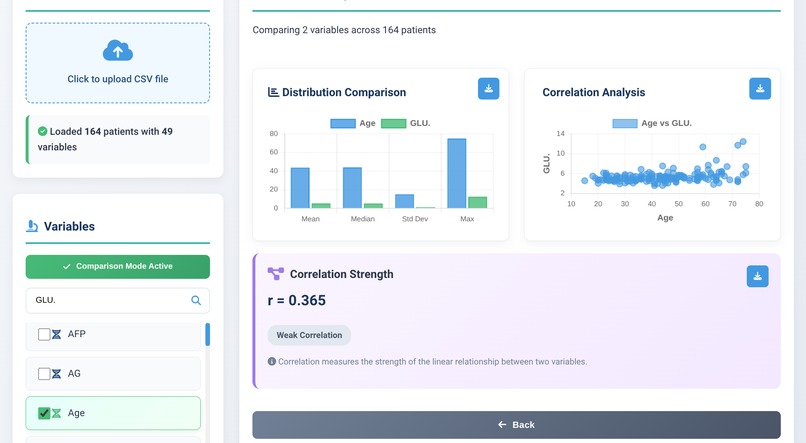
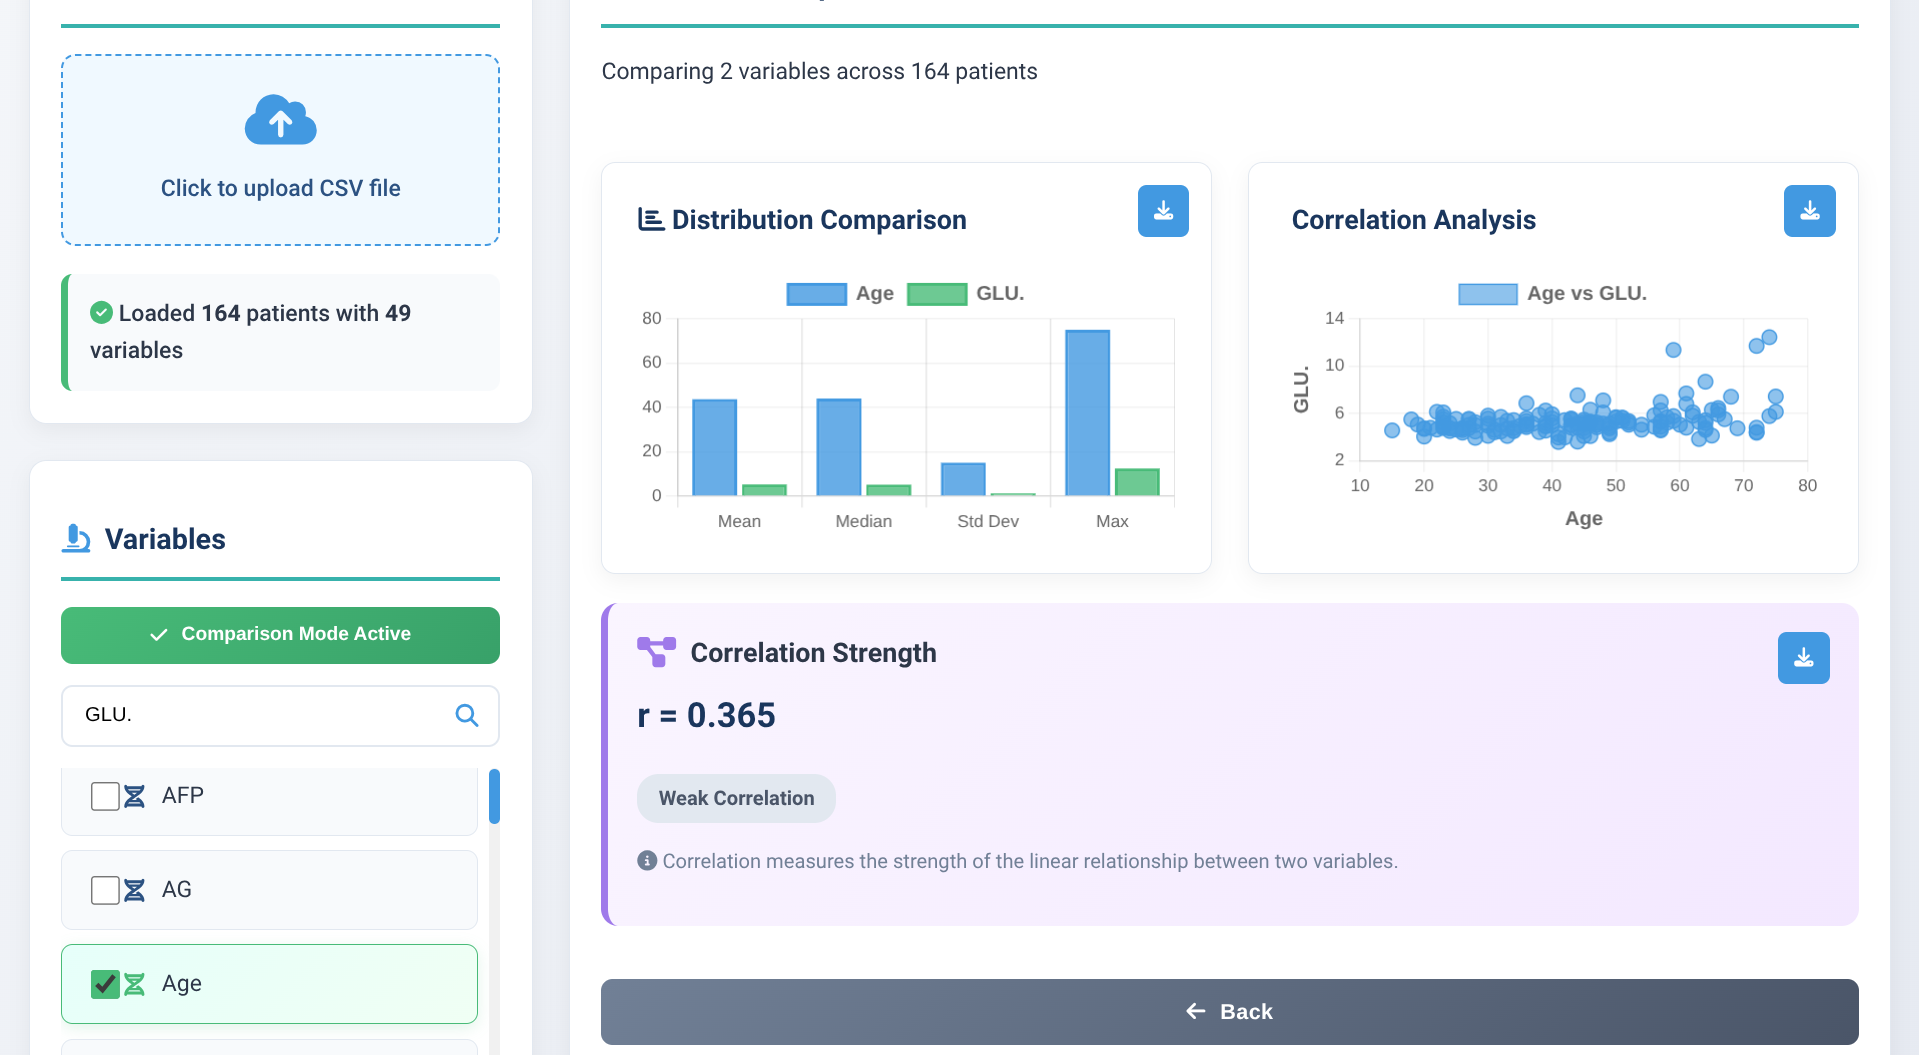
Multi-Comparison Mode
-
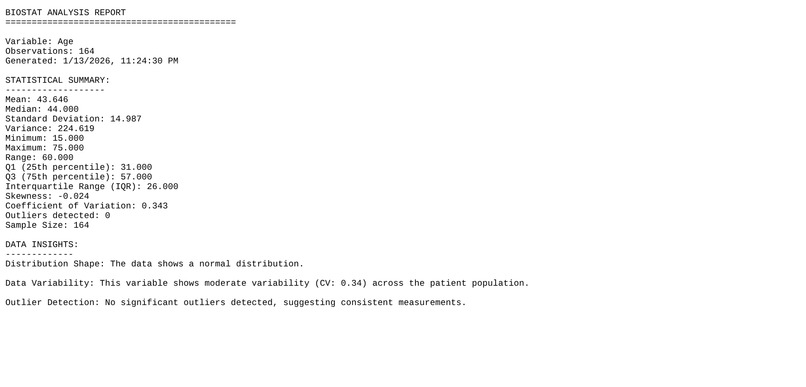
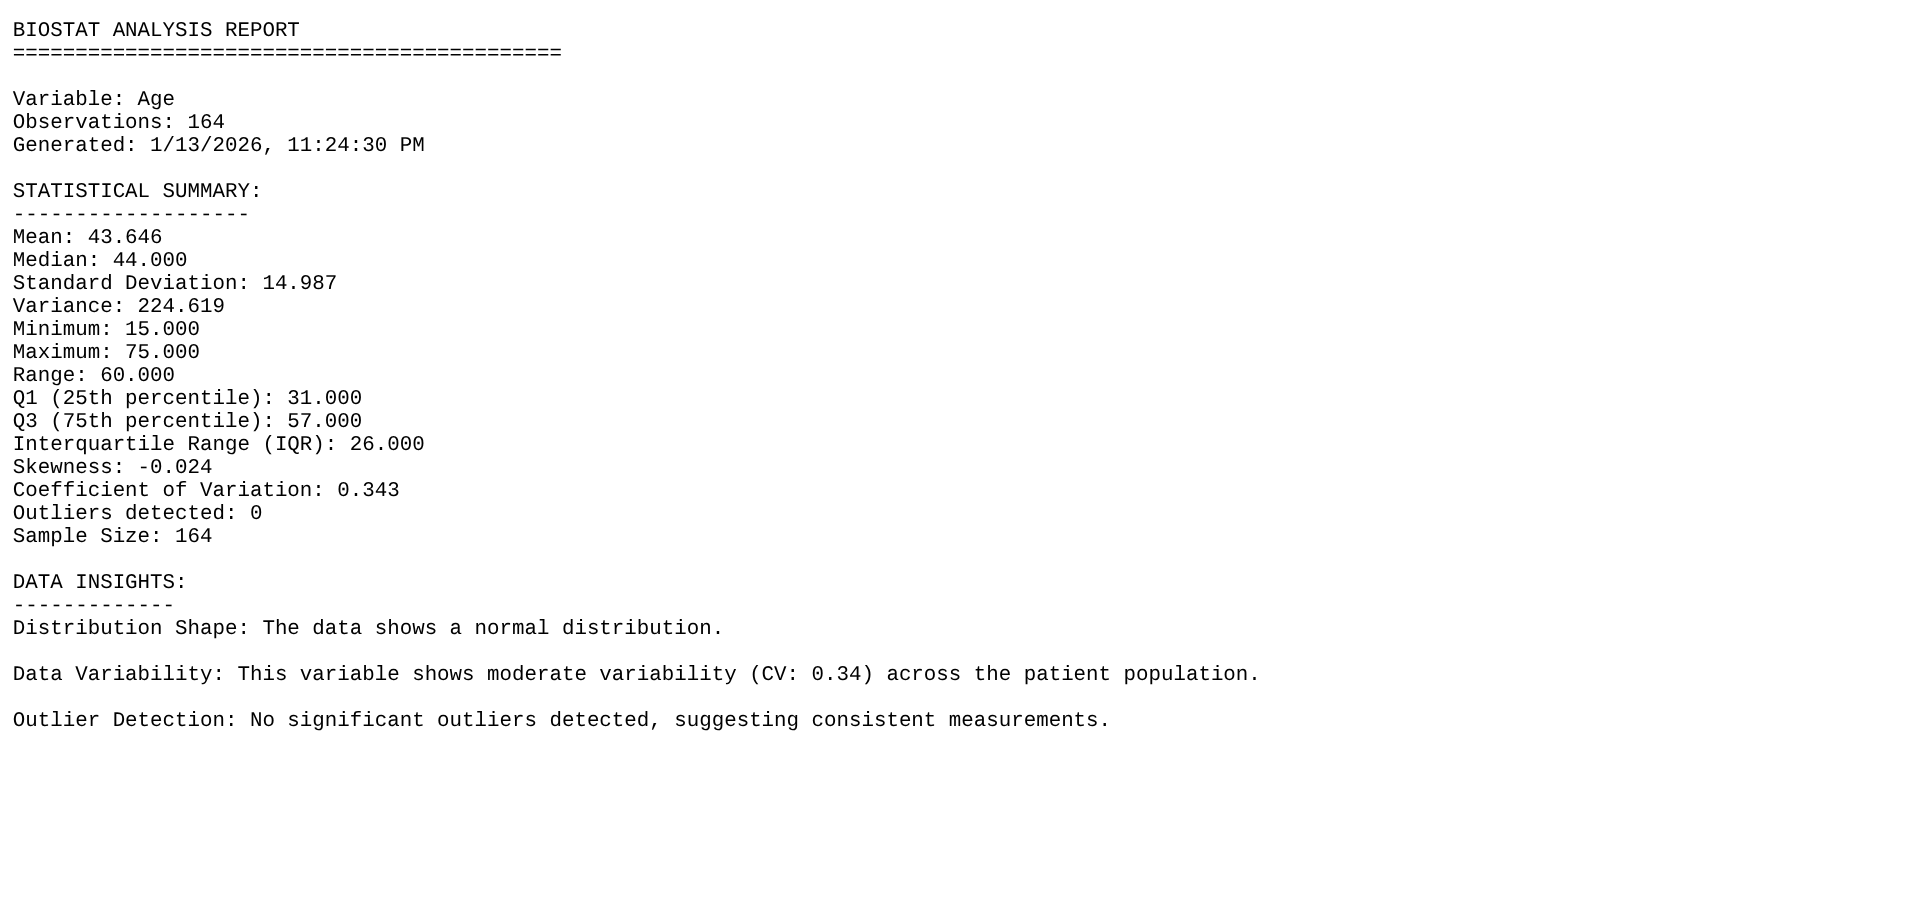
Exported Data
Presentation Link:
https://drive.google.com/file/d/1SI8zTaOCMzQSQPecUWE3X6S1v3TemPta/view?usp=sharing
Problem
Biological and clinical data are everywhere, but insight is not.
Clinicians, researchers, and early-stage biotech teams routinely receive raw CSV files containing patient or experimental data. Turning those files into actionable understanding usually requires specialized software, coding expertise, or fragmented tools that slow decision-making. The result is a bottleneck: valuable data exists, but practical interpretation is delayed or inaccessible to the people who need it most.
This gap is especially painful in fast-moving research environments and resource-limited clinical settings, where time, technical expertise, and data privacy all matter.
Solution
BioStat 2.0 is an AI-powered, web-based biological data analysis platform that transforms raw CSV files into clear, interpretable insights in minutes. No coding. No setup. No data leaving the user’s browser.
The platform is disease-agnostic and designed to support real-world workflows in biology and medicine. Users upload a dataset and immediately receive statistical summaries, visualizations, cohort comparisons, and AI-driven risk indicators that make complex data understandable at a glance.
BioStat 2.0 is built for scale: a single interface that works across diseases, datasets, and user expertise levels.
How It Works
Users upload a CSV file directly into the browser. Data is validated, processed, and analyzed entirely client-side to maximize privacy and security.
The platform automatically generates:
Descriptive statistics and intuitive visual summaries
Patient-level insights derived from variable distributions
An AI-assisted risk assessment module that translates biomarker values into interpretable risk indicators
A multi-dataset comparison mode for side-by-side cohort analysis
The focus is speed, clarity, and trust. Users spend time interpreting results, not wrestling with tools.
What Makes It an AI-Powered Company
BioStat 2.0 moves beyond static visualization by embedding intelligent analysis into the workflow. Risk scoring, variable interpretation, and comparative insights are automated, allowing users to extract meaning without manual statistical reasoning.
As the platform evolves, these models can become disease-specific, continuously improving, and tailored to clinical and research contexts, turning BioStat from a tool into a decision-support engine.
Technology
Frontend: HTML, CSS, JavaScript
Data processing and analysis: JavaScript-based statistical and AI logic
Visualization: PapaParse, Chart.js
Team
Solo-founded and built. All product design, frontend development, data analysis logic, and UI implementation were completed independently during the hackathon.
Why This Should Scale
BioStat 2.0 targets a large, growing market: researchers, clinicians, students, and early-stage biotech teams who need fast insight without technical overhead. The platform is lightweight, privacy-first, and adaptable across domains, making it easy to deploy and expand.
Future monetization paths include premium AI risk models, clinical reporting tools, enterprise deployments, and integrations with standardized medical data formats.
Impact
BioStat 2.0 lowers the barrier between raw biological data and meaningful understanding. By making analysis accessible, fast, and interpretable, it enables better research decisions, more informed clinical judgment, and wider participation in data-driven biology.
This is not just a visualization tool. It’s an AI-powered bridge between data and decisions.
Built With
- canvas-api
- cdn
- chart.js
- css3
- fontawesome
- github
- html5
- javascript
- papaparse

Log in or sign up for Devpost to join the conversation.