Inspiration
The biotechnology industry is crucial in shaping innovation, healthcare, and the economy. However, finding consolidated, accessible data to identify regional trends and opportunities can be challenging. Inspired by the potential to empower researchers, policymakers, and entrepreneurs, we envisioned BioSphere Econometrics as an open-source platform to bridge this gap and make biotech data easy to explore and utilize.
What it does
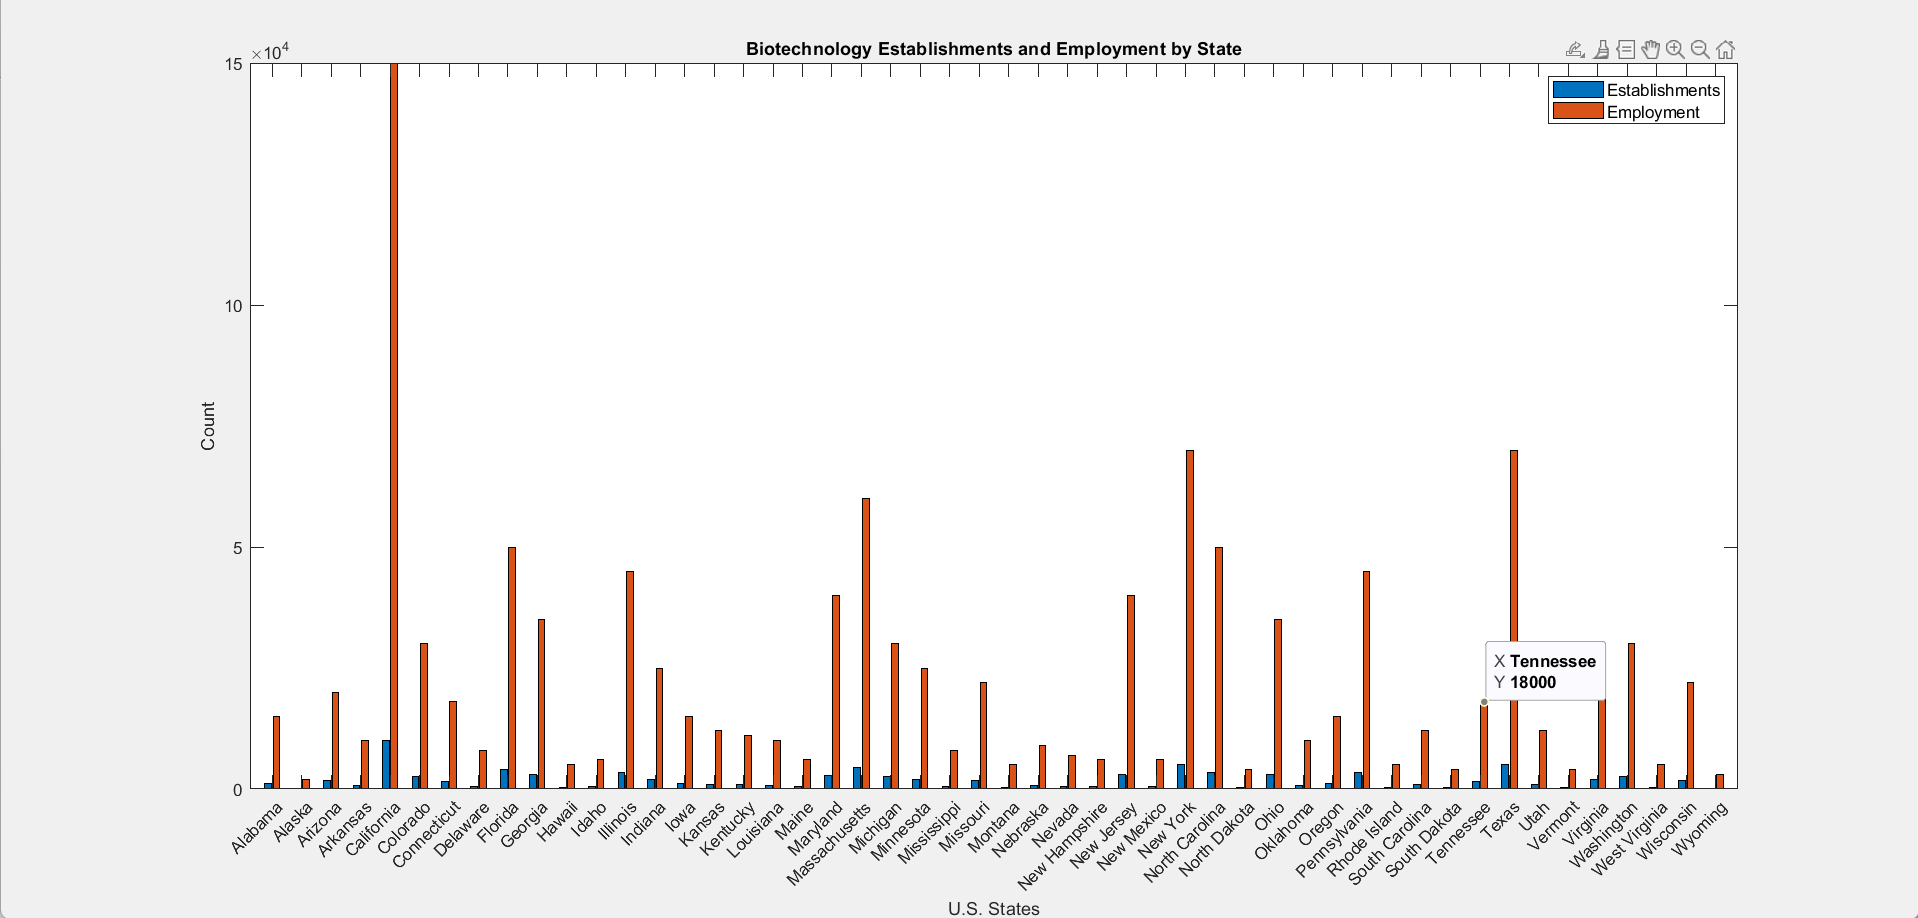
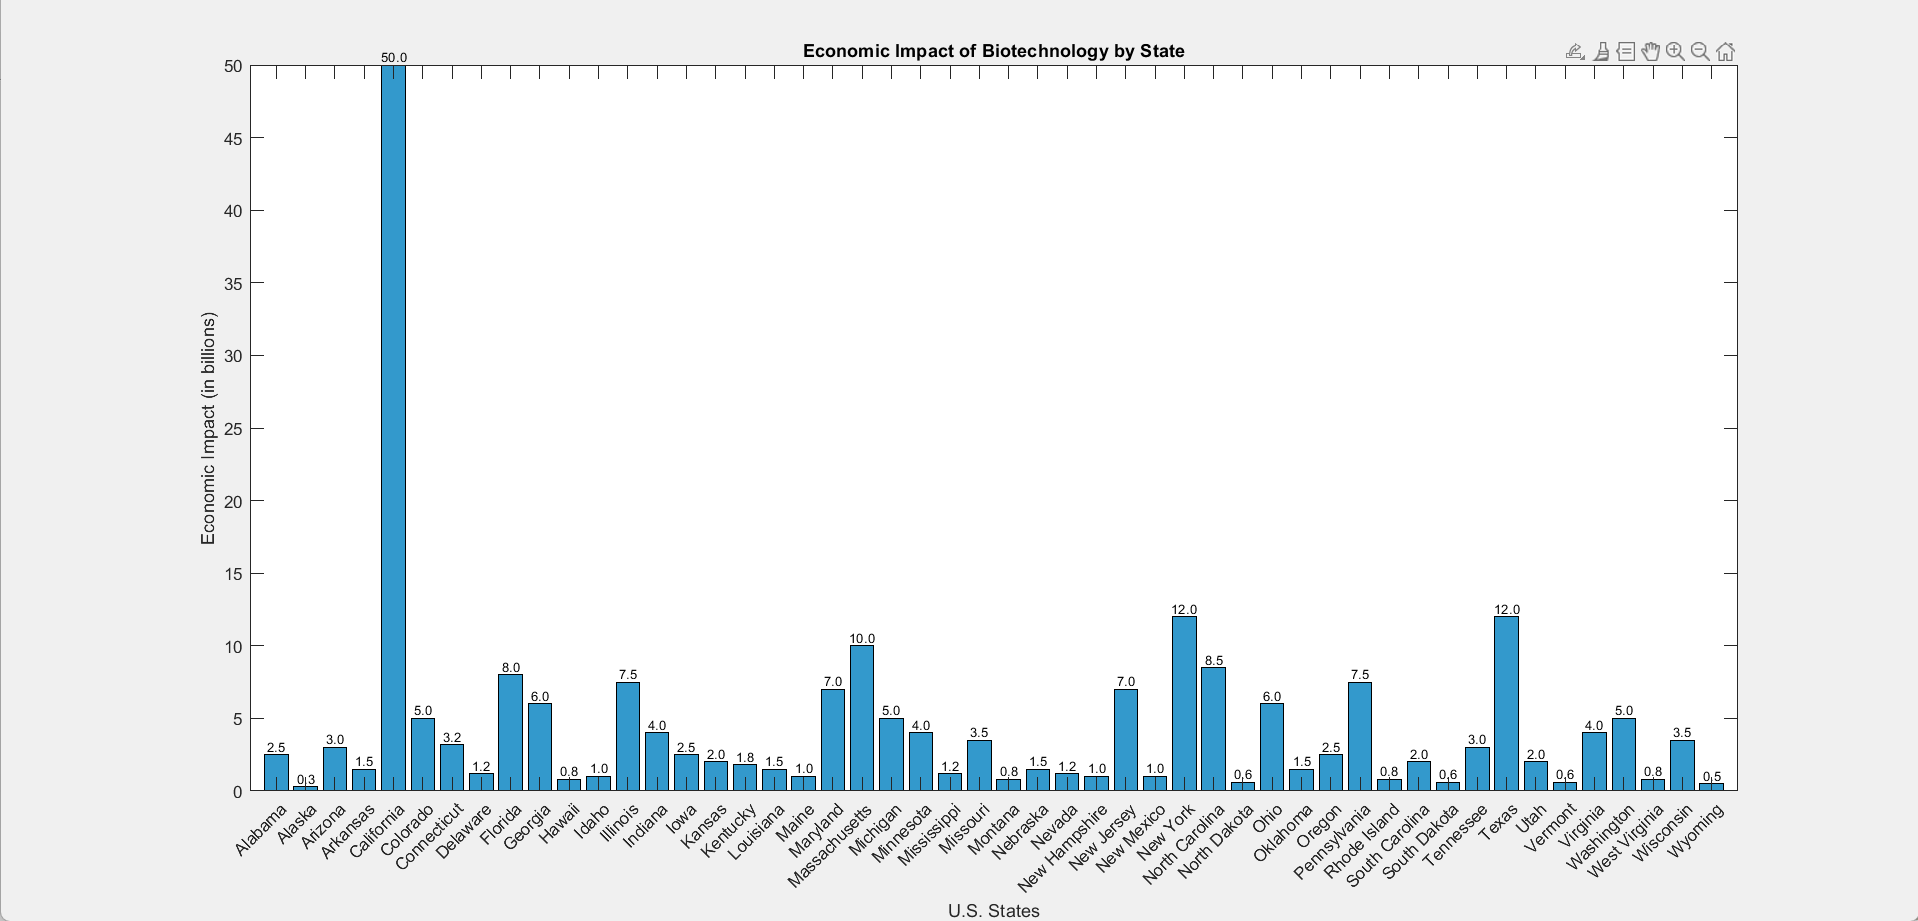
BioSphere Econometrics will become an open-source tool that analyzes publicly available biotech data across 50+ U.S. states. It identifies key trends in employment, economic impact, and regional strengths, offering clear visualizations and insights to highlight biotech leaders and untapped opportunities. The platform is free and accessible to anyone interested in exploring the biotech landscape.
How we built it
Using MATLAB, we developed algorithms to process and visualize the data, highlighting state-by-state trends.
Challenges we ran into
One major challenge was cleaning and normalizing data from diverse sources to ensure consistency and reliability. Additionally, we worked to balance visual simplicity with analytical depth, making sure the platform remains accessible without sacrificing detail. Finally, designing a simple open-source framework that’s easy for others to contribute to required careful planning and documentation.
What we learned
We gained a deeper understanding of the biotech industry and the challenges of data aggregation and analysis.
Built With
- davinciresolve
- matlab

Log in or sign up for Devpost to join the conversation.