-
BioSentinel logo — a nature-focused heartbeat symbol representing ecosystem health monitoring.
-
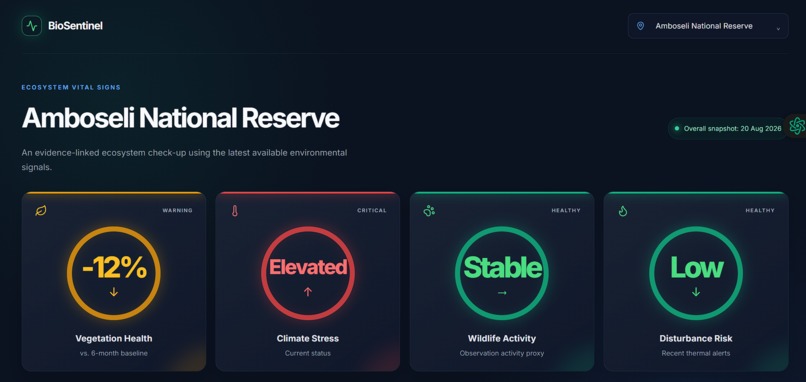
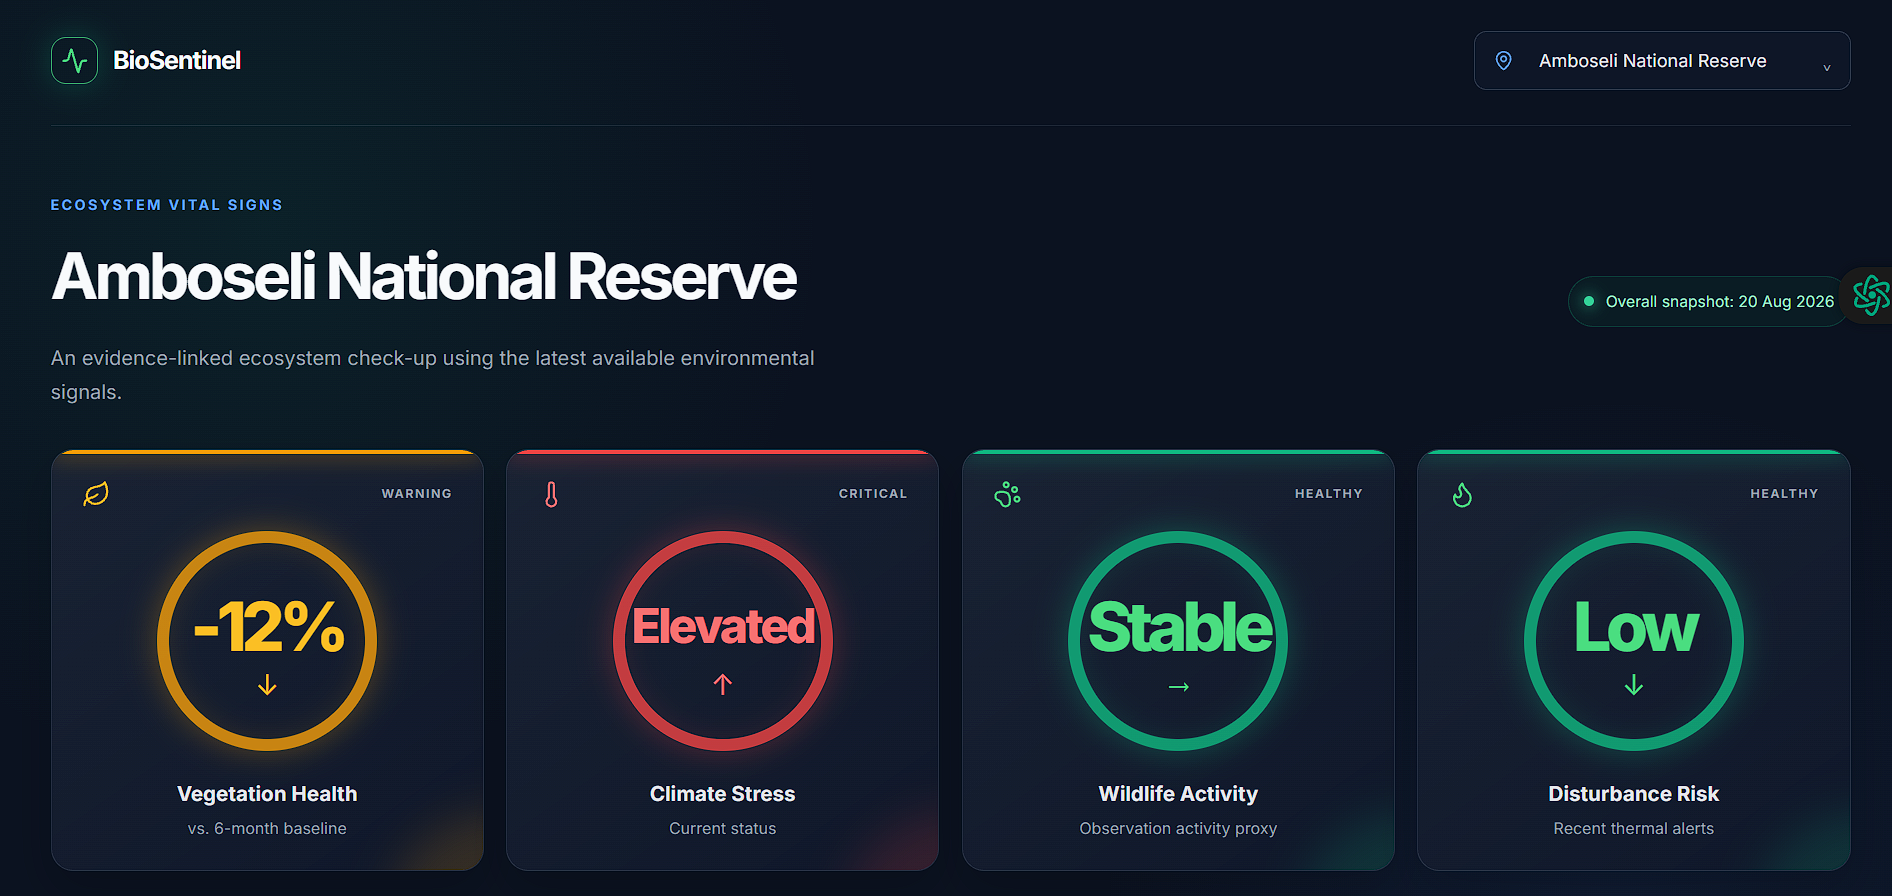
BioSentinel Dashboard — four ecosystem vital signs summarizing vegetation health, climate stress, wildlife activity, and disturbance risk.
-
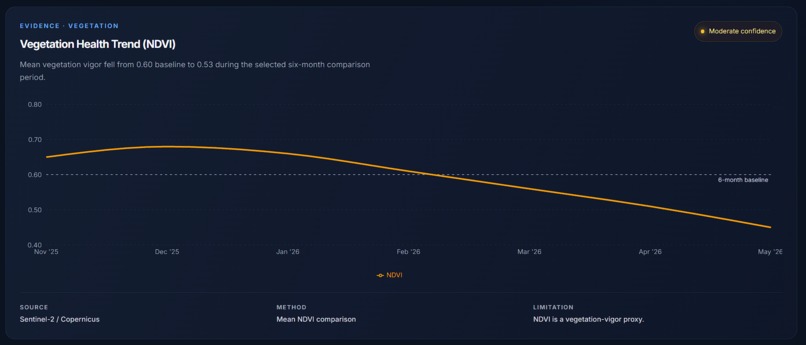
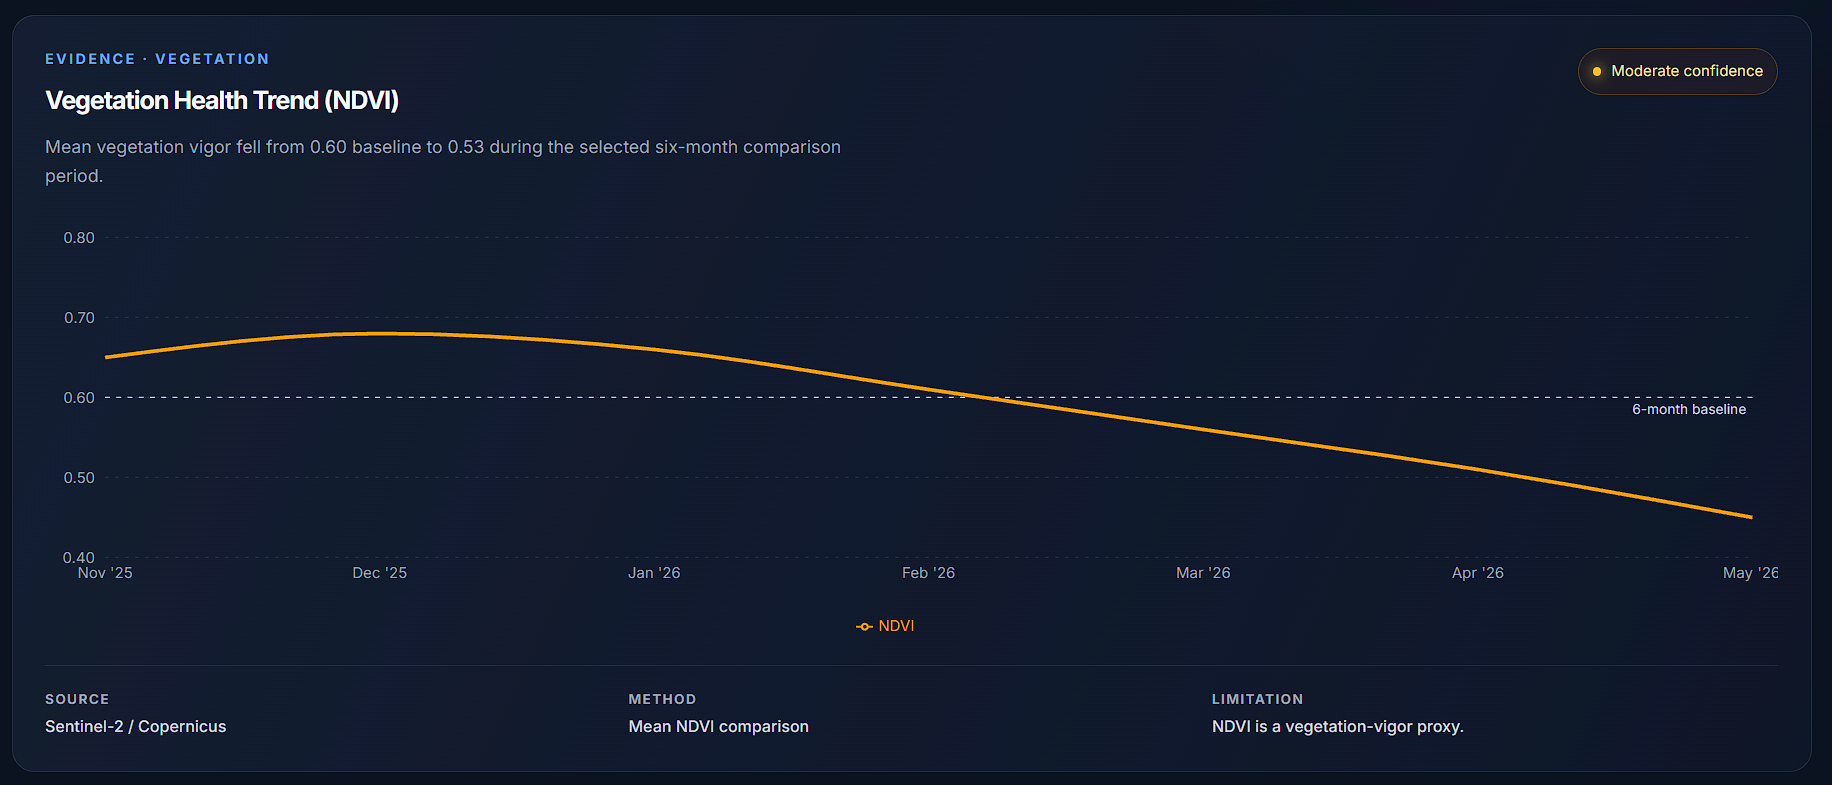
Vegetation Health Trend — NDVI comparison showing vegetation vigour declining below the six-month baseline.
-
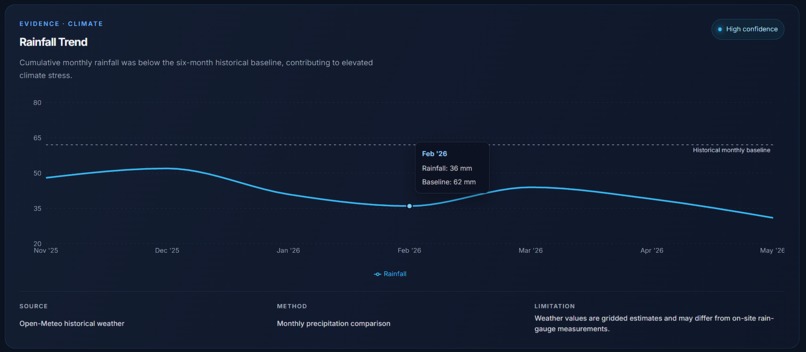
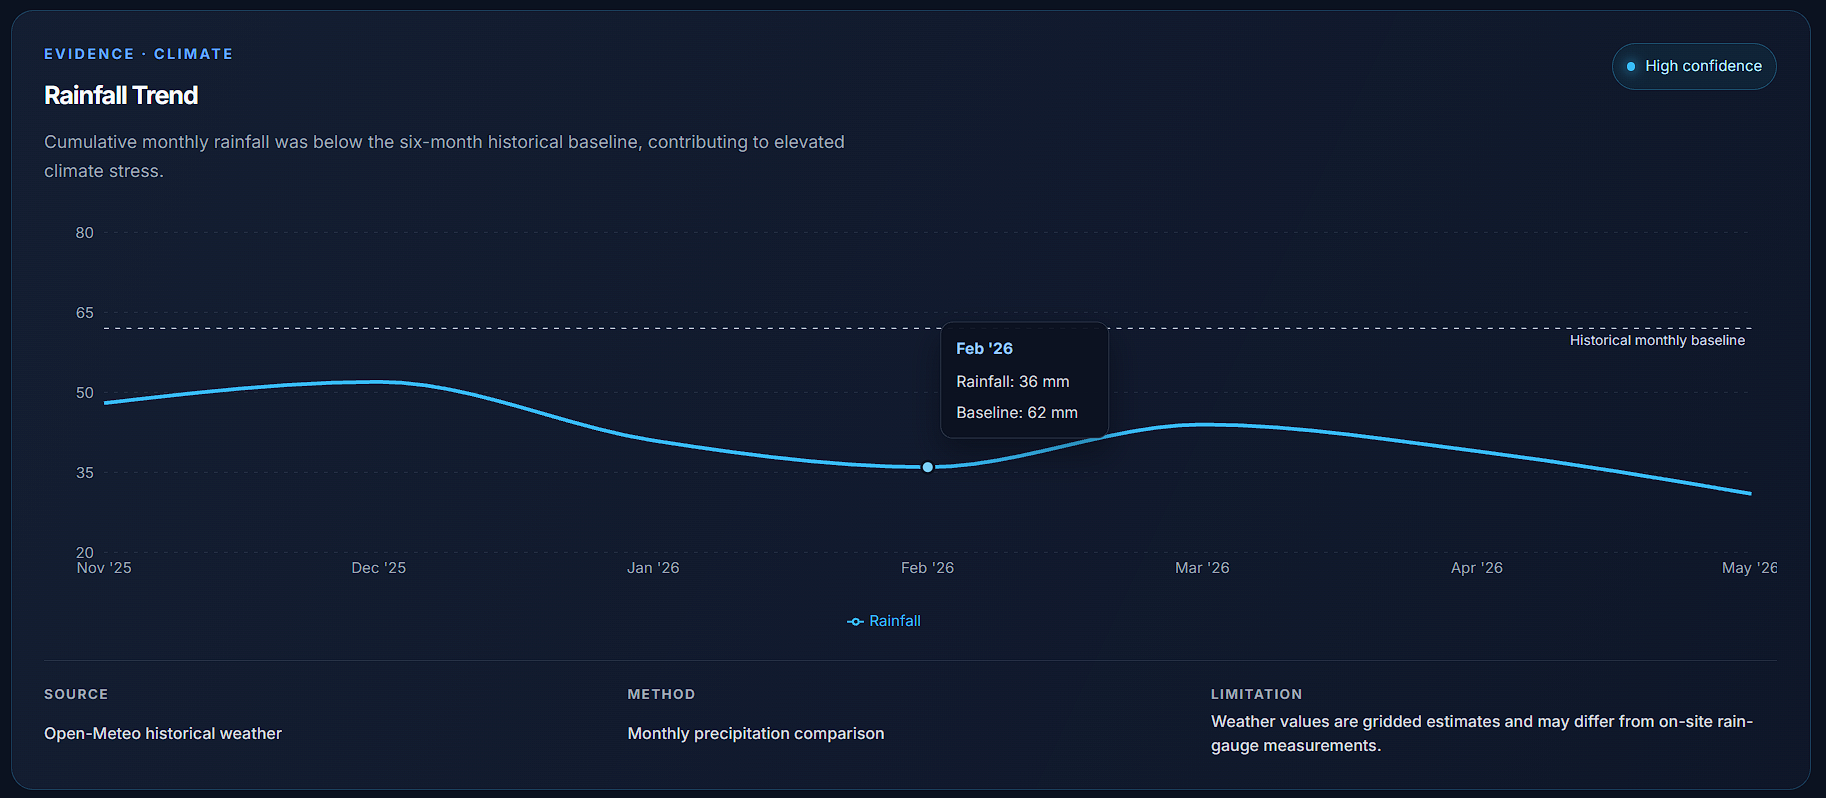
Rainfall Trend — Open-Meteo precipitation data showing rainfall below the historical baseline.
-
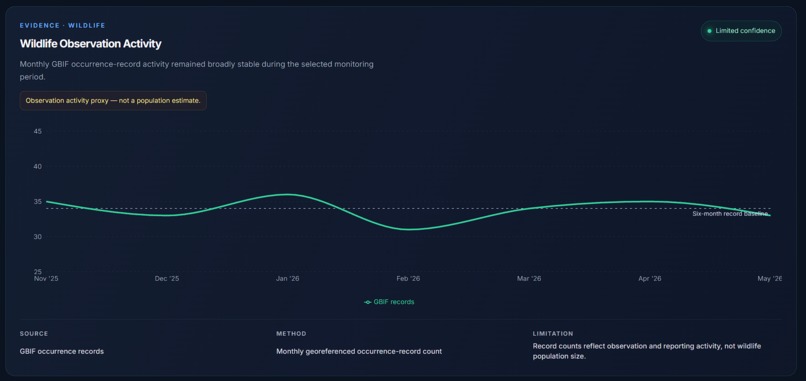
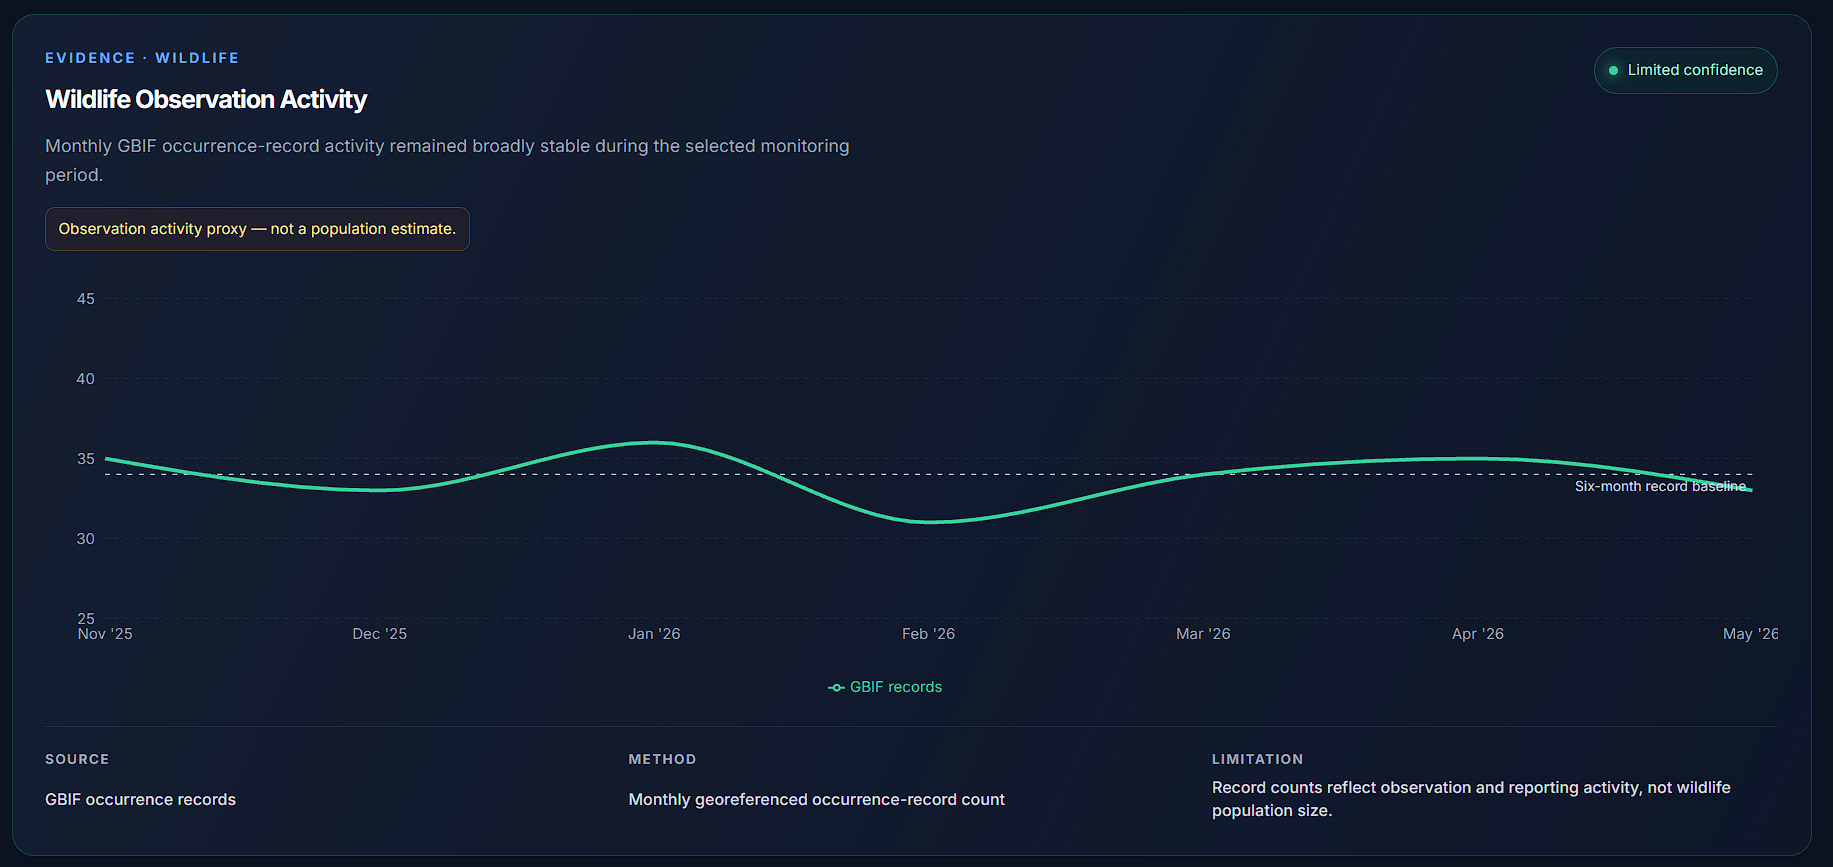
Wildlife Observation Activity — GBIF occurrence-record activity shown as a proxy, not a population estimate.
-
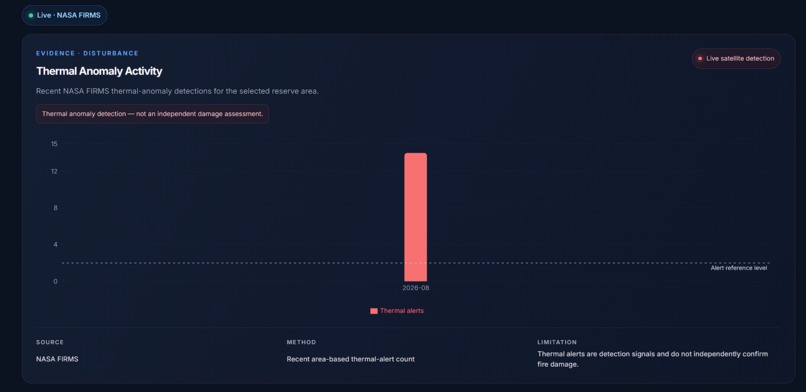
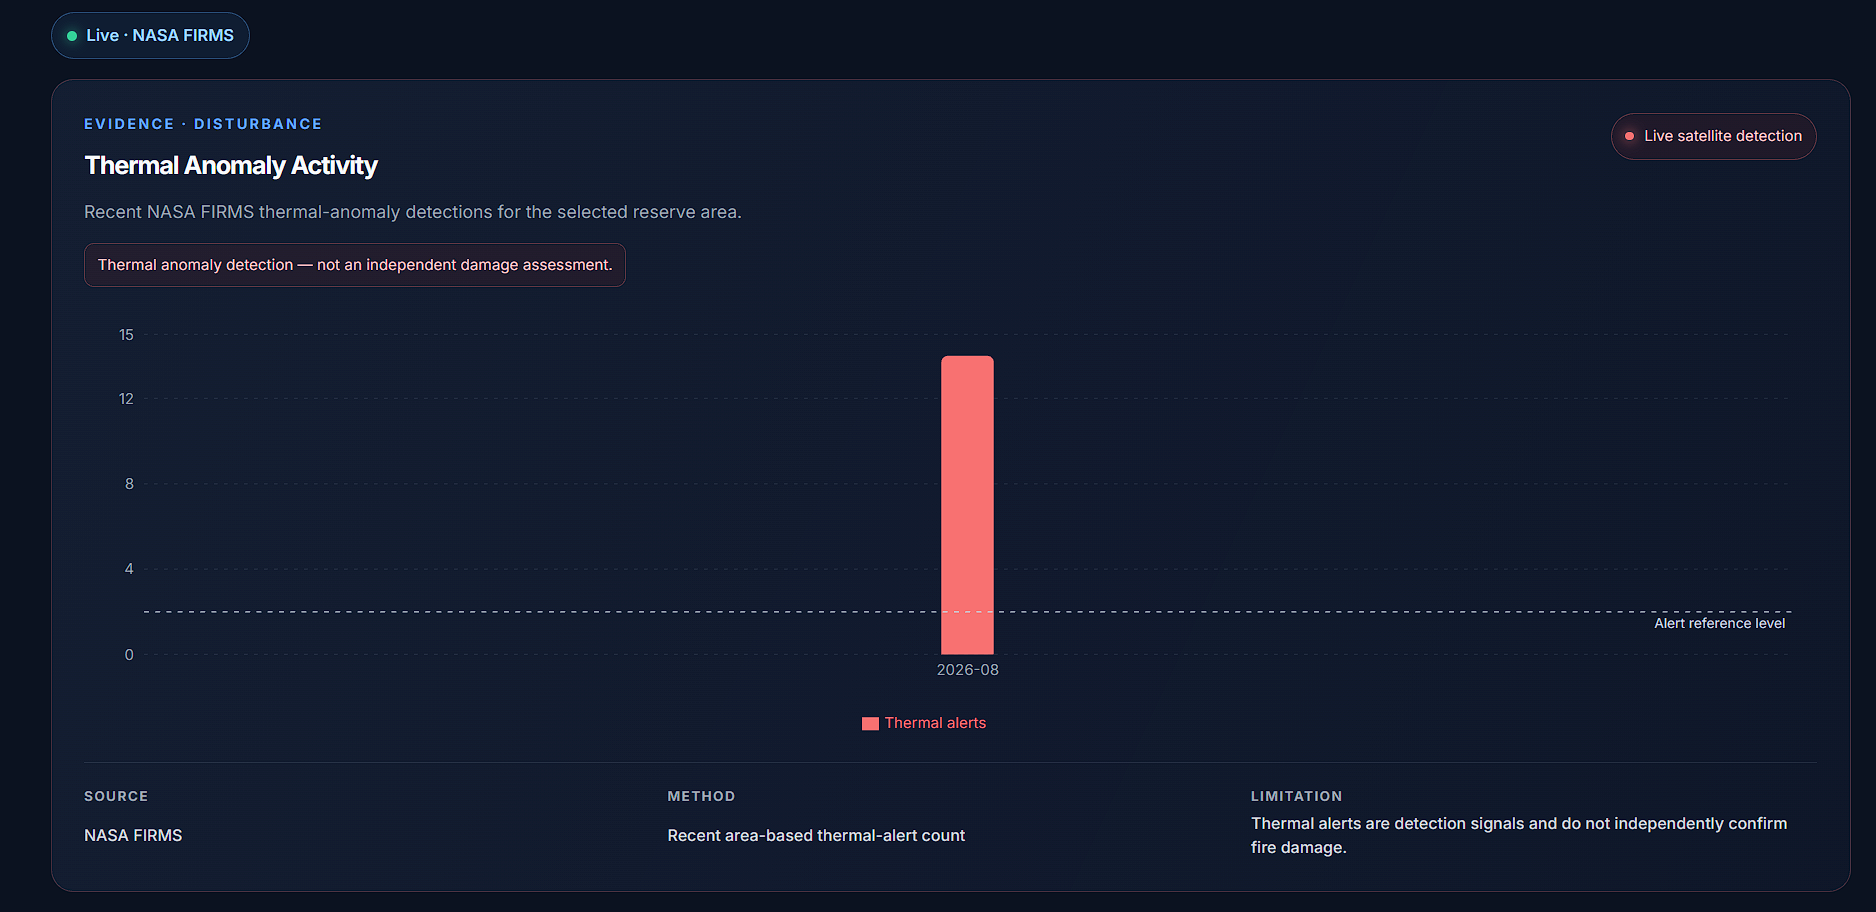
Disturbance Monitoring — live NASA FIRMS thermal-anomaly detections for the selected reserve area.
-
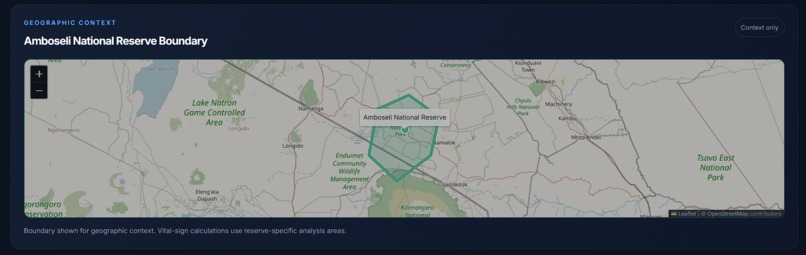
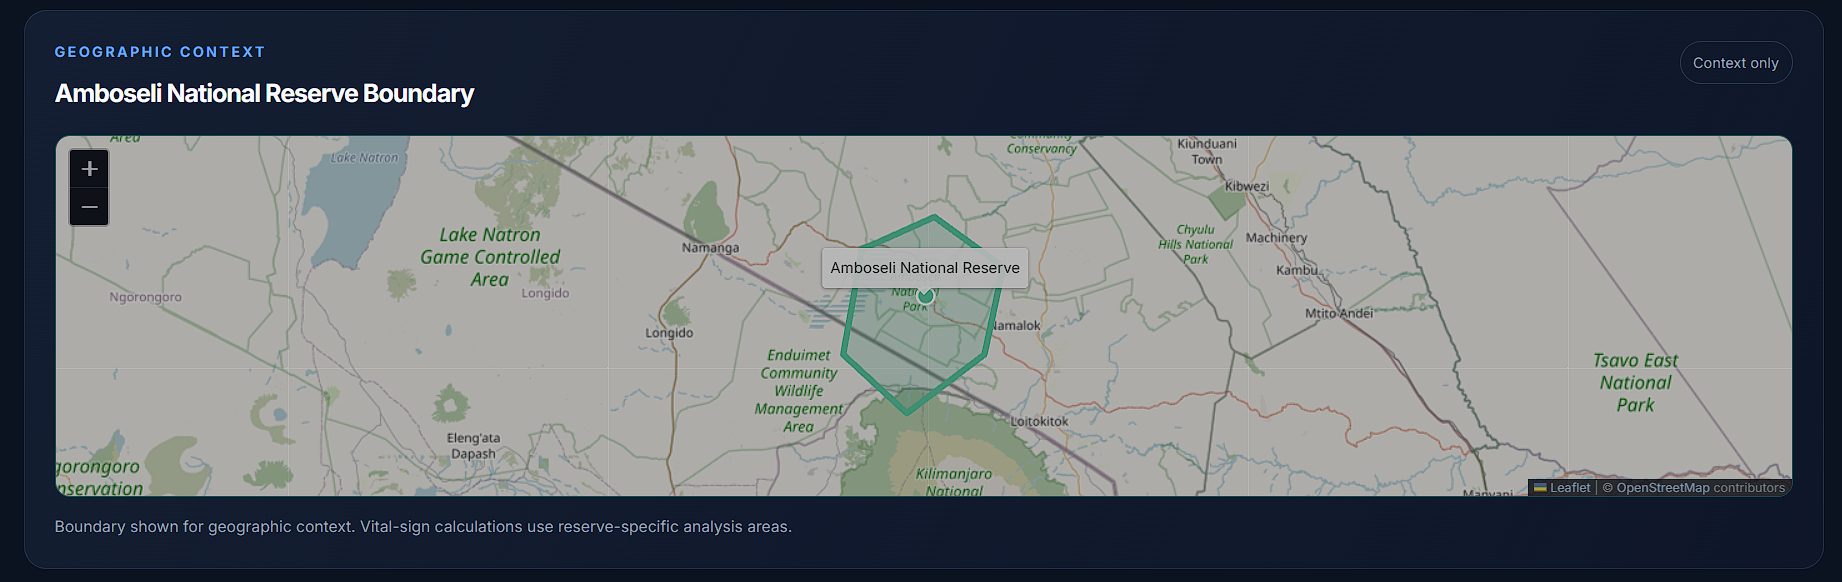
Geographic Context — map showing the boundary of Amboseli National Reserve.
-
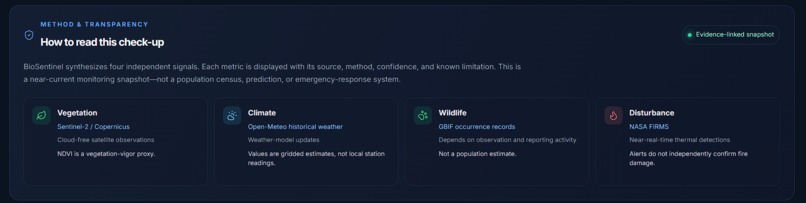
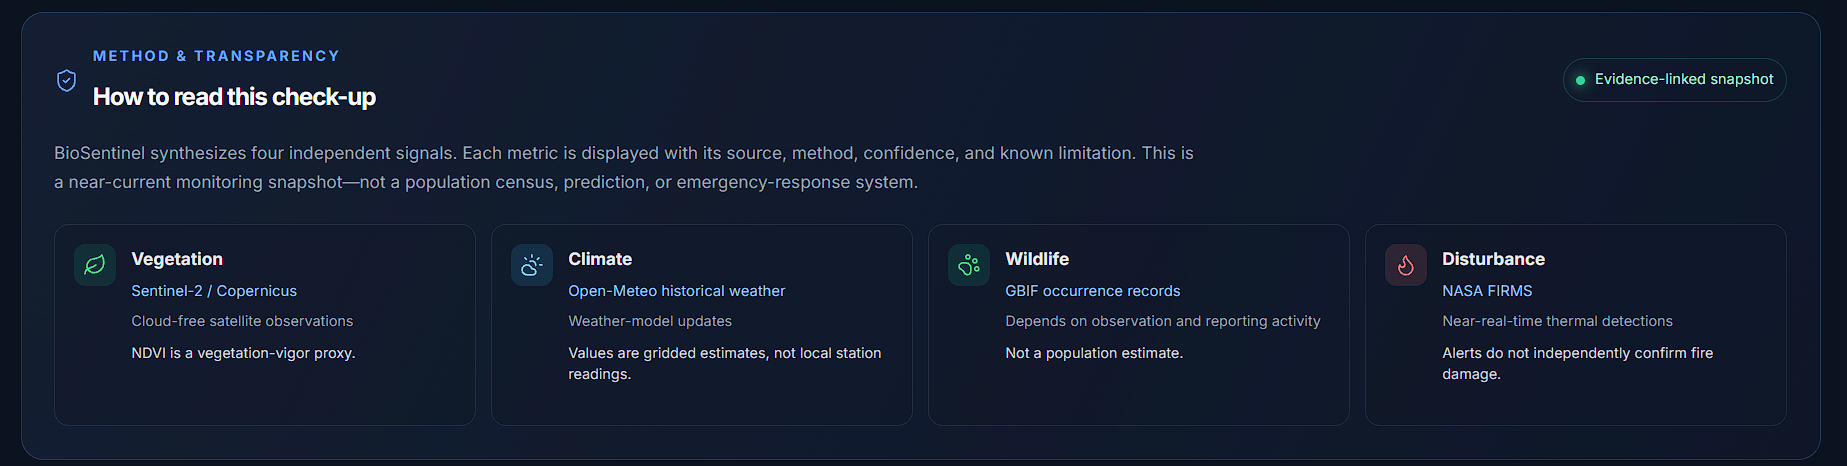
Method & Transparency — explaining how BioSentinel interprets each environmental signal and its limitations.
Inspiration
Protected ecosystems are under pressure from changing weather patterns, vegetation stress, habitat disturbance, and fire risk. Yet the data needed to understand these risks is often spread across technical platforms that are difficult for non-specialists to use quickly.
BioSentinel was inspired by a simple question: what if a nature reserve could have a clear health check-up, similar to the vital-signs monitor used for a patient? The goal was to turn complex environmental signals into an understandable view that helps people notice potential concerns early without hiding the evidence behind a single black-box score.
What it does
BioSentinel is an ecosystem “vital signs” dashboard for protected areas. It presents four key signals in one place:
- Vegetation Health
- Climate Stress
- Wildlife Activity
- Disturbance Risk
Users can select a supported reserve and view its overall status through clear green, amber, and red indicators. The dashboard includes an ecosystem summary, evidence context, and disturbance information based on NASA FIRMS satellite thermal alerts.
BioSentinel is designed to make environmental data easier to understand, not to replace field surveys or official scientific assessments. Wildlife activity is shown as an observation proxy, vegetation health represents vegetation vigour, and thermal alerts indicate detected heat anomalies rather than confirmed wildfire impact.
How we built it
We built BioSentinel as a responsive frontend web application using React, TypeScript, Vite, and CSS. The interface uses a dark, hospital-monitor-inspired visual system so the four ecosystem signals can be scanned quickly.
NASA FIRMS is integrated for live satellite-derived thermal-alert data used by the disturbance-risk indicator. The API key is stored securely with a VITE_FIRMS_MAP_KEY environment variable and configured through Vercel instead of being committed to GitHub.
We deployed the application on Vercel and connected it to GitHub for version control and automatic deployments. We also added an offline fallback so the dashboard remains usable if the live FIRMS request is unavailable.
Challenges we ran into
One of the main challenges was balancing an engaging dashboard with scientific honesty. Environmental data can be easy to oversimplify, so we avoided presenting the tool as a definitive ecosystem score or a prediction system.
Another challenge was making a live external data dependency reliable for a demo. API availability, network conditions, and deployment configuration can affect the user experience. We addressed this with environment-variable configuration, production deployment testing, and an offline fallback state rather than allowing missing live data to break the dashboard.
Accomplishments that we're proud of
We are proud that BioSentinel turns complex conservation signals into an interface that a non-technical user can understand quickly. The vital-signs metaphor gives the dashboard a clear purpose without treating environmental conditions as a vague or abstract analytics problem.
We are also proud of the project’s deployment readiness: it is publicly accessible, documented, linked to a GitHub repository, configured without exposing the API key, and designed to remain usable when live thermal-alert data is unavailable.
What we learned
We learned that environmental technology needs both clarity and humility. A polished interface can make data more accessible, but it must also communicate what each signal can and cannot prove.
We also learned practical lessons about integrating external APIs, securing keys with deployment environment variables, building fallback states for real-world reliability, and deploying a frontend application with GitHub and Vercel.
What's next for BioSentinel
Next, we want to expand BioSentinel with more validated live data pipelines for vegetation, climate, biodiversity observations, and reserve boundaries. We would also add more protected areas, clearer per-signal confidence indicators, historical comparisons, and deeper click-to-verify links between summaries and the source data behind them.
Our long-term goal is to make ecosystem monitoring more accessible to conservation organisations, reserve managers, and communities that need a simple, evidence-aware way to understand environmental change.
Built With
- api
- conservation
- css
- data
- environmental
- firms
- github
- html
- javascript
- monitoring
- nasa
- react
- rest
- satellite
- typescript
- vercel
- vite

Log in or sign up for Devpost to join the conversation.