Inspiration
San Diego is one of the most biodiverse counties in the US — and one of the most threatened. We kept seeing headlines about endangered species, but nothing that showed how losing one species affects everything else. We wanted to build something that made ecological collapse tangible, not abstract.
What We Built
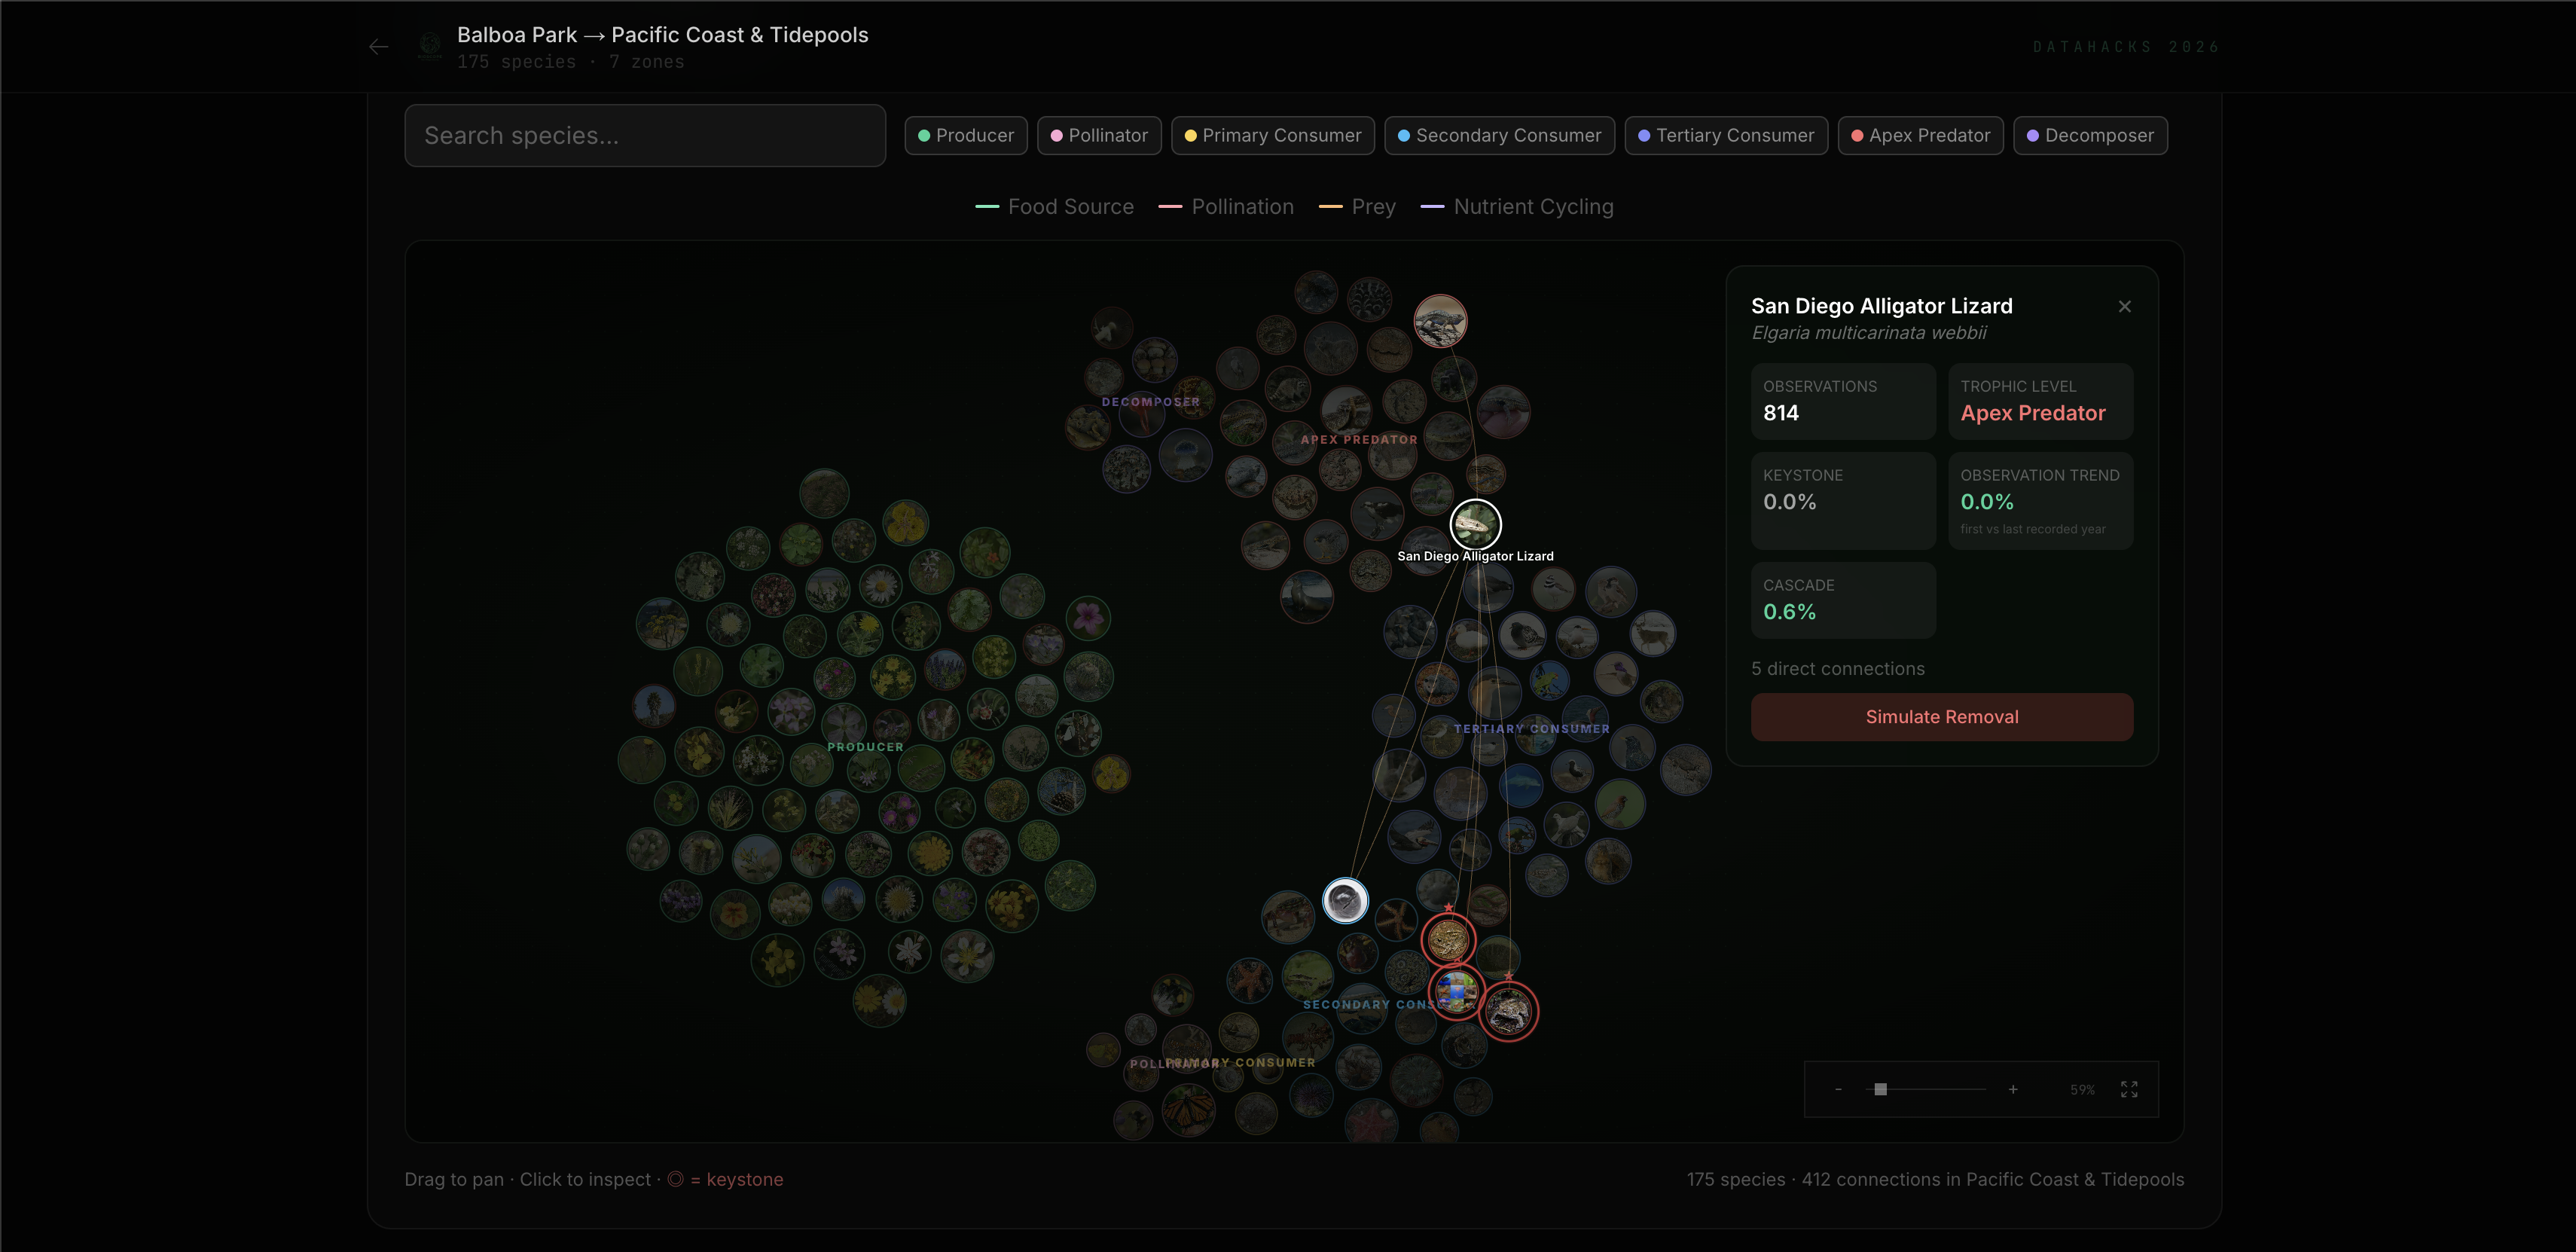
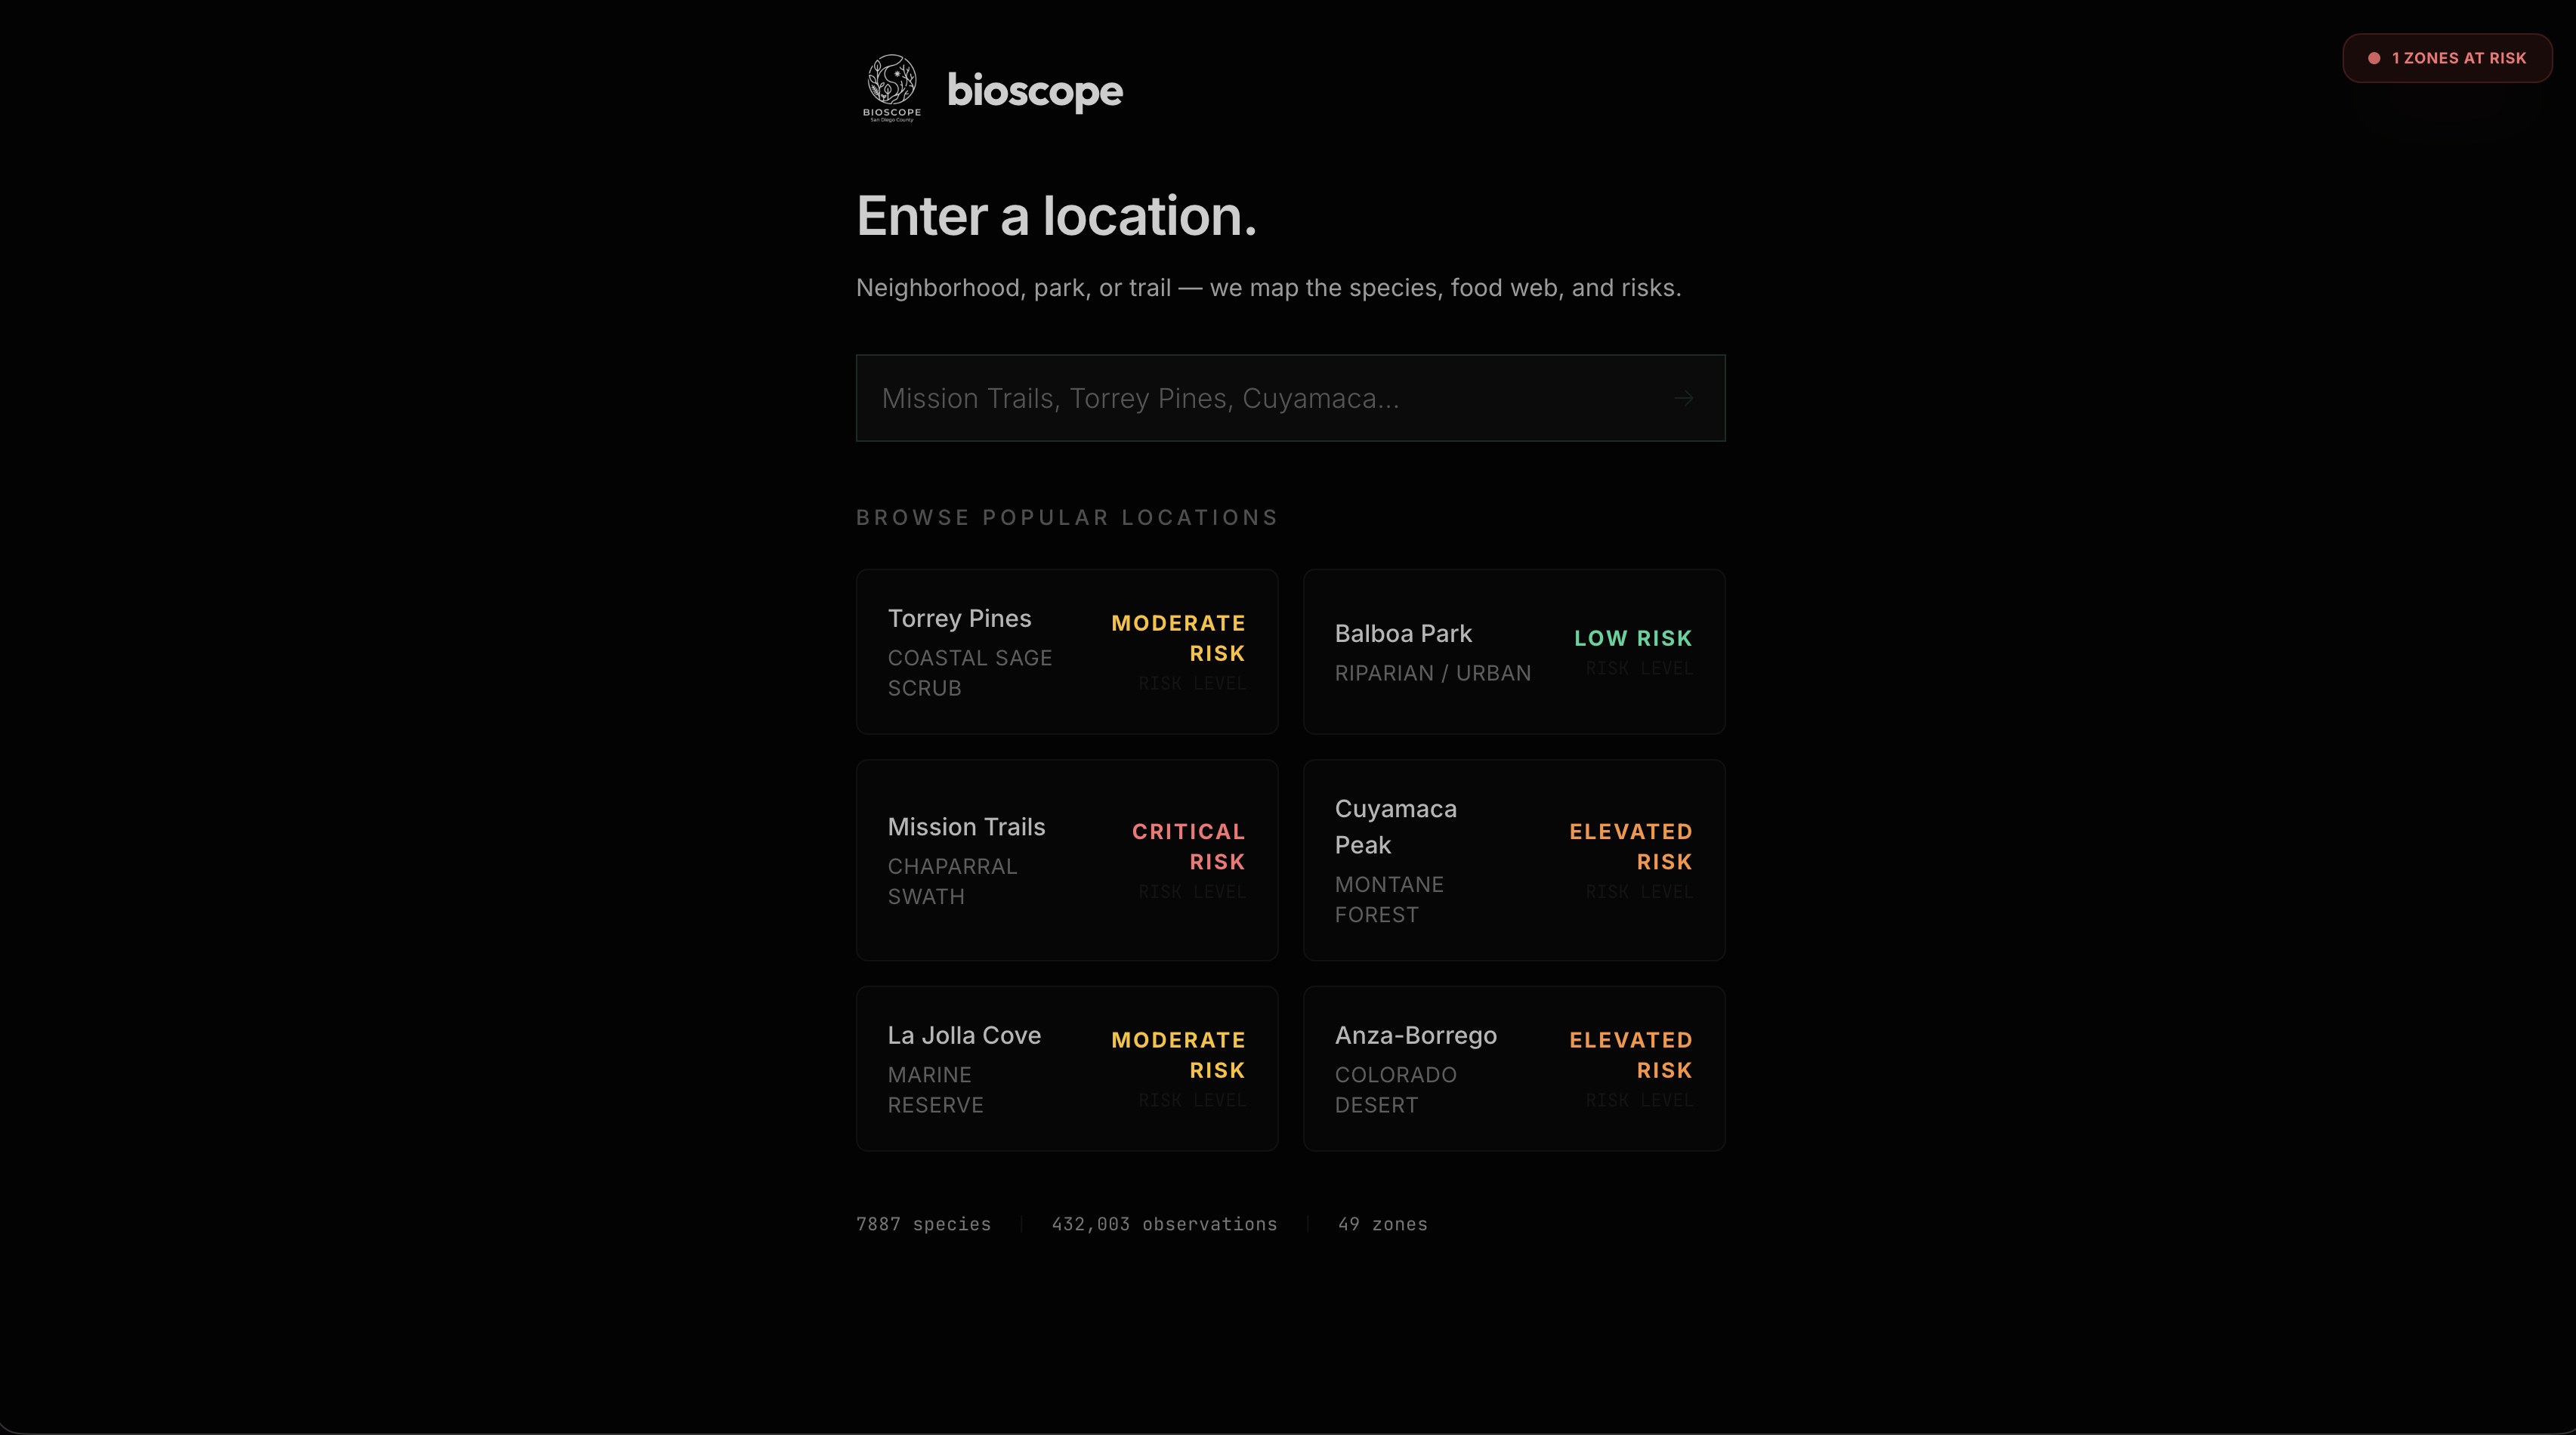
BioScope transforms 432k iNaturalist citizen science observations into a biodiversity intelligence platform. You enter any San Diego neighborhood or park, and we map its food web, flag declining species, and identify keystones — the ones the ecosystem can't afford to lose.
How We Built It
- Data pipeline: iNaturalist API → S3 → Snowflake (432K rows, 49 regional zones) Graph engine: Trophic chain rules assign edges; cascade removal simulation, computes keystone scores
- AI reports: Gemini 2.0 Flash generates zone-specific conservation reports from structured cascade + decline data — not generic summaries
- Snowflake Cortex: Ecological analysis runs inside the warehouse via mistral-large
- Frontend: Next.js 14, d3-force graph visualization, framer-motion
Challenges
Getting the graph data to feel ecologically real was harder than expected. Random edges produced nonsense — we had to build trophic-level classification from taxon classes and enforce directional feeding rules. We also fought Snowflake connection pooling in serverless Lambda environments, and built a full fallback chain (Snowflake → S3 → local) to keep the demo stable.
What We Learned
Citizen science data is messy but powerful. The gap between "we have observations" and "we have intelligence" is where the real work lives — and that's exactly where we built.
Built With
- amazon-web-services
- aws-api-gateway
- aws-lambda
- d3-force
- databricks
- digitalocean-app-platform
- framer-motion
- globi-api
- google-gemini-2.0-flash
- inaturalist-api
- next.js-14
- numpy
- python
- snowflake-(cortex-ai)
- tailwind-css
- typescript


Log in or sign up for Devpost to join the conversation.