-
-

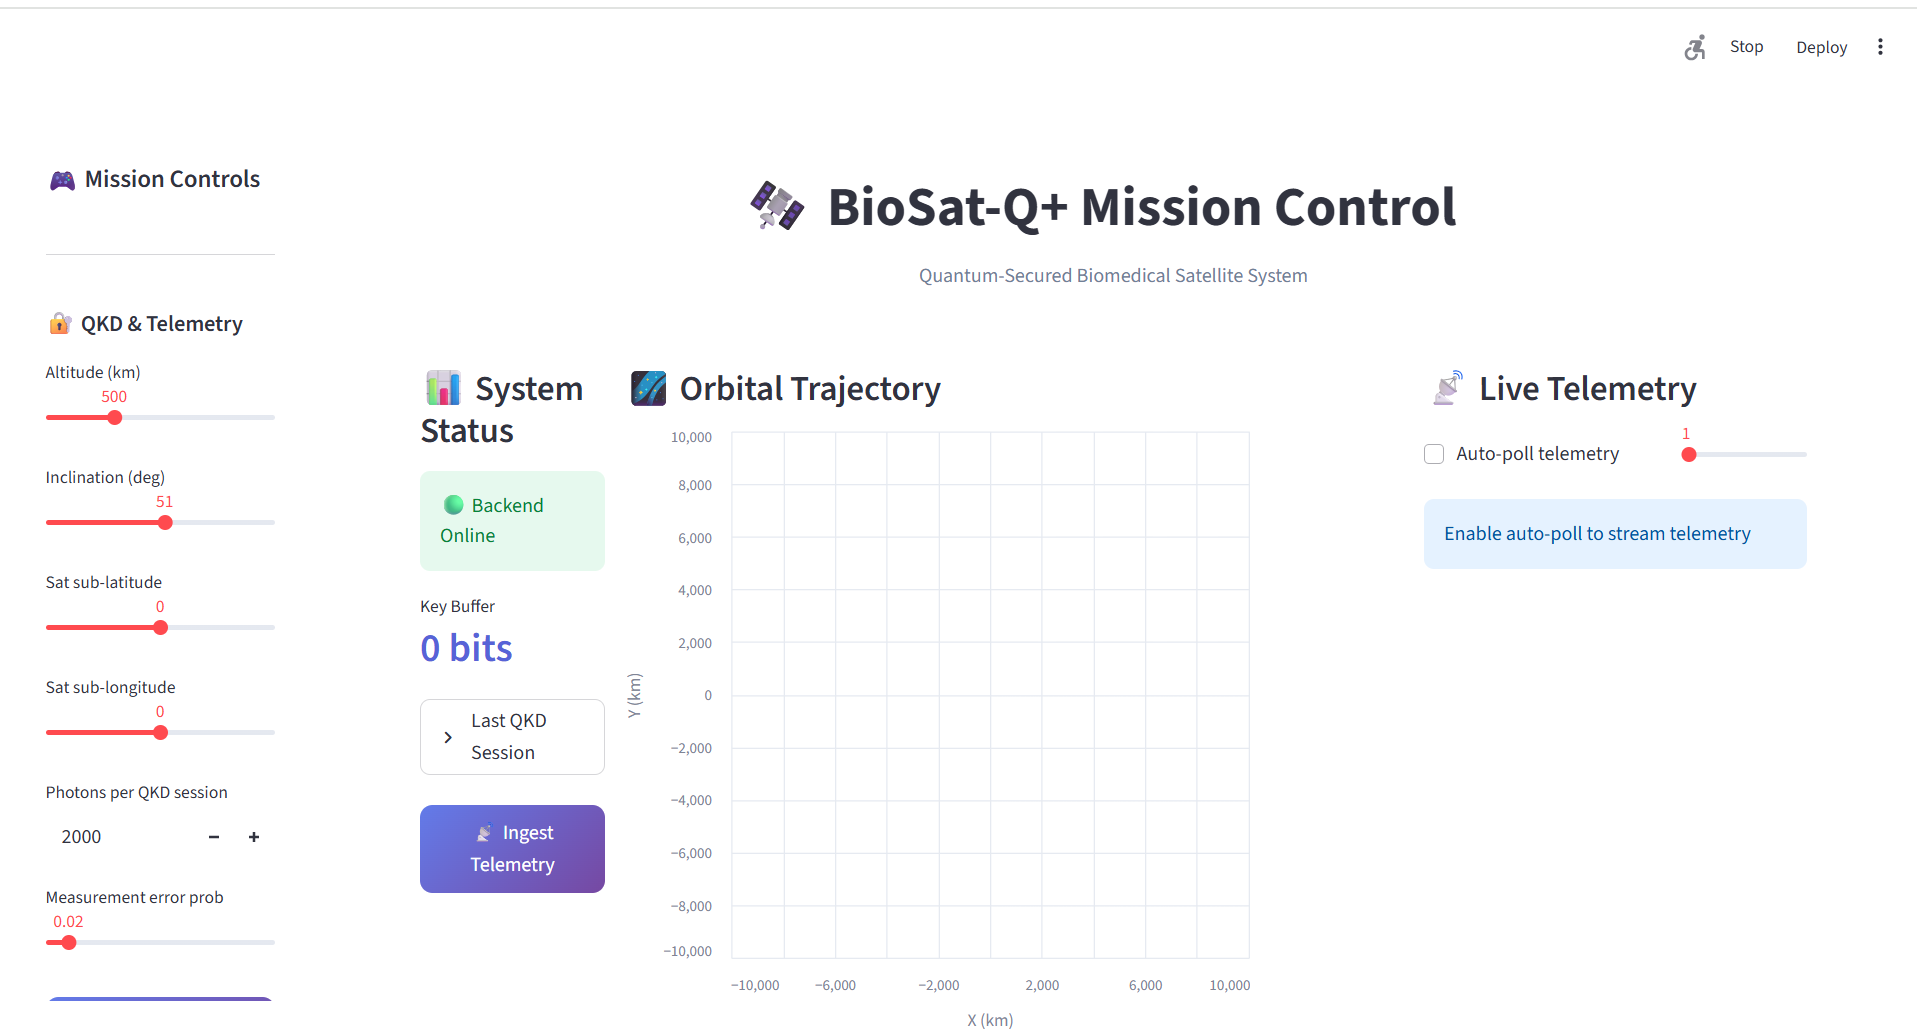
Home Screen for the Mission Control Dashboard
Inspiration
The primary inspiration for BioSat-Q+ was addressing the critical vulnerabilities of long-duration space missions, particularly concerning astronaut health and communication security. We wanted to build a proof-of-concept that seamlessly integrates real-time biological and environmental telemetry with state-of-the-art quantum-safe cryptographic infrastructure. The goal was to visualize this complex data in a way that allows ground control to instantly assess both biological risk (via ML) and communication security (via QKD key reserves).
What it does
BioSat-Q+ is a full-stack, simulated mission dashboard that performs three core functions:
Orbital Visualization: Simulates the two-body orbital mechanics of a primary satellite, including the eccentricity of its trajectory, and tracks surrounding space debris or a peer constellation in real-time.
Telemetry Ingestion & Risk Analysis: Ingests simulated sensor data (Heart Rate, SpO2, Temperature) and environmental factors (Radiation). A backend Machine Learning model calculates the instantaneous Risk Probability (RiskProb) of a system anomaly or biohazard.
Quantum Security Monitoring: Monitors the status of the on-board Quantum Key Distribution (QKD) system, showing the available secure key material in the Key Buffer Length (KeyBufLen).
How we built it
The project uses a standard but robust stack for data science and web applications:
Backend (Data & Logic): FastAPI provides the REST API endpoints. It hosts the Python functions for orbital mechanics, telemetry simulation, and the core QML (simulated) risk calculation.
Frontend (Dashboard): Streamlit is used for rapid dashboard development, utilizing its powerful layout and state management features.
Visualization: Altair is employed for the data visualizations, enabling smooth, interactive, and layered charts for the orbital animation and the time-series telemetry plots.
Interoperability: requests is used in the frontend to continuously poll the FastAPI endpoints, creating the feeling of a live, dynamic system.
Challenges we ran into
The primary technical challenge was achieving smooth, non-flickering animation in the Streamlit environment while running a computationally intensive loop.
Animation Stability: Initially, rapid Altair chart updates caused significant visual flashing due to rendering conflicts. This was solved by precisely tuning the time.sleep() delay (0.05 seconds) and properly utilizing Streamlit's st.empty() placeholder pattern.
Visualization Overlap: Ensuring the orbital trajectory chart was correctly sized within the Streamlit column layout to prevent it from overlapping other critical metrics was resolved by using the st.columns feature with explicit proportional sizing ([1, 2, 1.5]).
Data Scaling: Properly scaling the Earth's radius within the Altair scatter plot was key to preventing the satellite markers from visually obscuring the center point, which was solved by passing the earth_radius from the backend to the frontend.
Accomplishments that we're proud of
We are most proud of the seamless integration of three complex scientific concepts—orbital mechanics, biological telemetry, and quantum cryptography—into one cohesive, real-time dashboard. Specifically:
Creating a stable, continuous orbital animation using Python and Altair, which is often difficult in Streamlit.
The effective use of the three-column layout to present a vast amount of data (status, chart, stream) without visual clutter.
Designing the risk monitoring chart, which clearly correlates the machine-learned risk probability (RiskProb) with the system's security readiness (KeyBufLen).
What we learned
This project provided deep insight into the practical challenges of integrating complex Python scientific calculations (like numpy-based orbital mechanics) with modern asynchronous web backends (FastAPI) and reactive frontends (Streamlit). We learned the importance of minute timing adjustments for smooth front-end performance when relying on continuous, iterative updates.
What's next for BioSat-Q+
Future development of BioSat-Q+ could focus on:
Geolocation Integration: Displaying the ground track (sub-point) of the satellite on a world map using libraries like folium or pydeck.
Alerting System: Implementing real-time push notifications or visual alerts within the dashboard when RiskProb exceeds a predefined threshold or when KeyBufLen drops below a critical level.
Advanced QKD Simulation: Incorporating realistic atmospheric and optical link budget modeling to make the QKD success rate dynamically responsive to the satellite's altitude and location.


Log in or sign up for Devpost to join the conversation.