-
-
-
The Dashboard
-
Hardware-1
-
Hardware-2
-
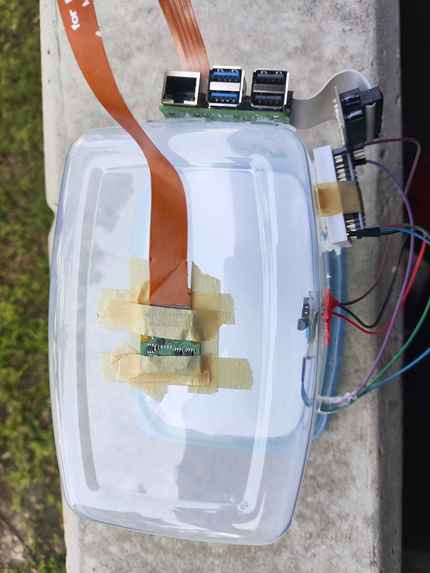
The Camera-3
-
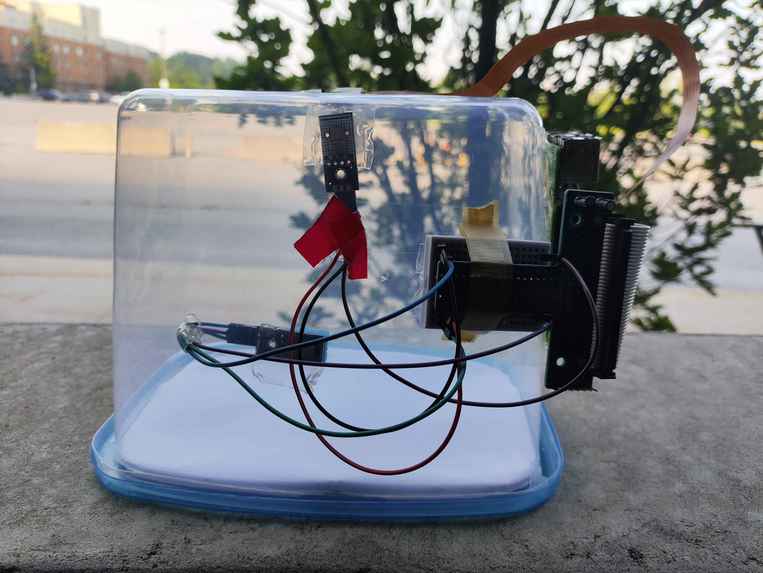
Hardware-4
-
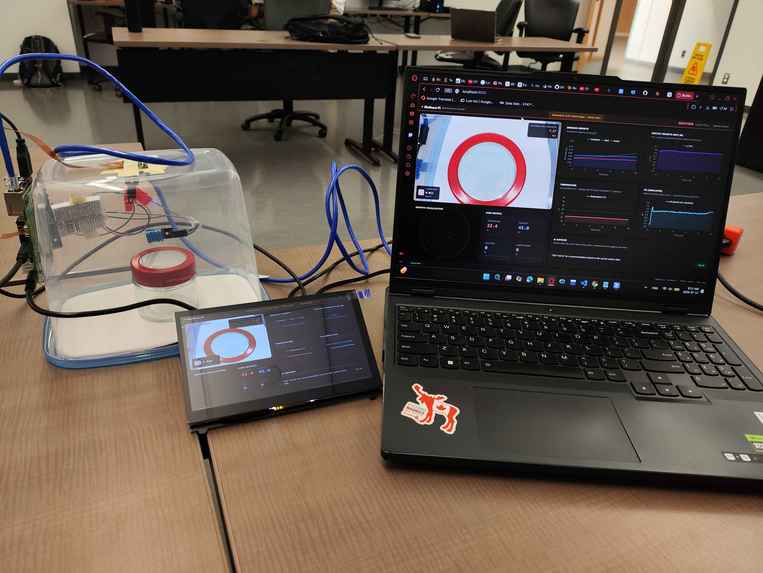
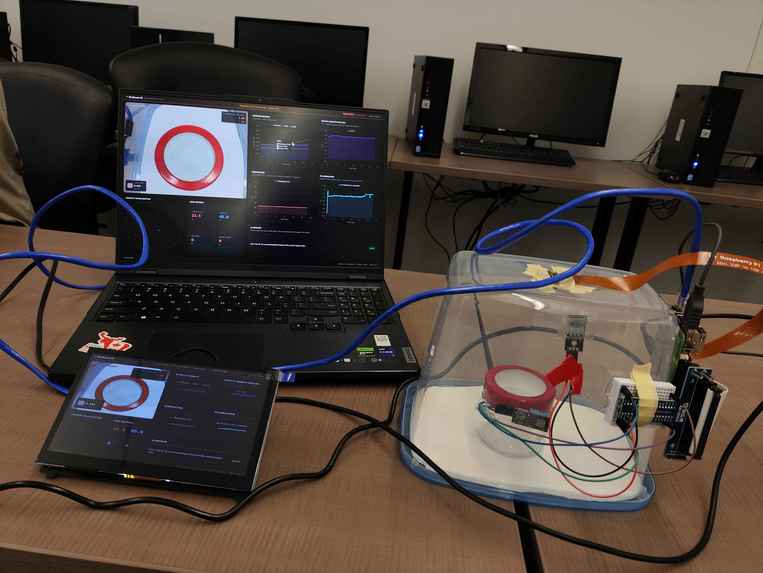
Entire Running Project
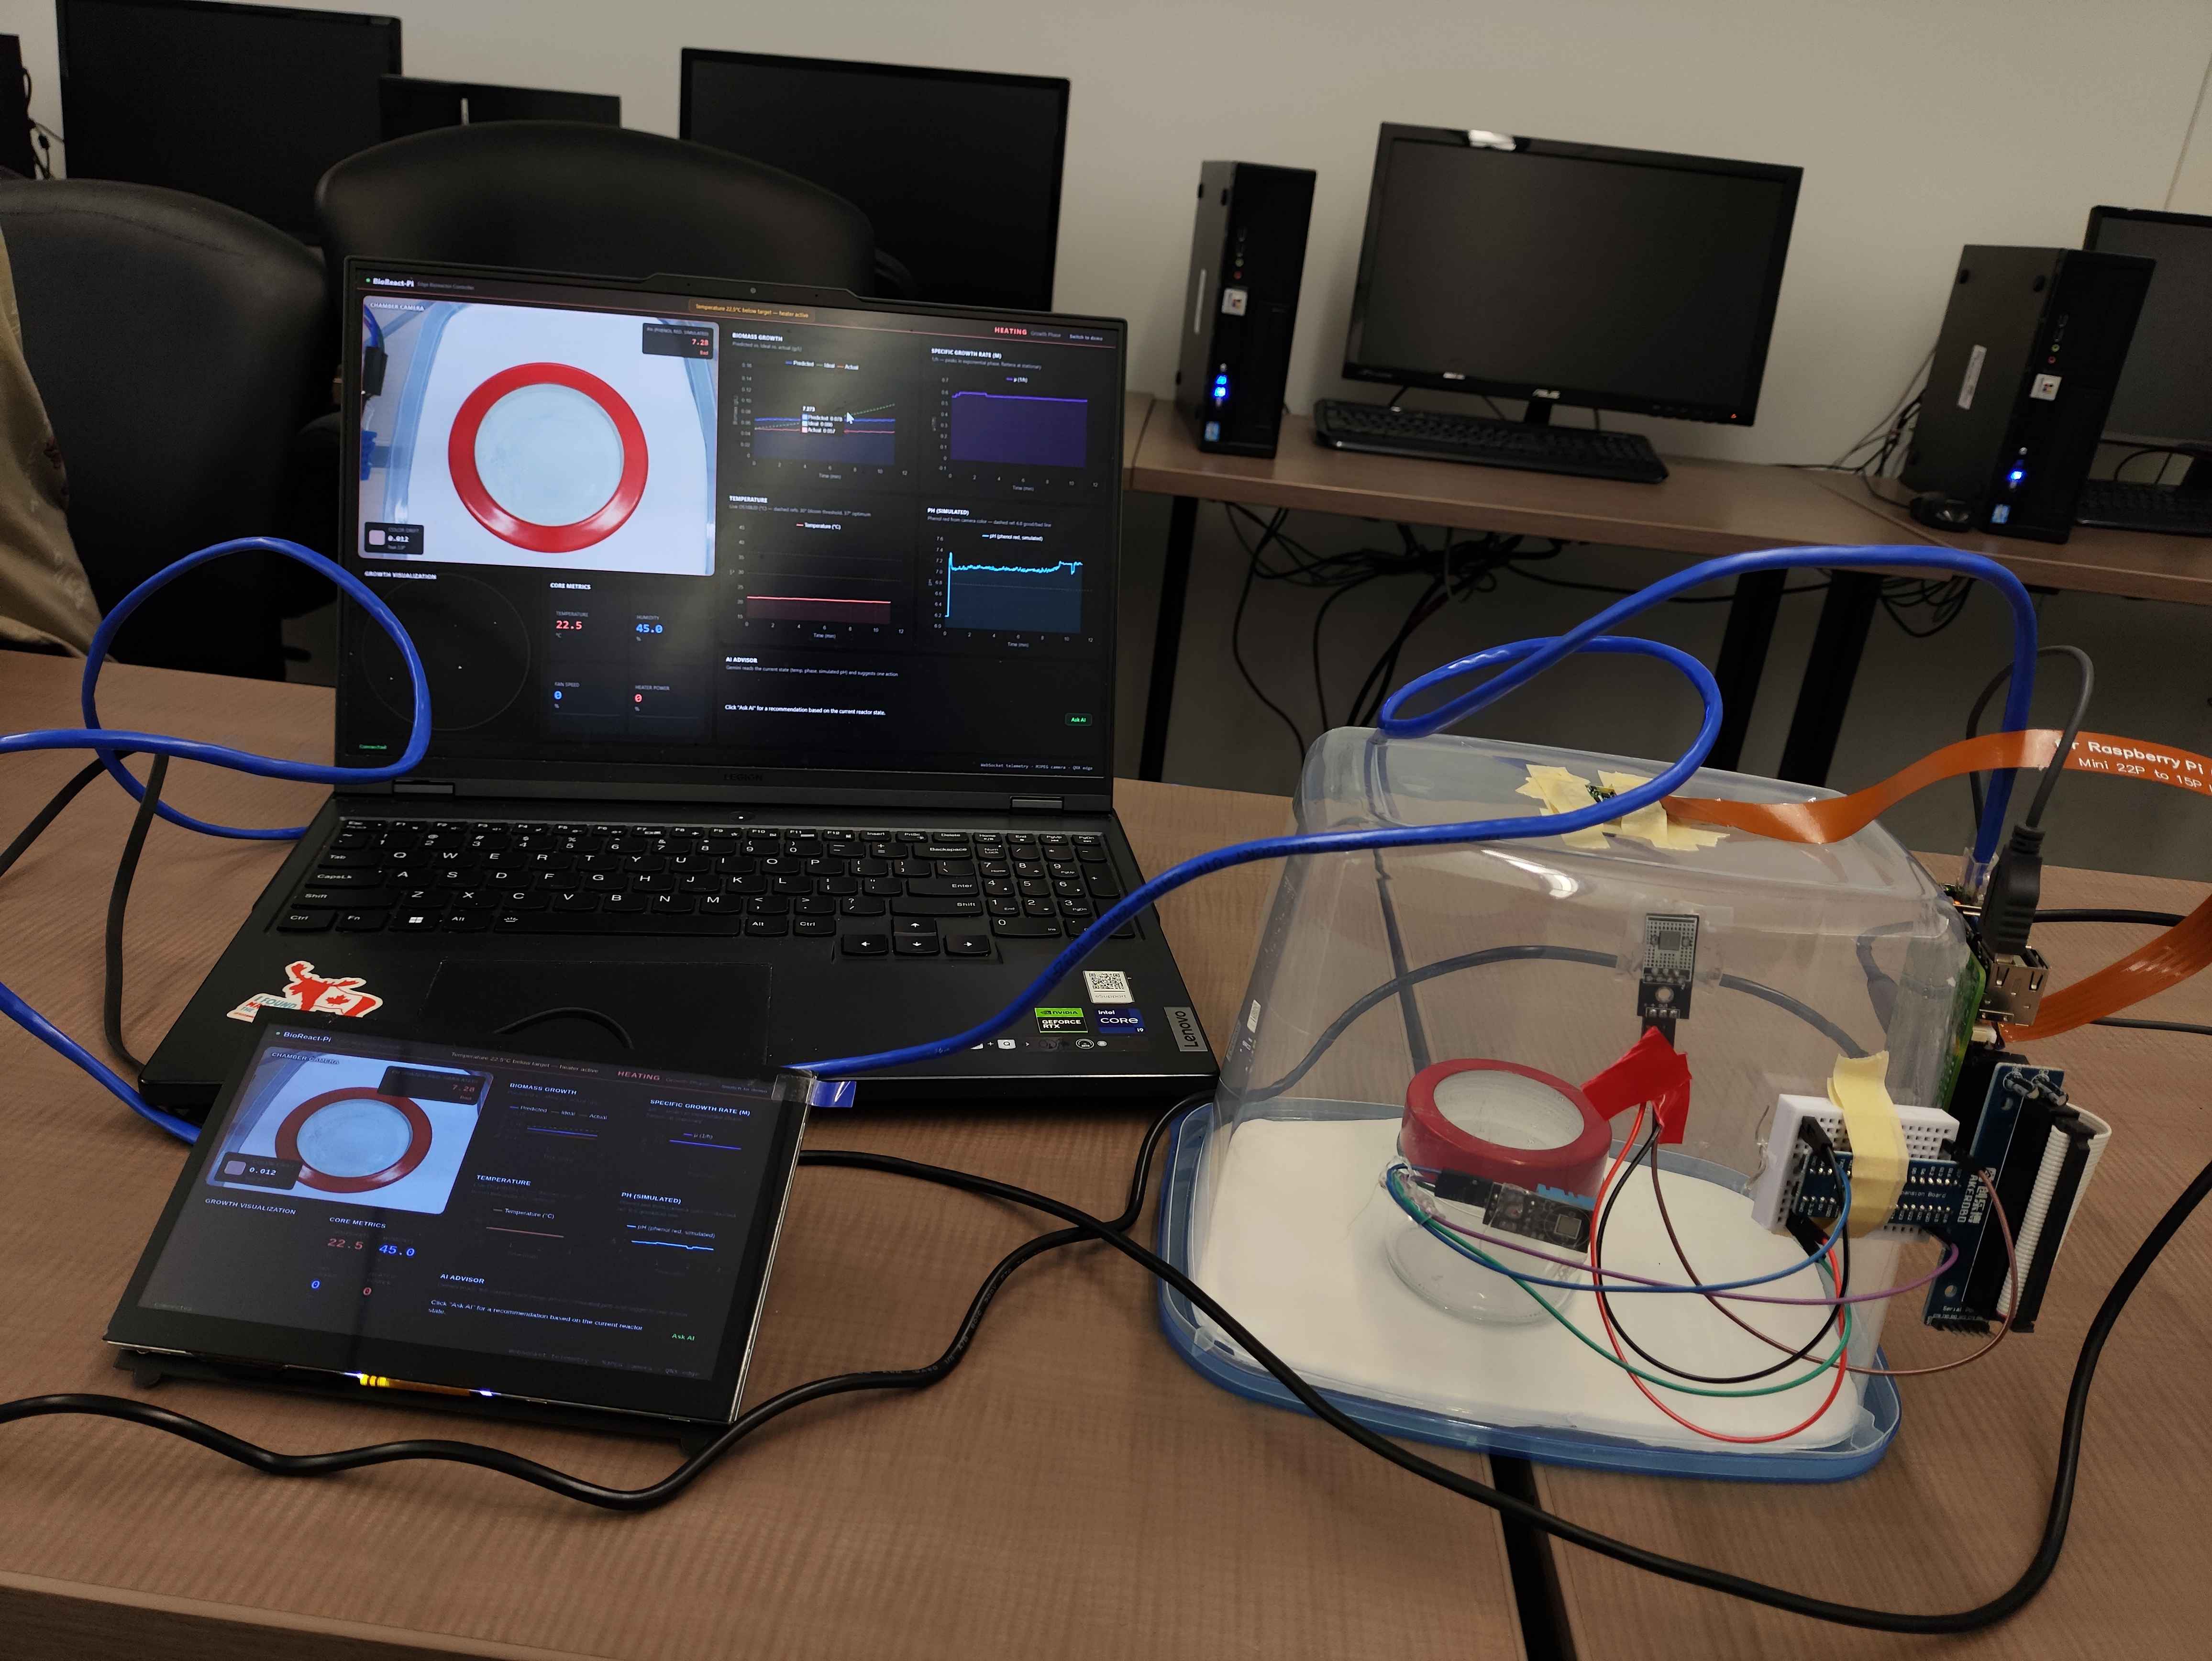
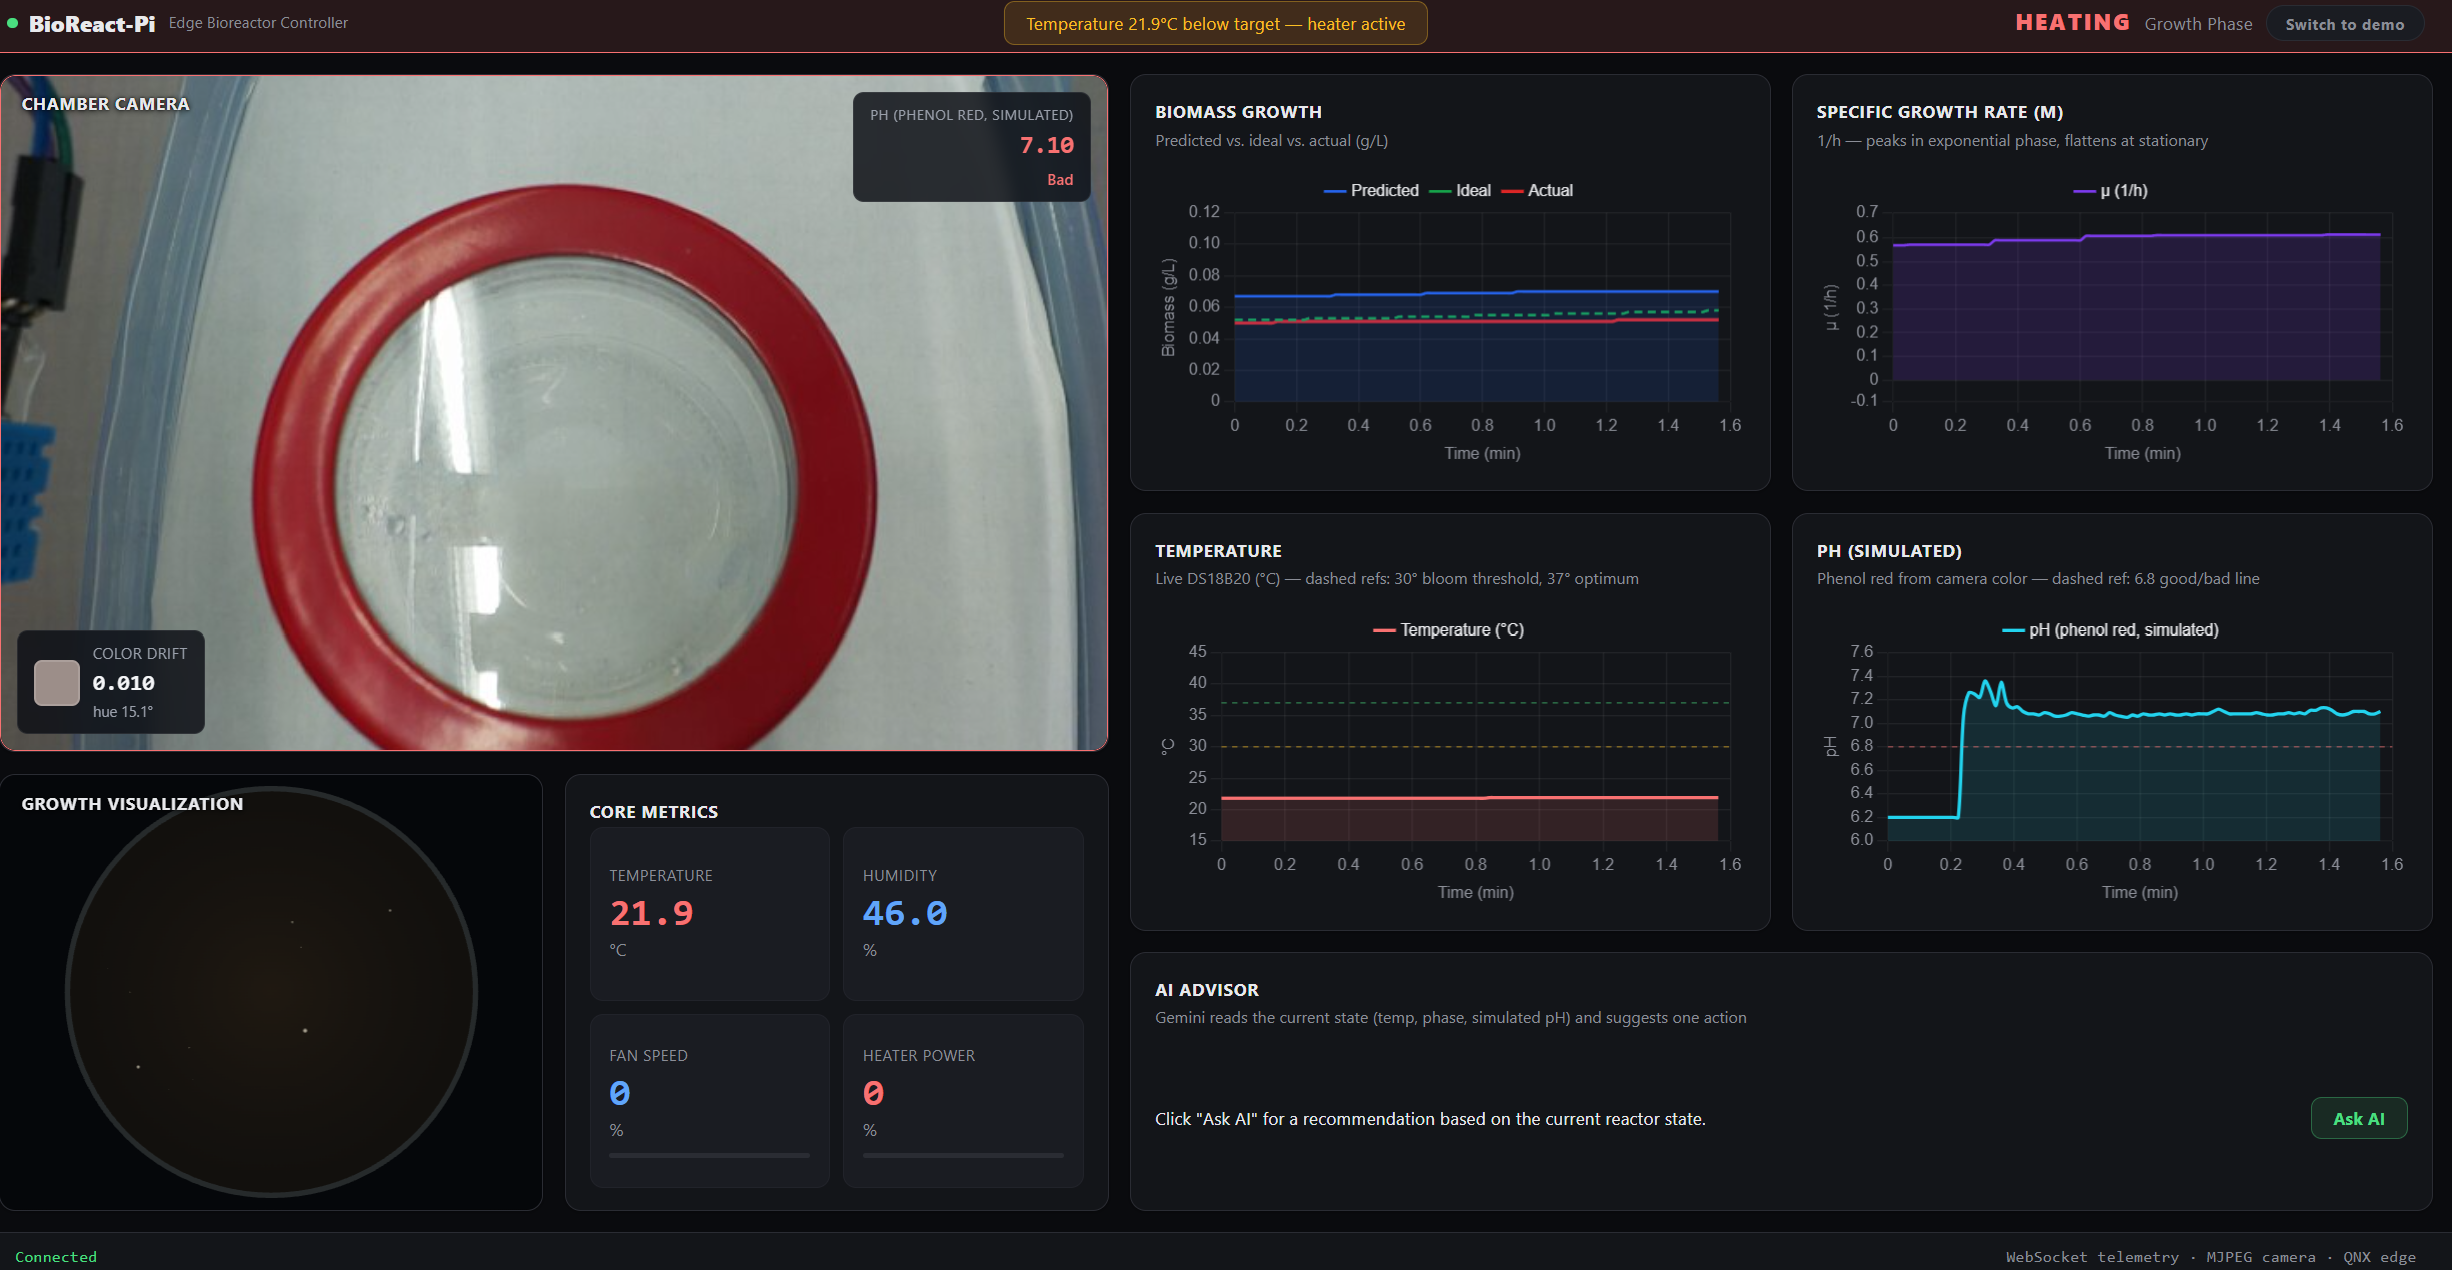
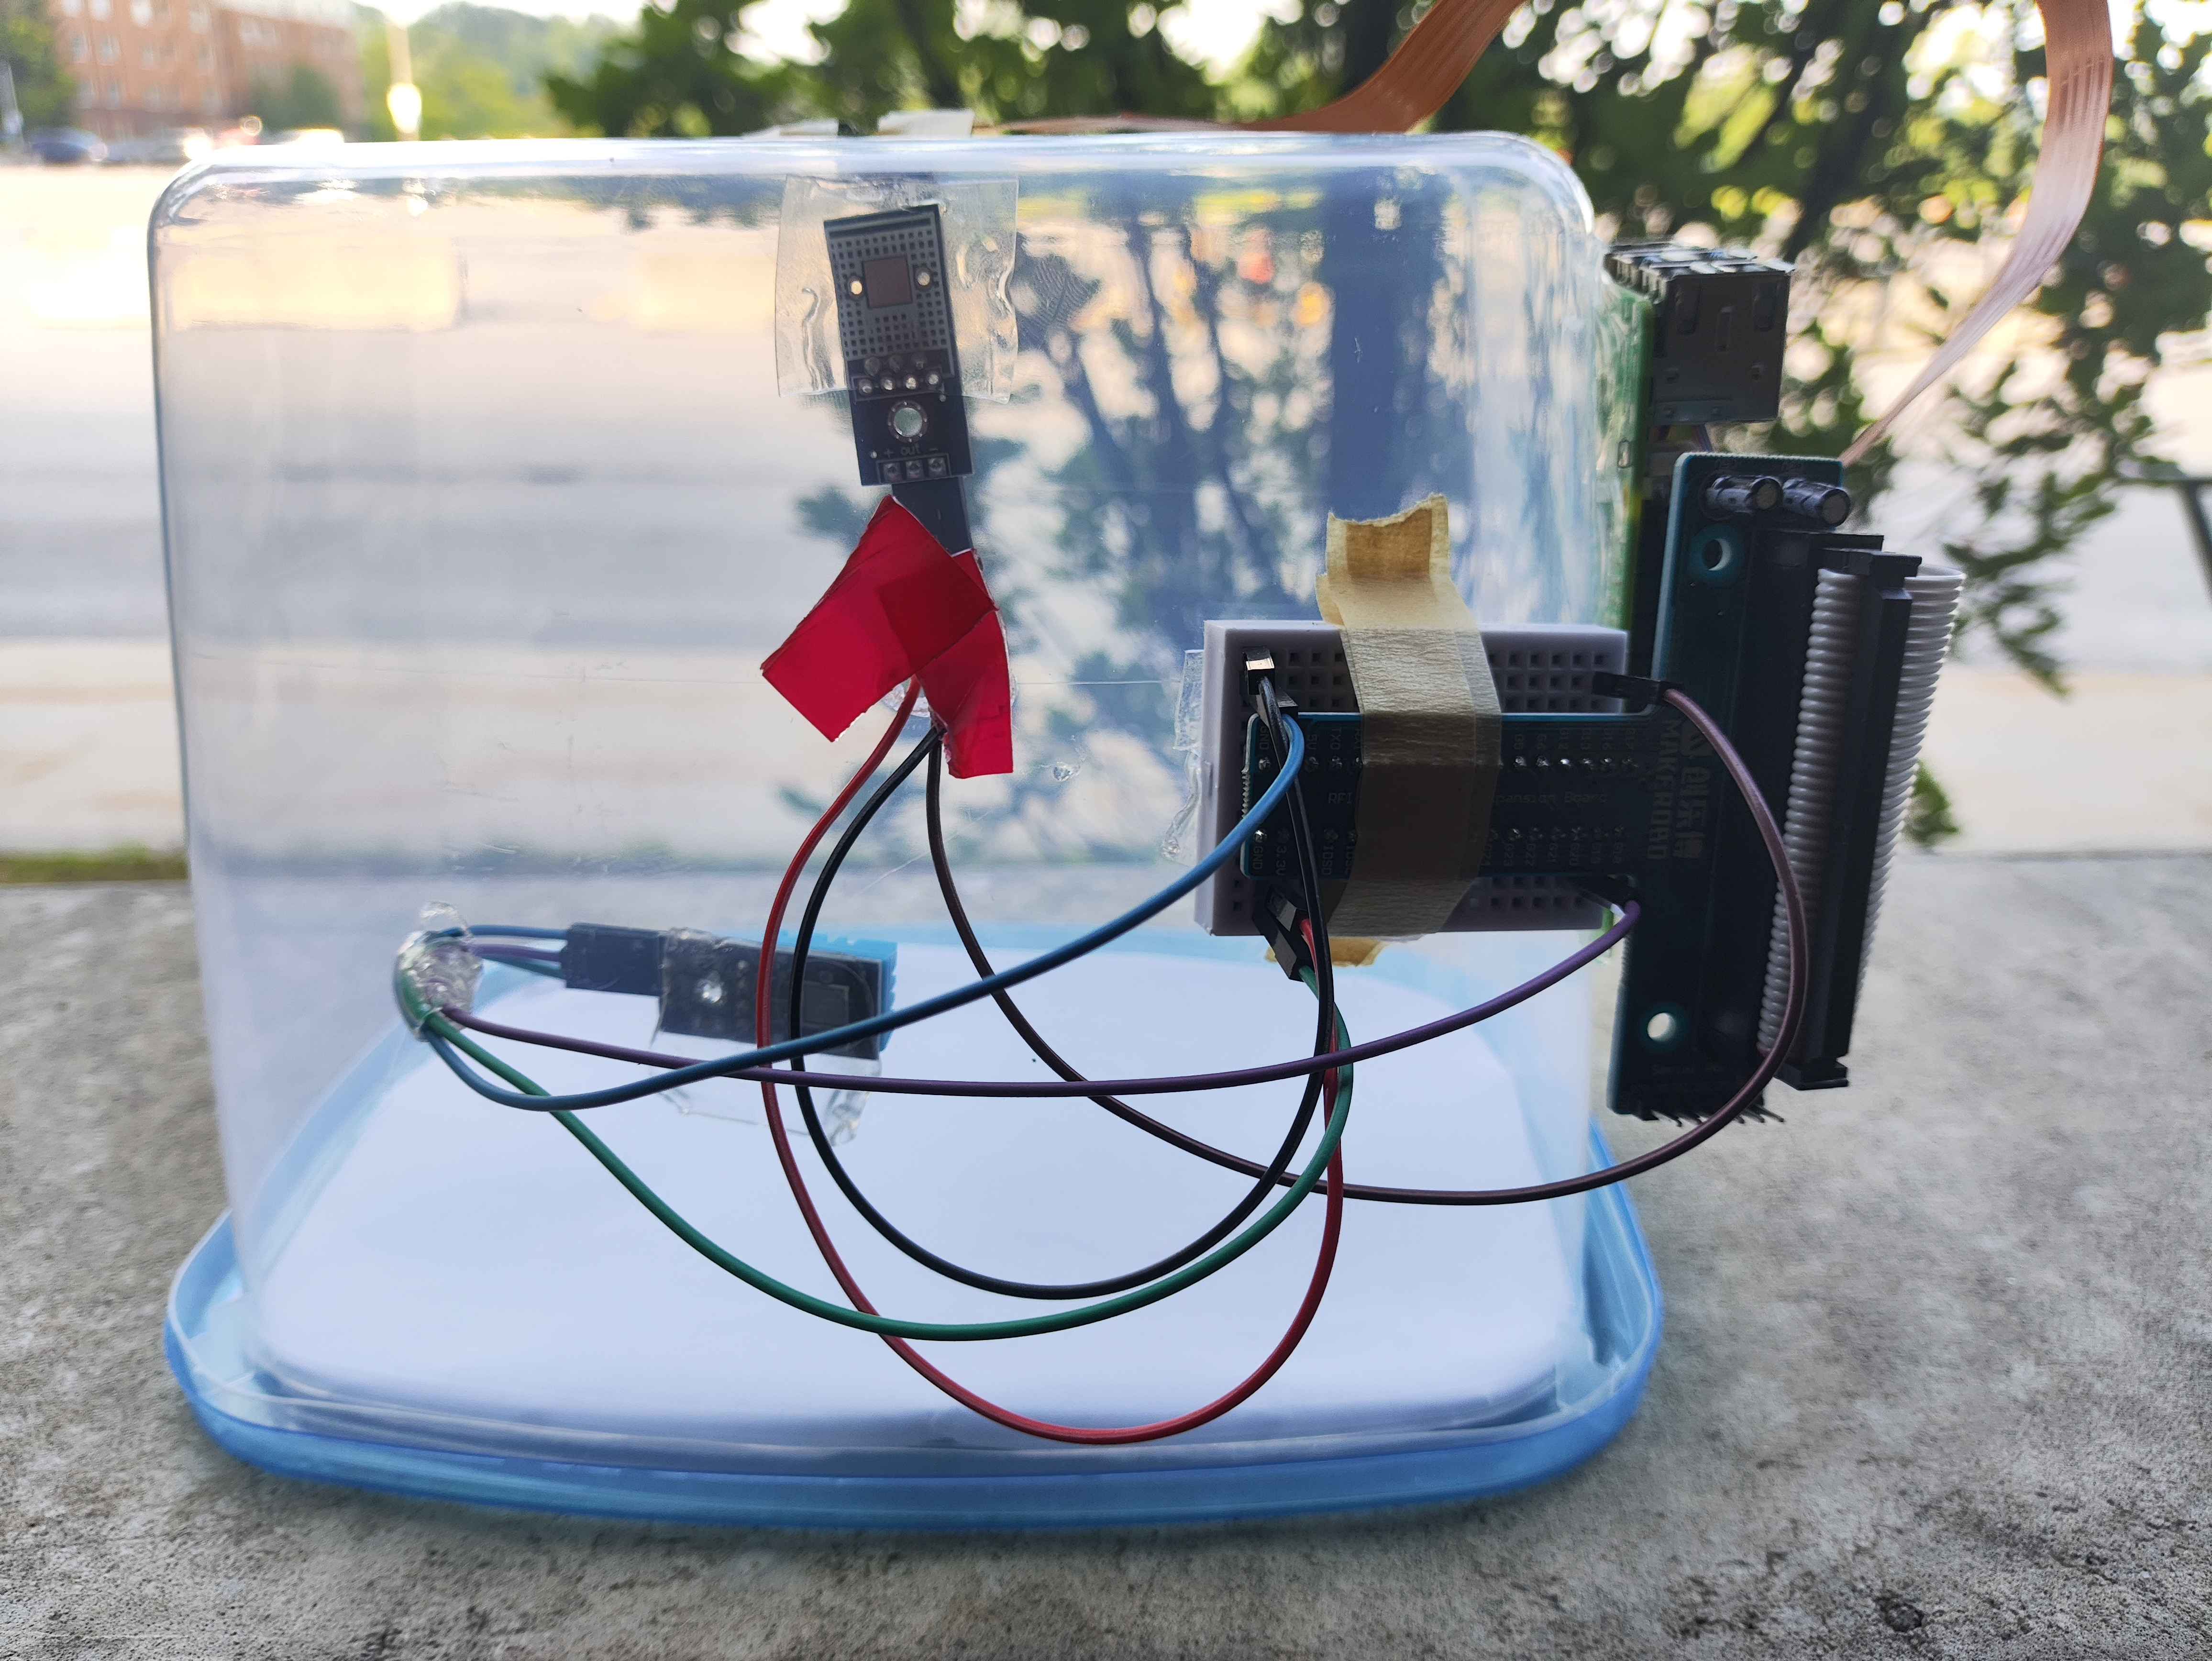
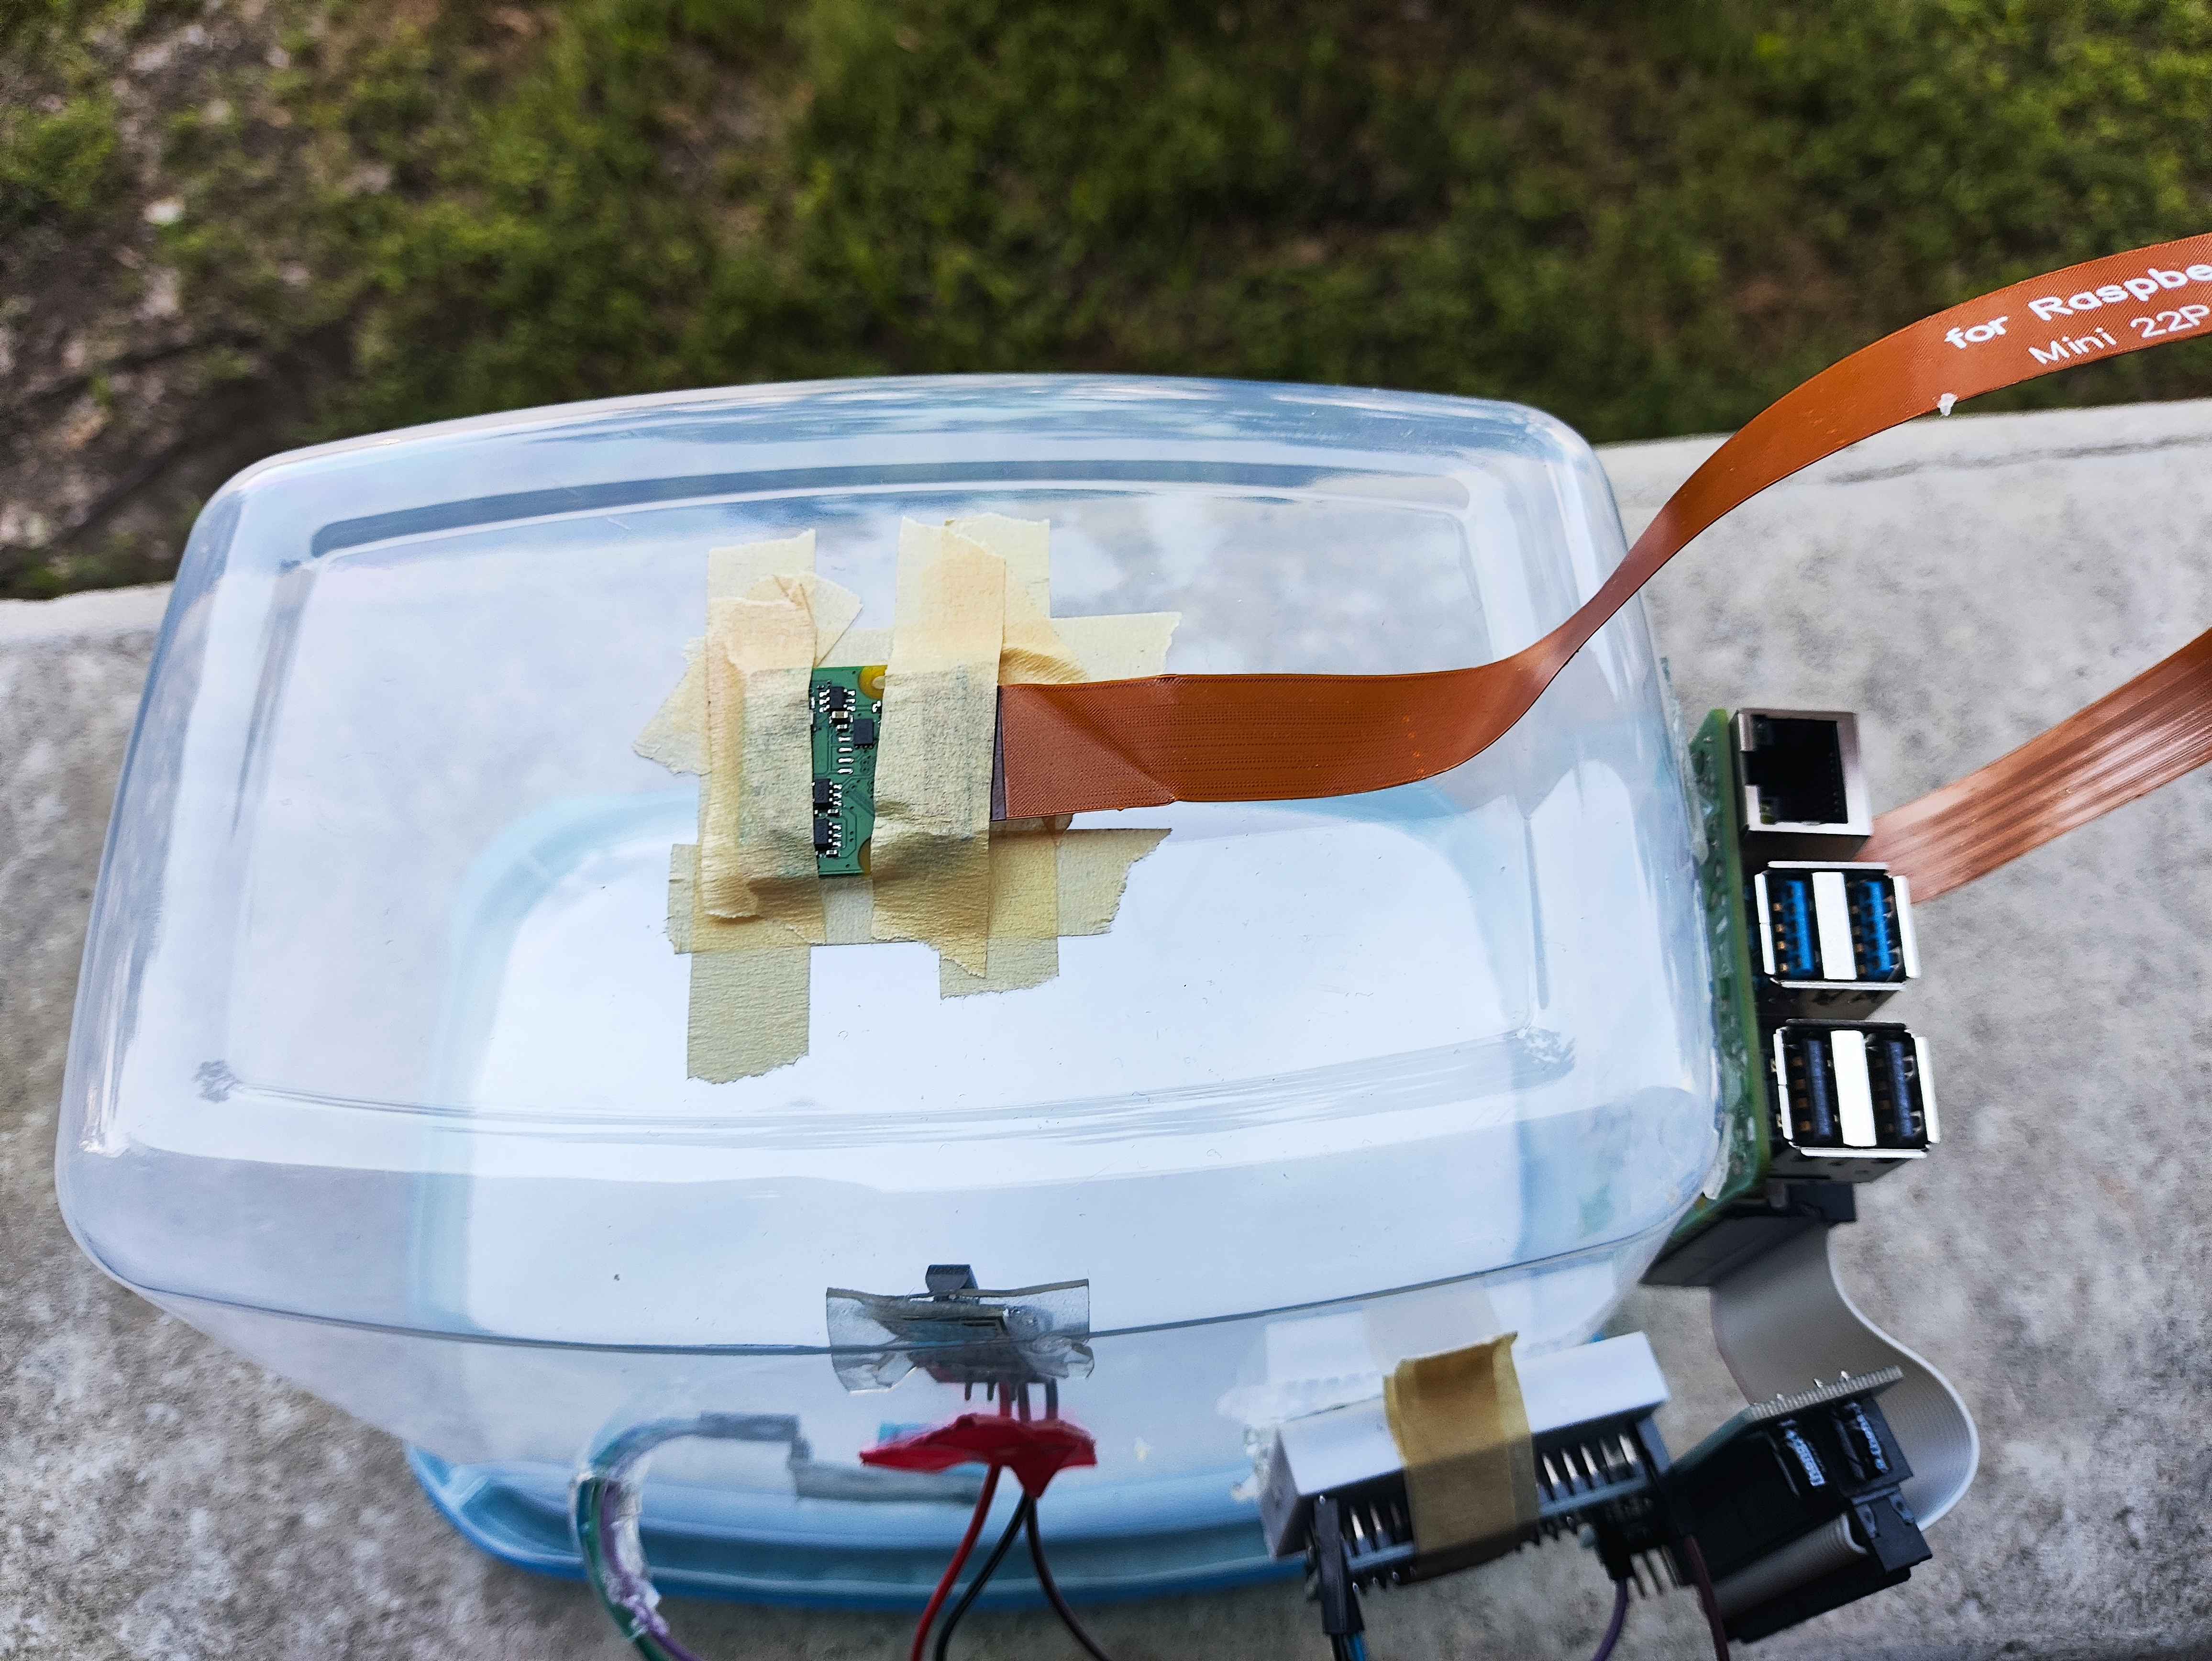
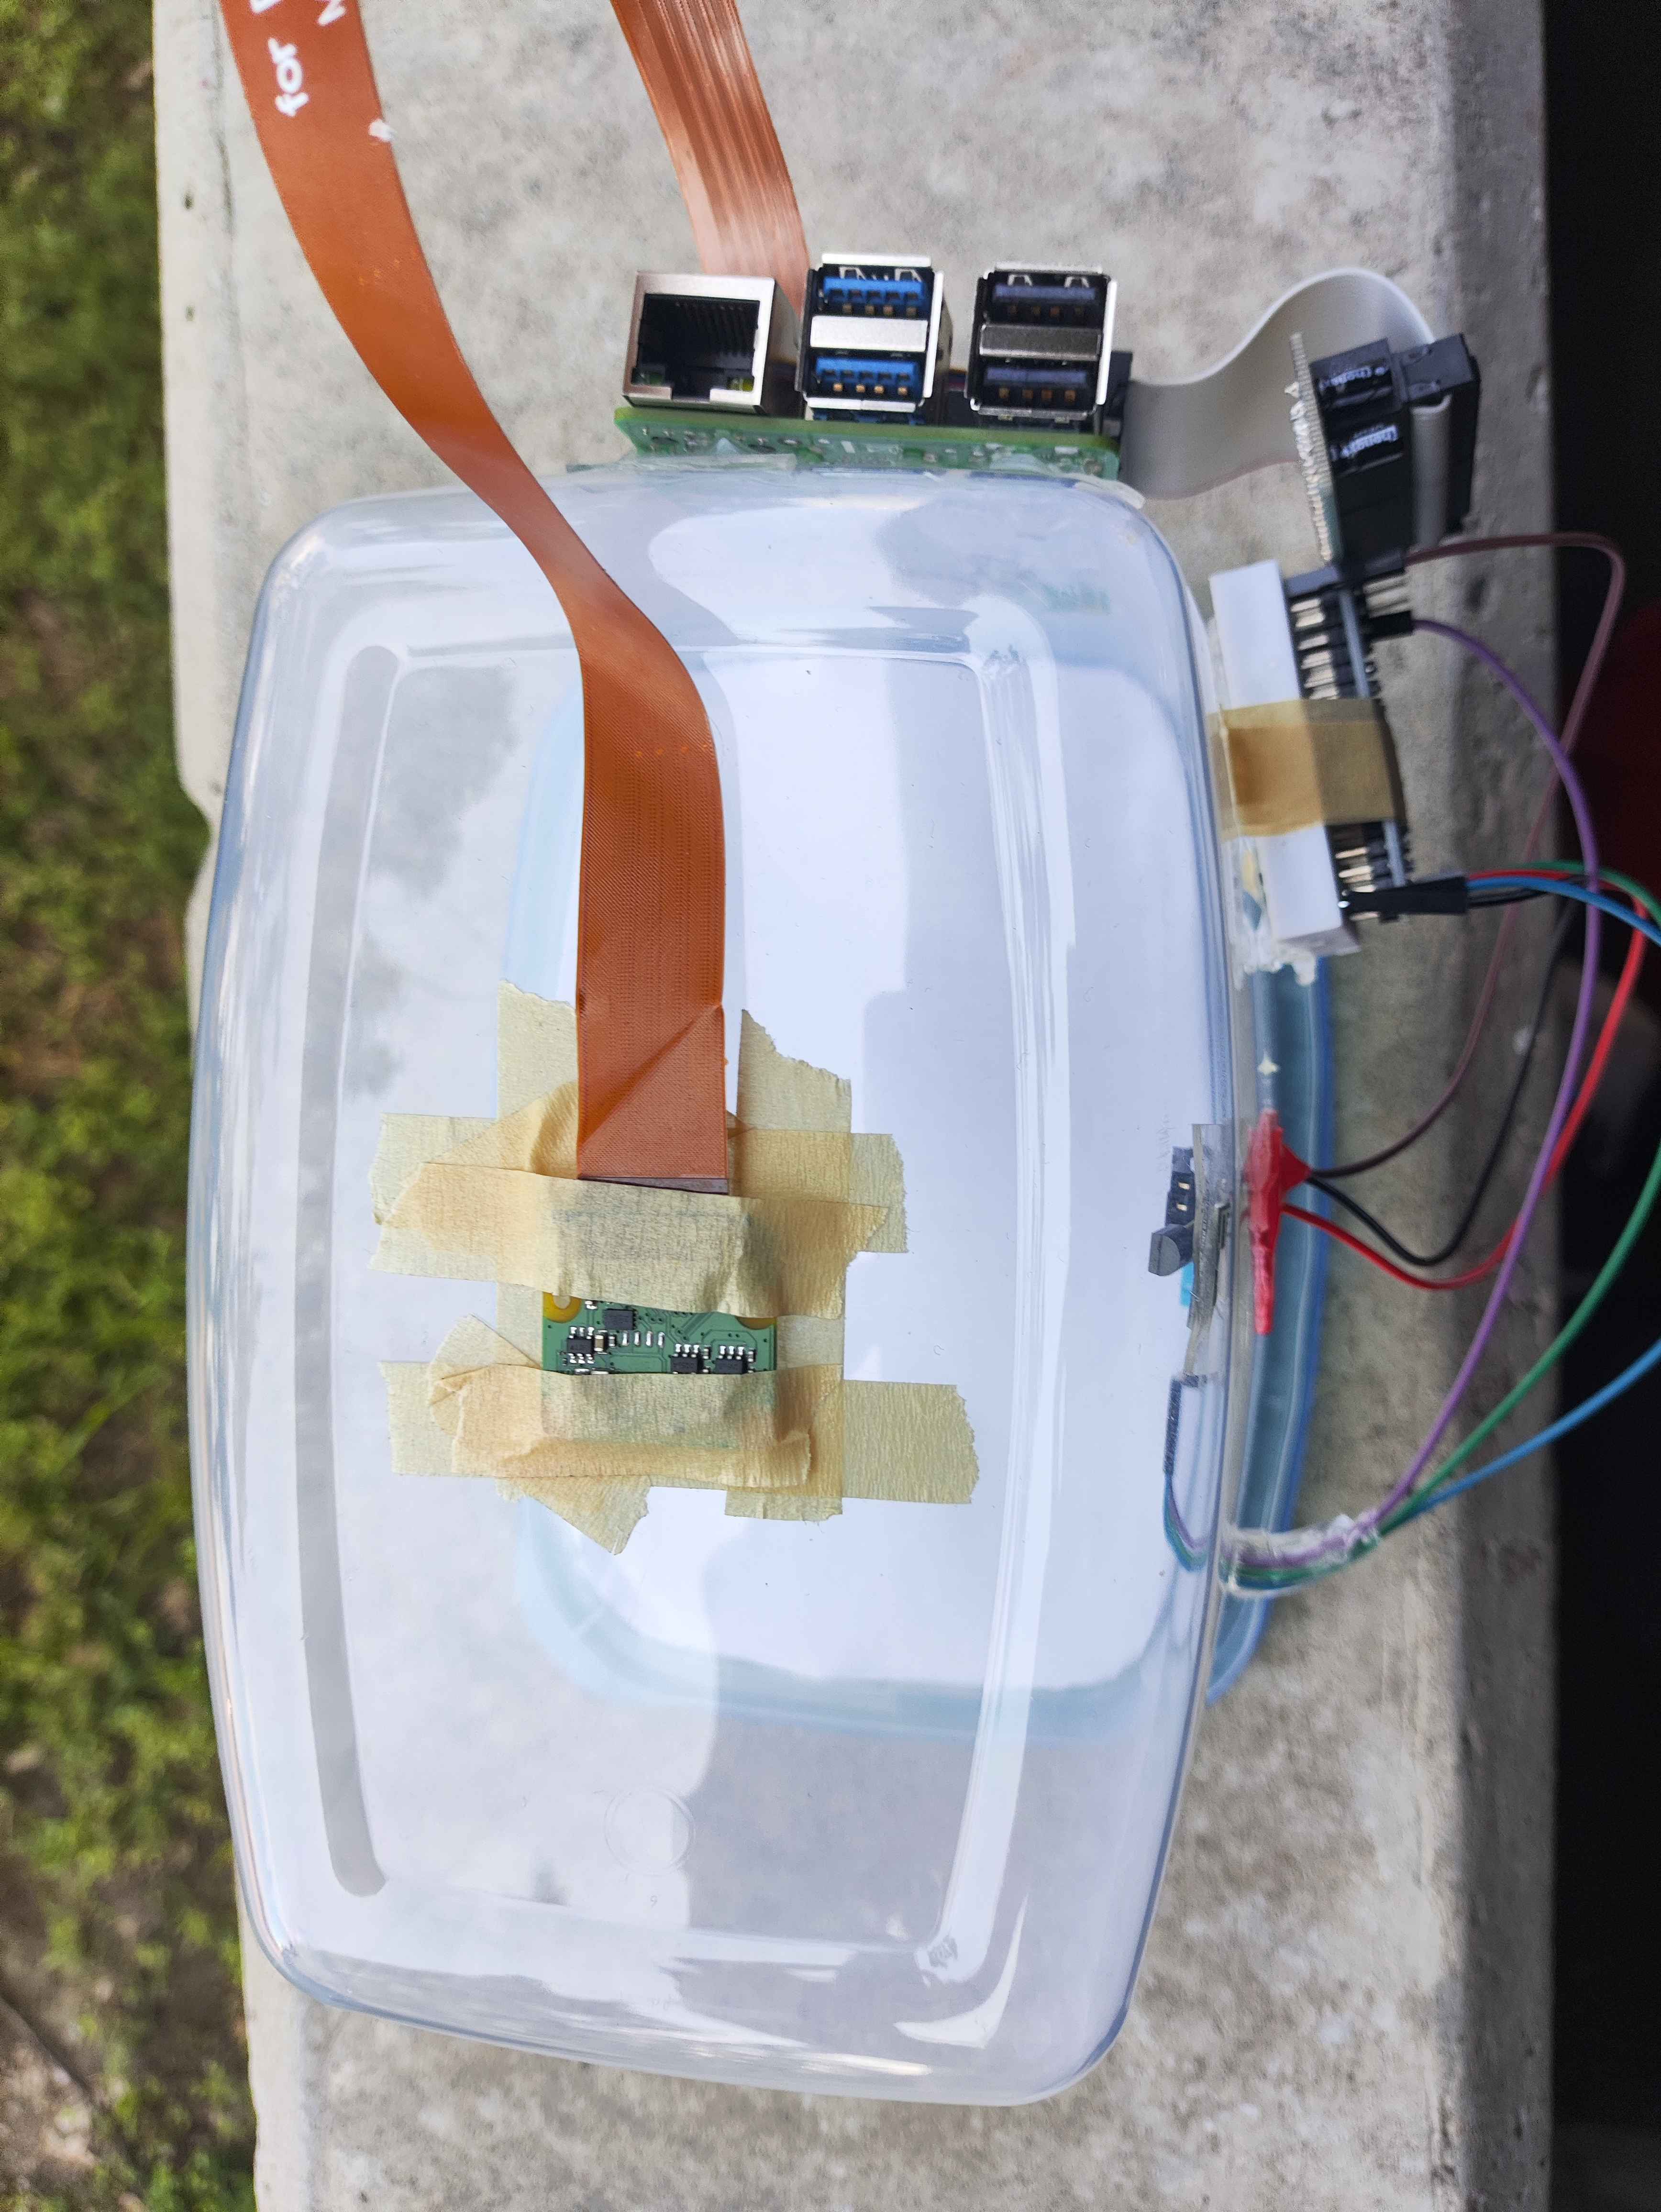
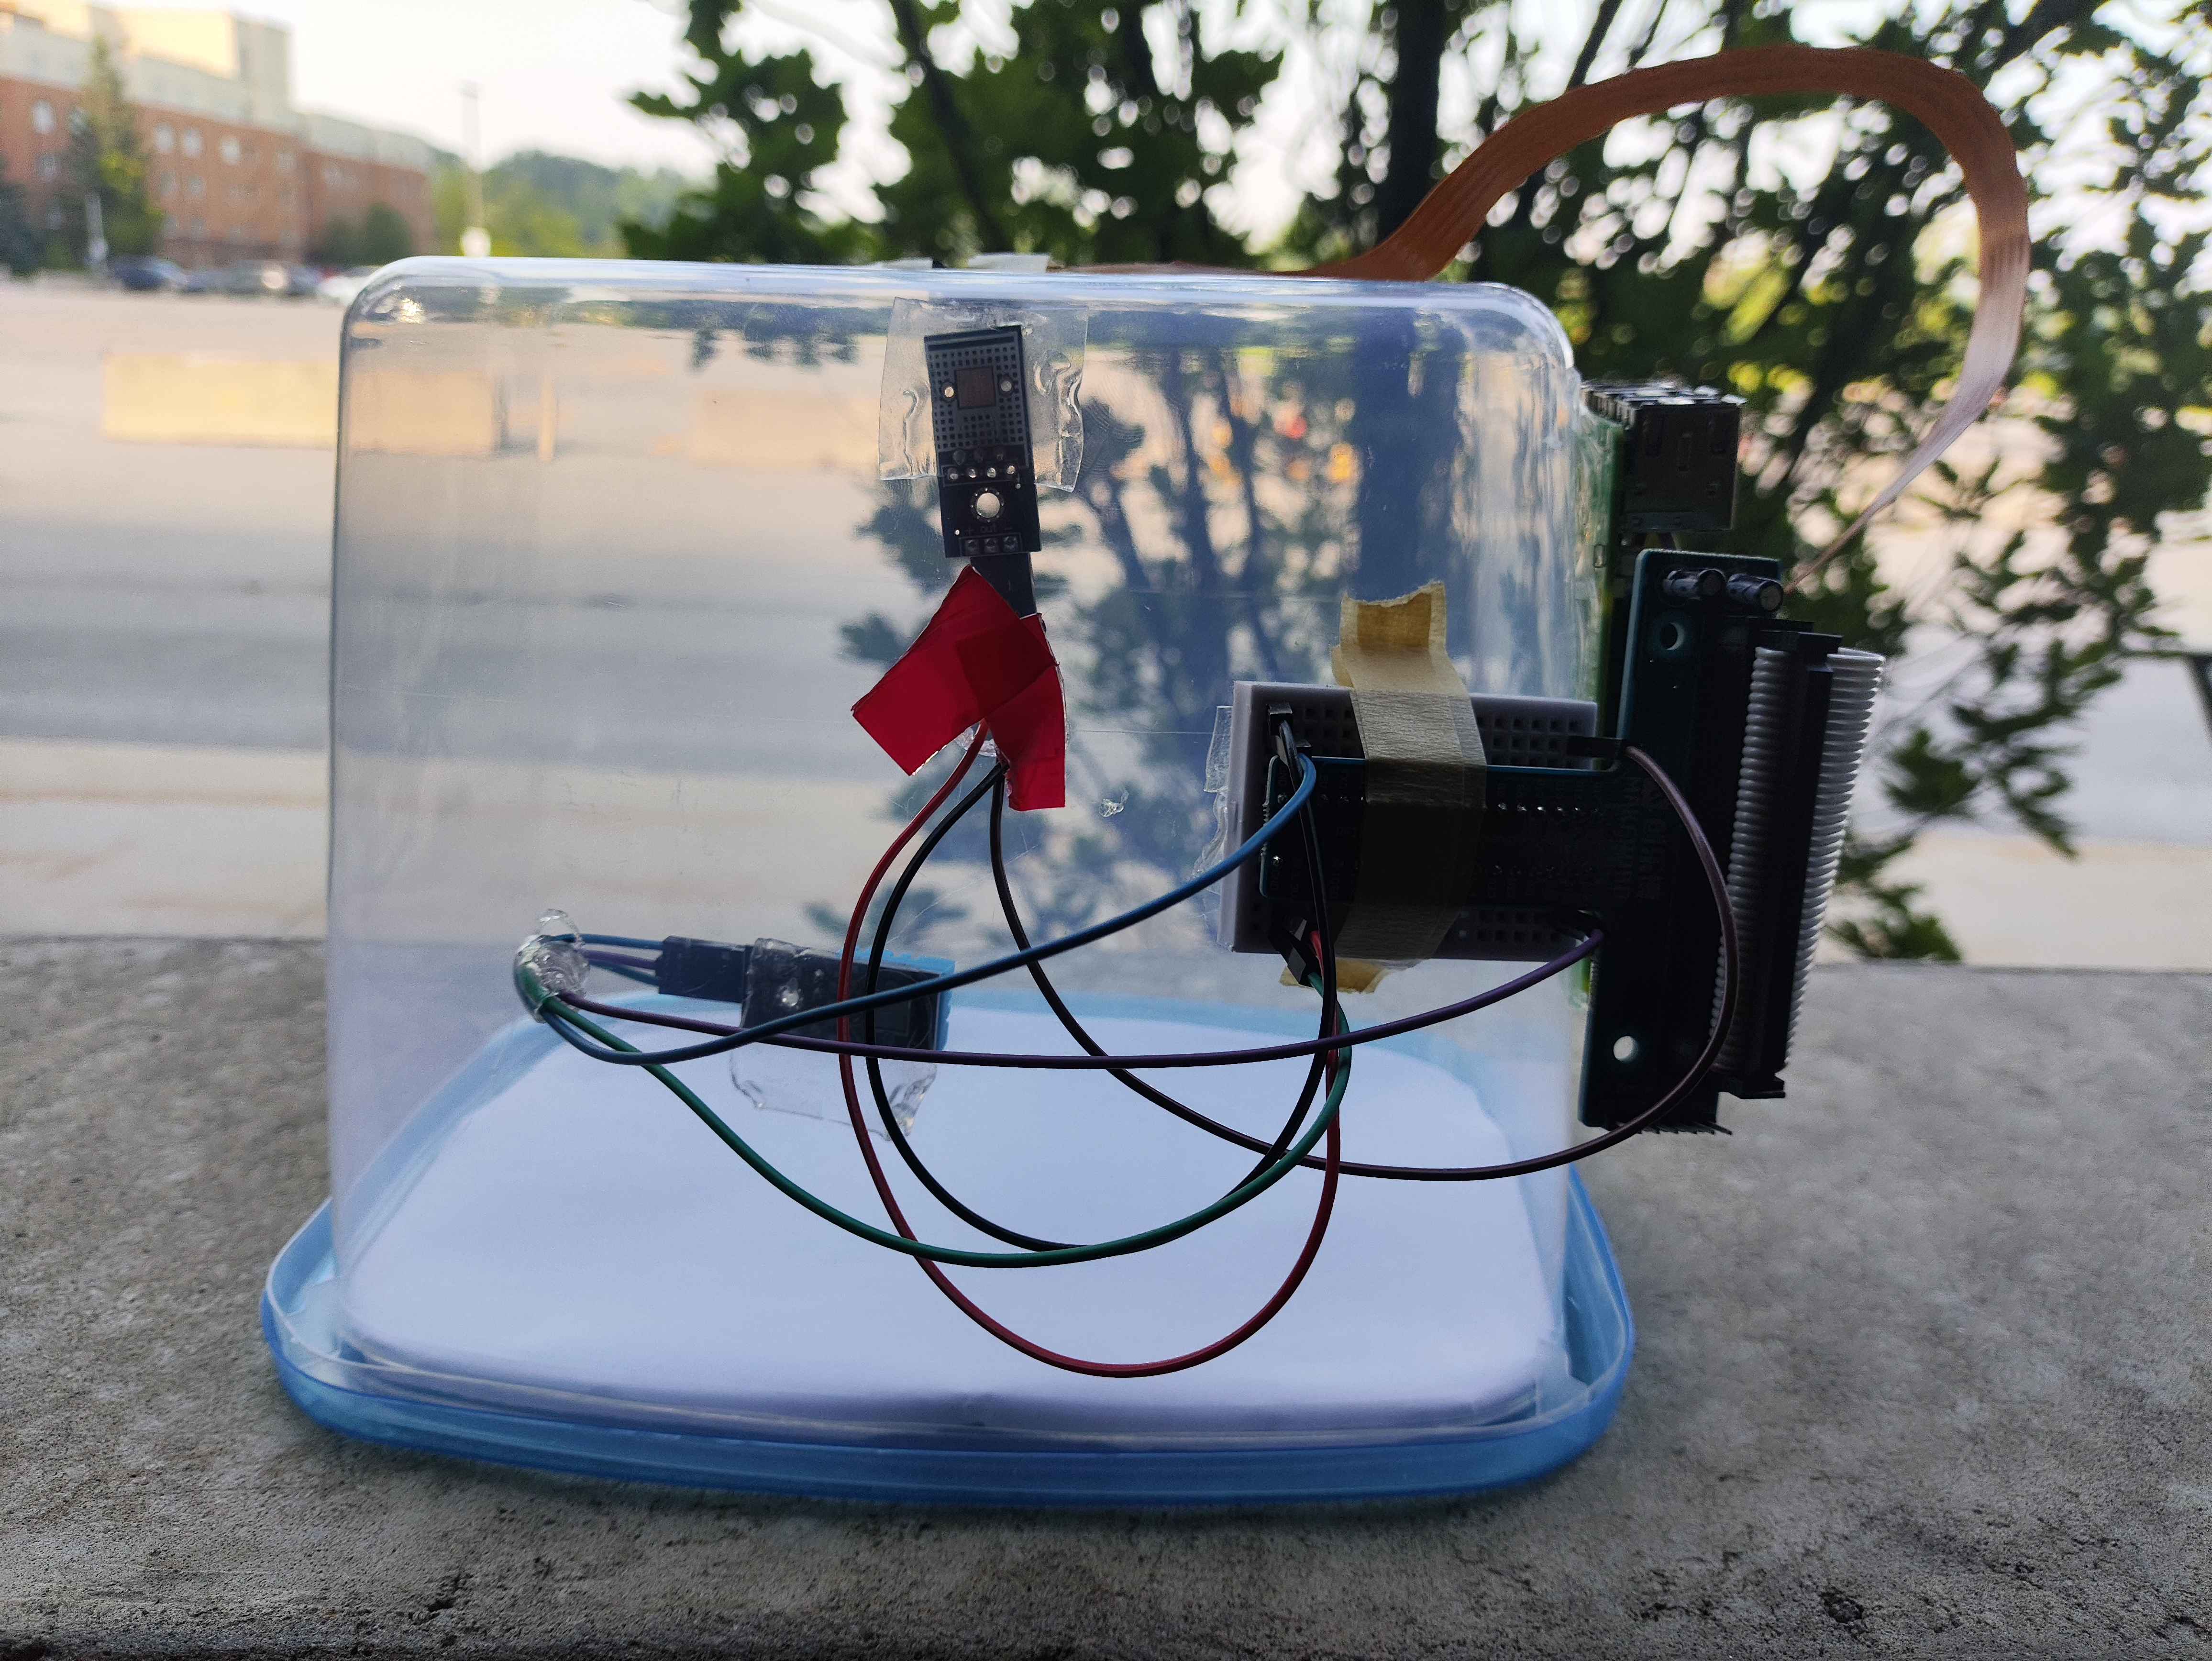
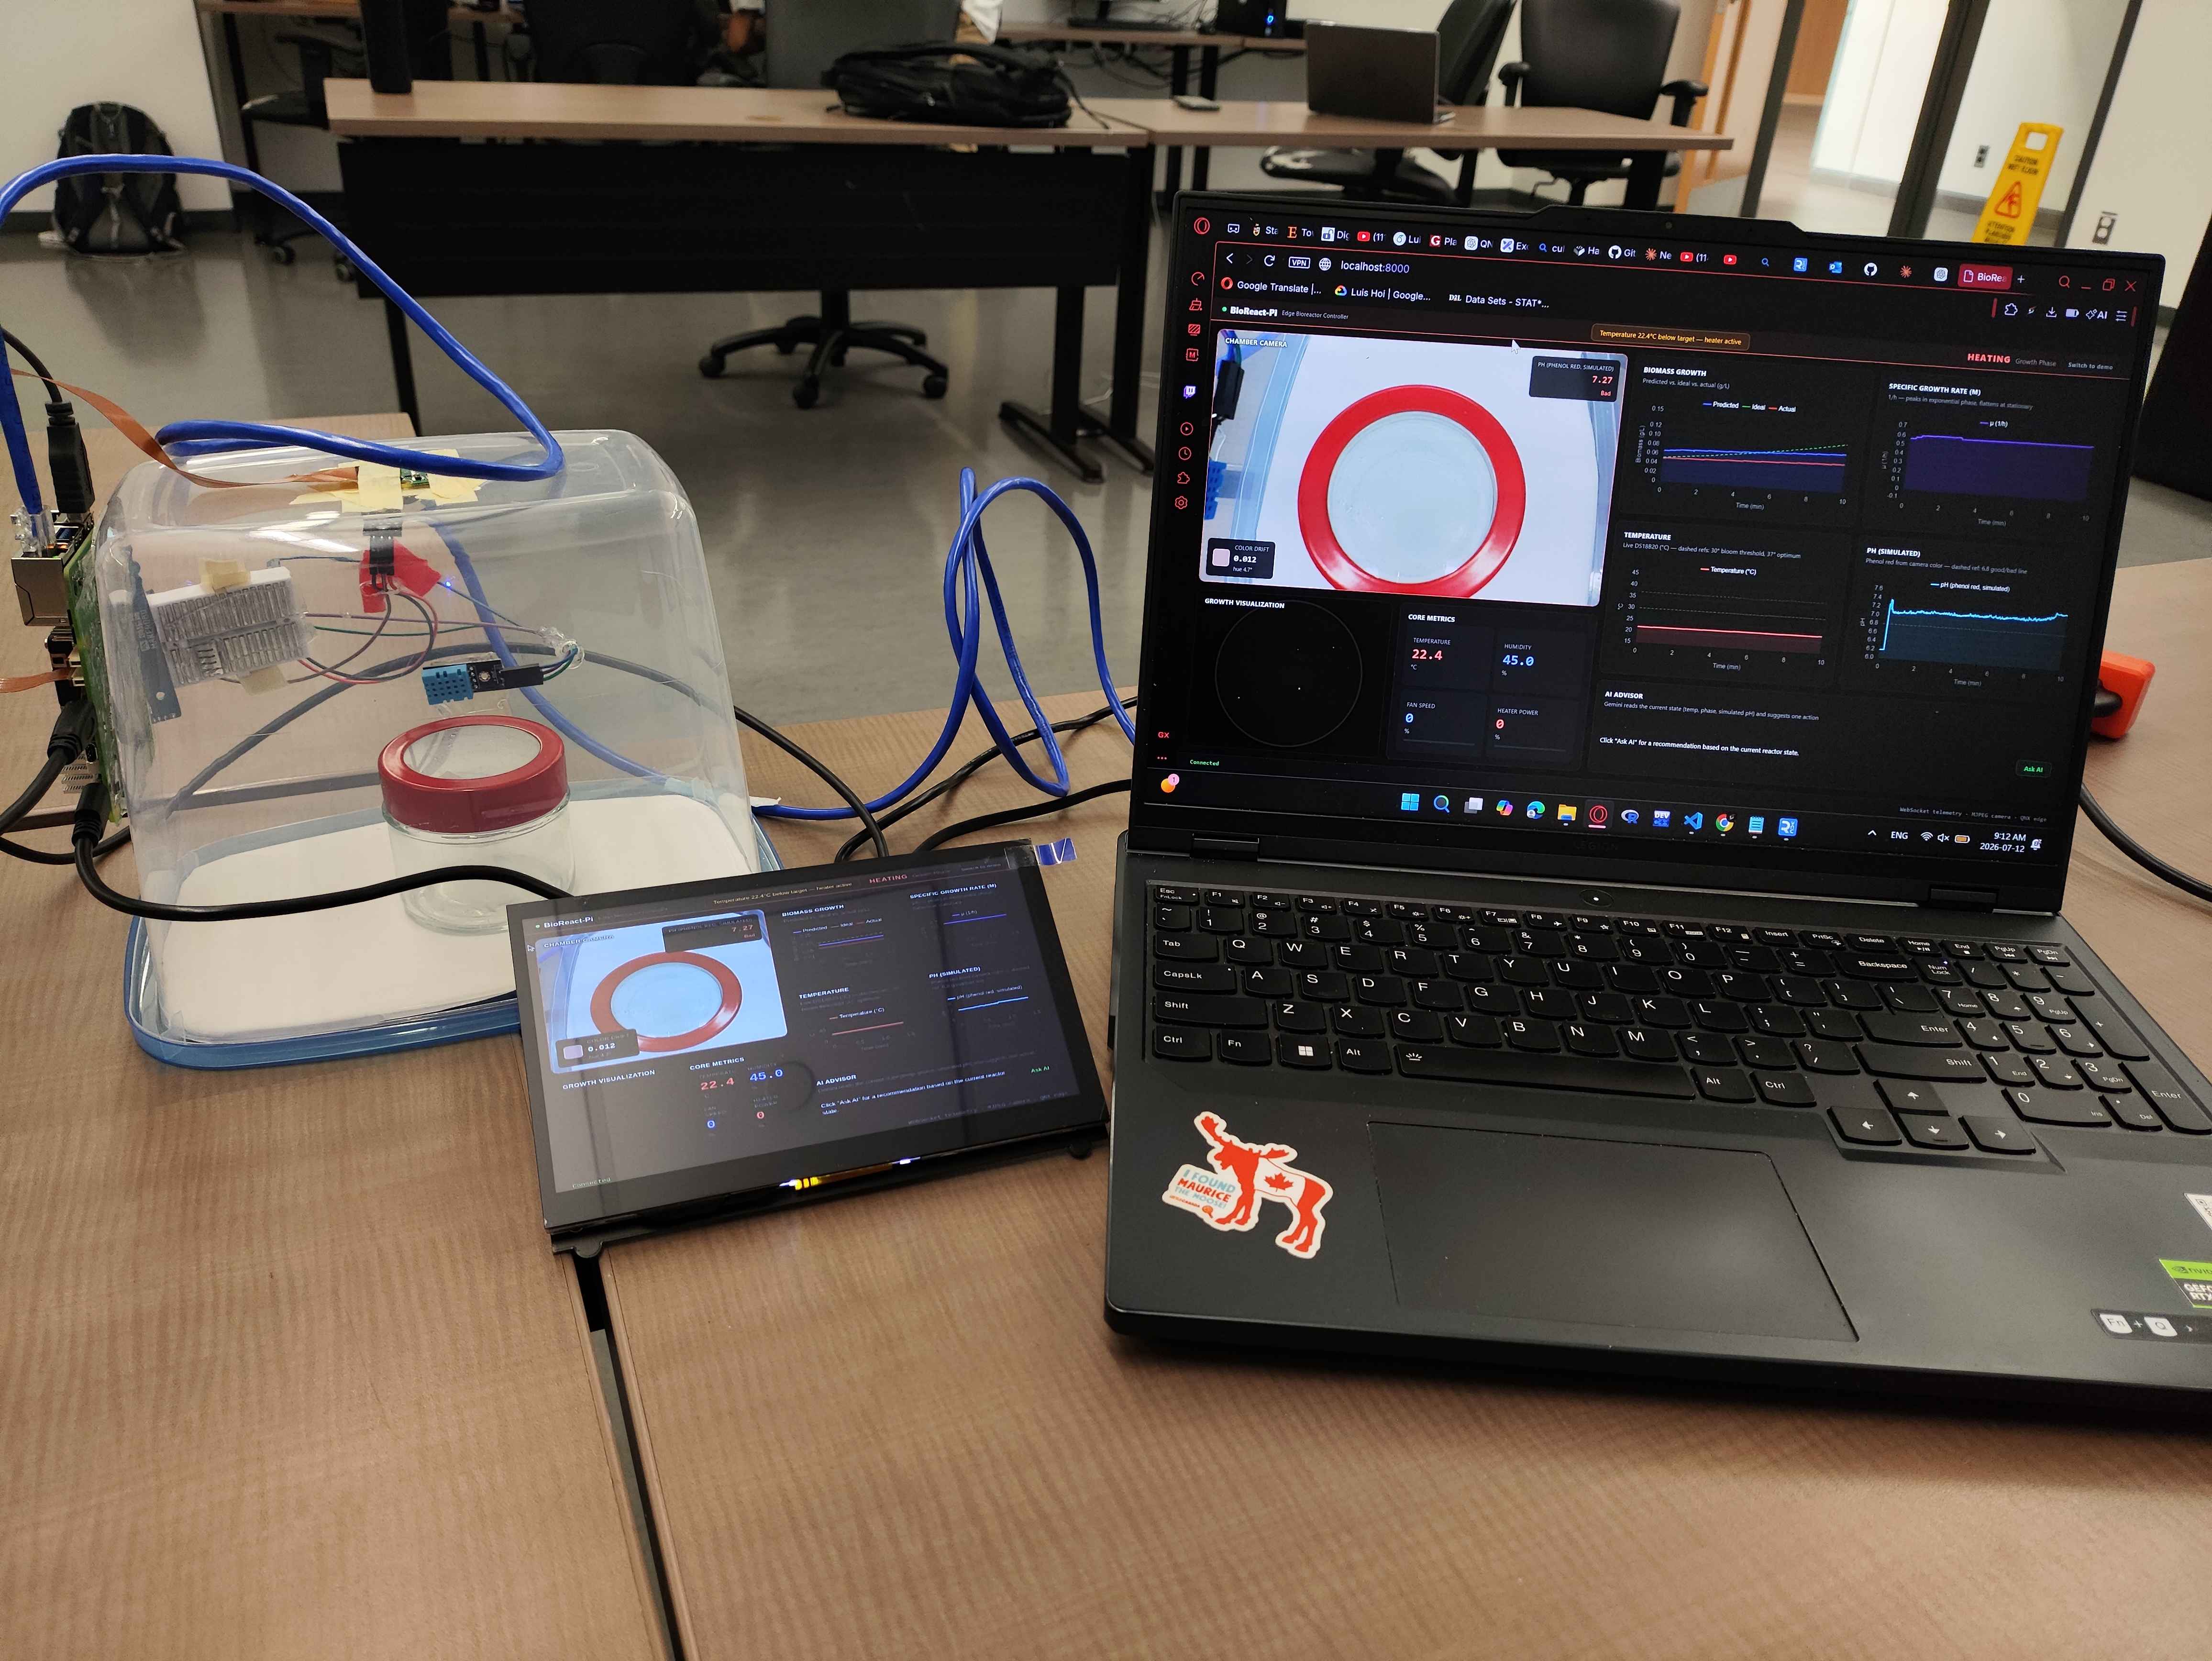
BioReact-Pi is an edge-computing bioreactor monitoring system built around a Raspberry Pi. It reads a live temperature sensor inside a culture chamber, feeds that reading into a logistic bacterial growth model to predict biomass in real time, and streams the result to a live web dashboard alongside a camera feed, a simulated colorimetric pH readout, and an on-demand AI advisor.
This story covers the project in two parts: a general overview of the problem, the solution, and the features offered, followed by a technical deep dive into the sensors, communication protocols, growth model, and software architecture that make it work.
Part I — Project Overview
Inspiration
Industrial biotechnology relies on living microorganisms to manufacture products ranging from insulin and vaccines to biofuels and cultured food. These organisms are grown in bioreactors — controlled vessels that must maintain a narrow band of environmental conditions (temperature above all) for the culture to grow predictably. A deviation of only a few degrees can push a bacterial population out of its productive growth phase, stall a fermentation run, or kill the batch outright, at a real economic cost that scales with batch size.
Commercial bioreactor controllers exist, but they are expensive, closed, and inaccessible to students, small labs, and hobbyist bio-makers who want to understand or experiment with the underlying control loop. BioReact-Pi asks: how much of a real bioreactor's sensing and monitoring loop can be built on commodity, low-cost hardware, with an honest, transparent view into what the system actually knows at any moment?
What it does — Our Solution
BioReact-Pi closes the loop between sensing, prediction, and visualization on a Raspberry Pi:
- A real digital temperature sensor (and a real humidity sensor) inside the chamber is read continuously by an edge service running directly on the Pi.
- That live reading drives a logistic growth model — the same mathematics used in real microbiology to describe bacterial population dynamics — which integrates a predicted biomass curve second by second.
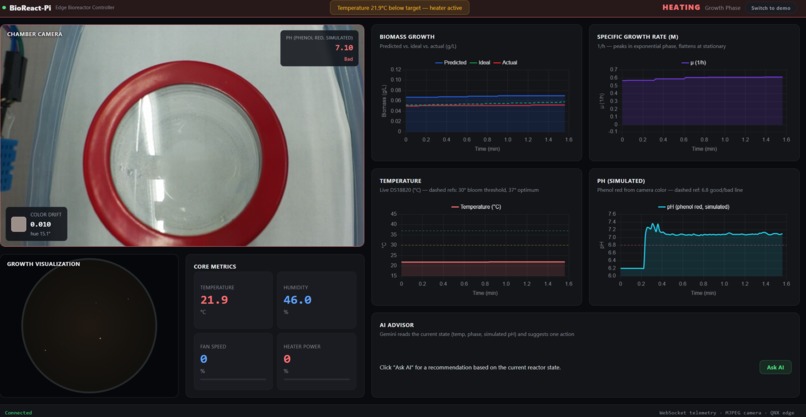
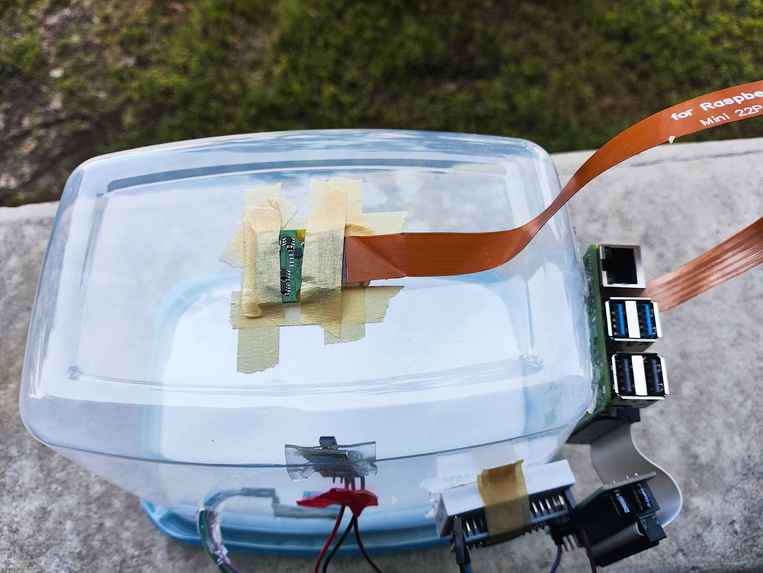
- A Raspberry Pi Camera Module gives a live view of the chamber, and its image is also used to extract a real color signal that is interpreted through a simulated phenol-red pH convention (the same colorimetric indicator used in real cell-culture media).
- Everything is streamed over a WebSocket connection to a browser-based dashboard: biomass and growth-rate curves, a live camera panel, an animated top-down "petri dish" colony visualization, and temperature/pH charts, all updating roughly once per second.
- An on-demand AI advisor (Google Gemini) can be asked, at the press of a button, to read the current state of the culture and suggest one concrete corrective action.
Key Features
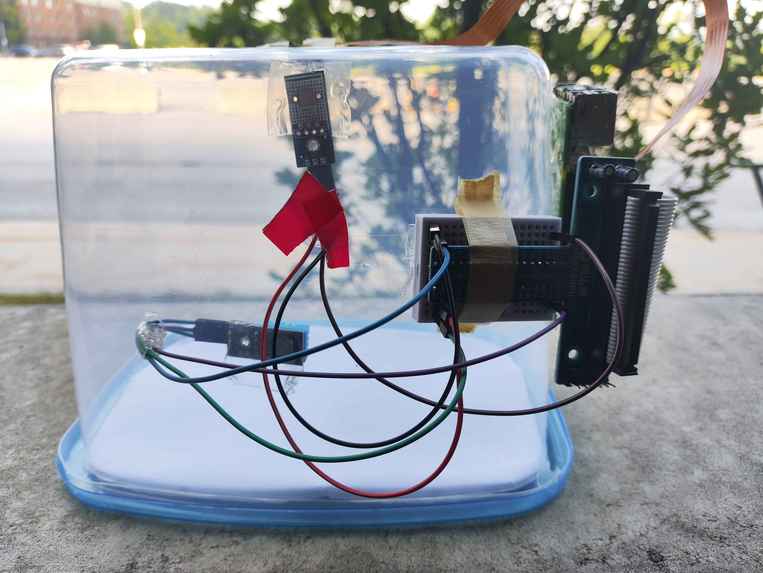
- Real sensor telemetry — a DS18B20 digital temperature probe and a DHT11 humidity sensor, both read live from the physical chamber.
- Live chamber camera — a Raspberry Pi Camera Module feed shown directly in the dashboard, not a placeholder graphic.
- Predictive growth model — a logistic growth curve calibrated to the E. coli reference range (positive growth strictly between 8°C and 50°C, peaking at 37°C), run identically on the Pi and mirrored in the browser.
- Simulated pH indicator — real image color extracted from a region of interest on the camera feed, interpreted through the phenol-red colorimetric convention used in real culture media.
- AI advisor — an on-demand Gemini-backed assistant that reads temperature, growth phase, biomass, and simulated pH, and returns one concrete recommendation.
- Live dashboard — biomass growth chart, specific growth-rate (µ) chart, temperature chart, pH chart, an animated colony-timelapse visualization, and core metric cards, all dark-themed and updating in real time.
- Real mode vs. Demo mode — a toggle switches between an honest, instrument-paced real-time view and a time-compressed demo view driven by the same formula and the same live sensor, useful for a fast, visible showcase (e.g. heating the sensor with a hair dryer during a live demo).
- Mock and hardware data sources — the entire dashboard runs identically against a simulated data source (for development or demoing without hardware) or the real Pi edge service, switchable via a single environment variable.
- Honest disconnection handling — if the Pi is unreachable, the dashboard explicitly shows a "DISCONNECTED" state instead of silently freezing on or replaying old/canned data.
- Digital twin — an offline simulator for running growth "what-if" scenarios without touching the physical culture.
- Standalone kiosk display — the exact same live dashboard can be shown full-screen on a small monitor physically attached to the Raspberry Pi, not just on an operator's laptop.
Development Journey — How we built it, and the challenges we faced
The project's original target platform was QNX (a real-time embedded OS) running on a Raspberry Pi 5, as required by the hackathon challenge track it was built for. Early in development, the team discovered that QNX's GPIO access model — IPC message-passing through a resource-manager process, rather than direct memory-mapped register access — made the microsecond-precision timing required by the DS18B20's 1-Wire protocol impractical to bit-bang reliably in Python.
QNX exposes GPIO through a resource-manager process communicating via IPC message passing rather than direct memory-mapped registers; each GPIO.setup()/GPIO.output()/GPIO.input() call was empirically measured at 13–58 µs of intrinsic latency. Since the 1-Wire protocol requires 1–15 µs pulses to distinguish a "1" bit from a "0" bit, with read windows of at most ~60 µs, a single IPC call's latency already exceeds the entire time budget for one bit — making precise bit-banging from Python on QNX fundamentally unreliable, not merely inconvenient. The team verified this with direct timing instrumentation and Read-ROM protocol isolation tests before deciding to pivot the OS rather than continue fighting an architectural limitation.
Given the hackathon's time budget, the team made the pragmatic call to pivot the operating system to Ubuntu/Raspberry Pi OS, which handles 1-Wire devices through a native, well-tested kernel driver instead of hand-rolled timing-critical code. This pivot is documented in detail (see Part II) as an example of a real engineering trade-off made under a deadline, not hidden after the fact.
Two other real bugs shaped the build, both documented in full in Part II: a blocking I/O bug that froze the entire dashboard server whenever the Pi was unreachable (fixed by moving all hardware I/O to worker threads), and a kiosk-display bug where the dashboard's own JavaScript silently failed to run at all on the Pi's local monitor because it tried to reach third-party CDNs on a network link with no internet route (fixed by vendoring every frontend dependency locally).
Target Use Case and Impact
BioReact-Pi is aimed at educational and small-scale experimental settings: a classroom, a student lab, or a hobbyist bio-maker space where a transparent, inspectable, low-cost bioreactor monitor is more valuable than a black-box commercial unit. By combining a real predictive biology model with real sensor data and an honest, uncompromising UI (no faked values, ever), it doubles as a teaching tool for both control systems and microbiology growth kinetics.
Pitch
Every year, biotech labs lose entire fermentation batches — sometimes worth thousands of dollars — because of something as simple as a two-degree temperature drift that nobody caught in time. A living culture doesn't forgive mistakes the way a spreadsheet does: push it a few degrees outside its productive window, even briefly, and you can stall a fermentation run or kill the batch outright. Commercial bioreactor controllers exist to prevent exactly this, but they cost tens of thousands of dollars and they're closed black boxes — you can't see inside them, you can't learn from them, and students, small labs, and bio-makers are simply locked out of that kind of tooling.
We built BioReact-Pi to change that. BioReact-Pi is an edge-AI bioreactor controller running entirely on a Raspberry Pi. It closes the loop between real sensing, real biological prediction, and real-time visualization — and every piece of that loop is genuinely live, not scripted for a demo. Inside our chamber, a DS18B20 digital temperature probe and a DHT11 humidity sensor stream continuous telemetry — not simulated, not mocked — directly into an edge service running on the Pi itself. That live reading feeds a logistic growth model, the exact same mathematics microbiologists use to describe bacterial population dynamics, calibrated to the E. coli reference range: positive growth strictly between 8 and 50 degrees Celsius, peaking at 37. Every second, that model recalculates predicted biomass in response to what the sensors are actually reporting right now, in this room.
That prediction doesn't just live in a number on a chart. We built a real-time 3D growth render — an animated, top-down colony visualization that shows the simulated culture actually expanding and dividing on screen as the growth model updates, so you're not staring at abstract curves, you're watching the population grow the way it would under a microscope. It turns a mathematical model into something you can watch happen. We also extract a real colorimetric pH signal directly from our live camera feed, interpreted through the phenol-red convention used in actual cell-culture media — turning a ten-dollar camera into a working visual pH sensor, reading the same color cues a lab technician would read by eye. And on top of all of that sits an on-demand AI advisor, powered by Gemini, that reads temperature, growth phase, biomass, and pH together, and returns one concrete corrective recommendation — like having a lab technician on call, available at the press of a button.
BioReact-Pi proves that a transparent, inspectable, low-cost bioreactor monitor — one any classroom, student lab, or hobbyist bio-maker space can build, understand, and trust — is possible today, with parts that cost less than a textbook. Real sensors. Real biology. Real-time visualization. Real engineering.
Part II — Technical Documentation
System Architecture
BioReact-Pi is split into three cooperating processes, typically running on two machines connected over a direct Ethernet link:
+--------------------------+                          +----------------------------+                         +----------------+
|       Raspberry Pi       |   GET /api/telemetry      |      Dashboard backend      |  WebSocket             |                |
|  DS18B20 (1-Wire)        |------------------------->|   FastAPI, port 8000        |  (/ws/telemetry, ~1/s) |    Browser     |
|  DHT11 (humidity)        |   GET /api/camera/stream  |   ui/api/*                   |----------------------->|  Dashboard UI  |
|  Camera Module           |------------------------->|   (polls every ~1s,          |                        |  Chart.js +    |
|  edge/pi_edge_server.py  |                          |    talks to Pi on port 8080) |<---- POST /api/advisor--|  Three.js      |
|  + GrowthModel           |                          |                              |      (Gemini)          |                |
+--------------------------+                          +----------------------------+                         +----------------+
Data flow:
edge/pi_edge_server.pyruns directly on the Raspberry Pi. It reads the DS18B20 and DHT11 sensors, captures a camera frame on request, integrates the growth model against the real temperature every second, and exposes all of it as a small HTTP JSON/JPEG API.ui/api/hardware.py, part of the dashboard backend (which typically runs on an operator's laptop), polls those edge endpoints and normalizes the payload into the dashboard's WebSocket packet shape. When no hardware is configured,ui/api/telemetry.pygenerates an equivalent packet from an internal mock simulation instead.ui/api/color_ph.pyextracts a real color sample from the camera frame's region of interest and overlays a simulated pH reading onto the same packet.ui/dashboard/js/app.jsrenders everything client-side: Chart.js for the time-series charts, Three.js for the colony visualization, plus the metric cards and camera panel, all driven from the single WebSocket stream. The "Ask AI" button makes a separate, on-demand REST call toui/api/advisor.py, which queries Gemini.
Hardware Components
Sensors
| Component | Interface | Status | Purpose |
|---|---|---|---|
| DS18B20 | 1-Wire digital (GPIO17, kernel w1-gpio/w1-therm driver) |
Working | Chamber temperature, the primary signal driving the growth model |
| DHT11 | Single-wire bit-banged protocol via lgpio |
Working | Chamber relative humidity, used as a secondary growth-rate factor |
| Pi Camera Module | CSI ribbon, picamera2 |
Working | Chamber view; also the input to the simulated pH color extraction |
| Heater / cooling fan | — | Not wired | Actuation loop is a planned extension; dashboard reports 0% power honestly rather than simulating a value |
DS18B20 wiring and OS-level configuration
The DS18B20 uses three pins: DATA (to GPIO17, through an extension cable into a breadboard — a hand-held connection produced erratic ±30°C jumps between consecutive readings due to intermittent contact), VCC (3.3 V), and GND. On Raspberry Pi OS/Ubuntu, the 1-Wire bus is enabled at the kernel level by adding the following line to /boot/firmware/config.txt:
dtoverlay=w1-gpio,gpiopin=17,pullup=on
After a reboot, the sensor appears as a directory prefixed 28- under /sys/bus/w1/devices/ (a 00- prefix instead indicates an insufficient pull-up). The kernel driver performs the microsecond-precision 1-Wire bit-banging and CRC verification directly in hardware/kernel space, so user-space code only needs to read a plain text file:
cat /sys/bus/w1/devices/28-000000870030/w1_slave
a3 01 4b 46 7f ff 0c 10 d8 : crc=d8 YES
a3 01 4b 46 7f ff 0c 10 d8 t=26187
YES confirms a valid CRC; t=26187 means 26.187°C. A persistent reading of exactly 85000 (85.0°C) is the sensor's power-on reset value and indicates a power or connection fault rather than a real temperature. The edge service smooths this raw reading with a median filter over the last five samples to reject residual wiring noise before it reaches the growth model.
Why not QNX bit-banging
The project's first attempt targeted a Raspberry Pi 5 running QNX, accessed over VNC/SSH, with the plan of implementing the 1-Wire protocol manually ("bit-banging") in Python using QNX's rpi_gpio module. QNX exposes GPIO through a resource-manager process communicating via IPC message passing rather than direct memory-mapped registers; each GPIO.setup()/GPIO.output()/GPIO.input() call was empirically measured at 13–58 µs of intrinsic latency. Since the 1-Wire protocol requires 1–15 µs pulses to distinguish a "1" bit from a "0" bit, with read windows of at most ~60 µs, a single IPC call's latency already exceeds the entire time budget for one bit — making precise bit-banging from Python on QNX fundamentally unreliable, not merely inconvenient. The team verified this with direct timing instrumentation and Read-ROM protocol isolation tests before deciding to pivot the OS rather than continue fighting an architectural limitation.
Growth Model
The predictive core of BioReact-Pi is a logistic bacterial growth model (src/models/growth_model.py), duplicated intentionally in three places — the Python module, an embedded copy inside the self-contained edge server, and a 1:1 JavaScript port used by the dashboard's demo mode — so both the physical device and the browser can integrate the identical curve independently, verified to agree by sweeping the same temperature range through all three and comparing output.
Temperature effect
Growth rate depends on temperature through a piecewise-linear response curve, calibrated to the E. coli reference range: growth is strictly positive between 8°C and 50°C, exactly zero at those two boundaries, and peaks at the physiological optimum of 37°C. Outside that range the effect goes negative, modeling die-off under cold or heat stress, and continues to worsen linearly rather than clamping flat at the curve's extremes:
$$ f_T(T) = \begin{cases} \text{(cold-stress ramp, extrapolated)} & T < 2\ ^\circ\text{C} \ \text{interpolated segment} & 2\ ^\circ\text{C} \le T \le 50\ ^\circ\text{C} \ \text{(heat-stress ramp, extrapolated)} & T > 50\ ^\circ\text{C} \end{cases} $$
with anchor points \((2, -0.3)\), \((8, 0.0)\), \((22.5, 0.55)\), \((37, 1.0)\), \((45, 0.35)\), \((50, 0.0)\), interpolated piecewise-linearly and extrapolated beyond the first/last segment's slope.
Humidity effect
When a humidity reading is available, a second piecewise-linear factor \(f_H(H) \in [0.02, 1]\) scales growth down under dry conditions (never below a small positive floor, and never lethal on its own — only temperature drives death in this model). Critically, when no humidity sensor is present, \(f_H\) is not guessed: growth_rate(temp_c, humidity_pct=None) applies a neutral multiplier of 1.0, so a real deployment running on temperature alone is not silently penalized by an assumed humidity value it never measured.
Combined growth rate
$$ r(T, H) = \begin{cases} f_T(T) & \text{if } f_T(T) < 0 \quad \text{(temperature-driven death, humidity irrelevant)} \ r_{\max} \cdot f_T(T) \cdot f_H(H) & \text{if } f_T(T) \ge 0 \end{cases} $$
where \(r_{\max} = 2.4\) divisions/hour is the maximum growth rate at optimal temperature and humidity.
Population integration
Biomass is integrated over each time step using the closed-form solution of the logistic equation (growth) or simple exponential decay toward a small survivor floor (death), so the curve eases smoothly into the chamber's carrying capacity \(K\) instead of hitting a hard ceiling:
$$ N(t + \Delta t) = \begin{cases} \dfrac{K}{1 + \left(\dfrac{K - N(t)}{N(t)}\right) e^{-r \Delta t}} & r > 0 \[10pt] \max!\big(N(t)\, e^{r \Delta t},\ N_{\min}\big) & r < 0 \[6pt] N(t) & r = 0 \end{cases} $$
The instantaneous growth phase (lag, exponential, stationary, declining, death) is derived directly from the current rate \(r\) via fixed thresholds, and doubling time is reported as \(\ln(2)/r\) (converted to minutes) whenever \(r > 0\).
Specific growth rate (µ) chart
The dashboard's second chart plots the classical microbiology quantity
$$ \mu = \frac{\ln(N_2 / N_1)}{\Delta t_{\text{hours}}} $$
between consecutive biomass samples, which peaks during exponential phase and flattens toward zero at stationary phase. Every data source (edge server, mock simulation, and demo mode) reports this realized µ directly in its telemetry packet rather than having the frontend re-derive it from wall-clock deltas, since demo mode's time-compressed clock would otherwise inflate the computed rate by the compression factor.
Communication Protocols
Edge service HTTP API
edge/pi_edge_server.py is a single, self-contained Flask application deployable to the Pi on its own (it embeds its own copy of the growth model, so no repository clone is needed on the device). It exposes:
| Endpoint | Description |
|---|---|
GET /api/telemetry |
Full JSON telemetry packet (temperature, humidity, biomass actual/ideal/predicted, growth phase, growth rate) in the exact shape ui/api/hardware.py expects |
GET /api/camera/stream |
One fresh JPEG frame per request (a plain snapshot-per-request contract, since the dashboard backend already polls in a loop for its own MJPEG panel); returns HTTP 503 if no camera is attached, without affecting any other route |
GET /data |
Legacy endpoint, {"temperature": ..., "unit": "Celsius"} |
GET /health |
Liveness check |
Every operational parameter (target temperature, simulated hours-per-second integration rate, sensor device paths, port, camera resolution) is configured via environment variables rather than hardcoded, so the same file can be tuned for real-time or accelerated-demo pacing without editing code.
Dashboard backend ↔ browser
The FastAPI dashboard backend (ui/api/*) serves the frontend over three channels: a WebSocket at /ws/telemetry pushing one packet per second, an MJPEG-style polling endpoint for the camera panel, and a plain REST call (POST /api/advisor/feedback) for the on-demand AI advisor, which is deliberately not called automatically on every telemetry tick, to avoid burning API quota.
Networking topology
The Raspberry Pi and the operator's laptop are typically connected over a direct Ethernet link with no router in between, using manually assigned link-local addresses (e.g. 169.254.243.1/16 on the laptop, 169.254.243.2/16 on the Pi) via nmcli. This topology has one important consequence that shaped several fixes described below: there is no DNS resolution and no route to the public internet on that link — only the Pi and the laptop can see each other.
Blocking I/O and event-loop starvation
An early bug traced to this networking setup: fetch_hardware_packet() and fetch_hardware_frame() used a blocking urllib.request.urlopen() call invoked directly inside async def route handlers. In asyncio, a blocking call inside a coroutine freezes the entire single-threaded event loop for its duration — not just the request that triggered it, but every other connection the server is handling, including brand-new WebSocket handshakes and unrelated routes like /health. This was reproduced directly: with the Pi powered off, a freshly connecting WebSocket client received zero packets for 15+ seconds. The fix wraps every blocking hardware I/O call in asyncio.to_thread(...), moving it to a worker thread so the event loop stays responsive; after the fix, the first packet arrives in 346 ms even with the Pi unreachable.
Honest disconnection semantics
Every hardware-mode telemetry packet carries an explicit hardware_connected boolean. A true cold start (never connected) reports zeroed values and status: "DISCONNECTED"; a mid-session drop reuses the last real reading but marks it stale and flags it, rather than silently loading a static example file and presenting it as live. The frontend renders -- in the metric cards and a distinct muted banner state whenever this flag is false, so a viewer can never mistake a stale or absent reading for a live one. The camera panel follows the identical rule, rendering a distinct "CAMERA OFFLINE" placeholder on a hardware-mode fetch failure instead of silently falling back to the mock mode's synthetic render.
Kiosk display on the Pi's own monitor
Beyond an operator's laptop browser, the exact same dashboard can be shown full-screen on a small monitor physically attached to the Raspberry Pi (scripts/pi_kiosk_dashboard.sh, launching Chromium in --kiosk mode against the laptop-hosted dashboard URL). This surfaced a subtle bug worth documenting: the dashboard's static HTML/CSS shell rendered correctly on the Pi's screen, but no live data ever populated it, even though the identical URL worked perfectly from the laptop's own browser. Direct inspection of the Chromium DevTools console on the Pi revealed net::ERR_NAME_NOT_RESOLVED for third-party CDN hosts (Three.js, Chart.js, and Google Fonts were originally loaded from public CDNs). Because the Pi-laptop link has no DNS or internet route by design, those requests failed — and because the frontend's entry point is an ES module (<script type="module">) importing Three.js by a bare specifier, a single failed import blocked the entire script from executing, not just the failed dependency. The static HTML rendered from server-delivered markup, but zero JavaScript — including the WebSocket connection — ever ran. The fix vendors every third-party dependency (Three.js, OrbitControls, Chart.js, and its date-fns adapter) locally under ui/dashboard/vendor/, served by the dashboard's own backend, so the Pi's browser never needs to leave the link-local network. This was verified with an automated test that blocks every network request to a hostname other than localhost, precisely reproducing the Pi's offline condition, before being confirmed on the physical kiosk display.
Dashboard Software Stack
| Component | Role |
|---|---|
| Python / Flask | Edge service on the Pi (edge/pi_edge_server.py) |
picamera2 |
Pi Camera Module capture |
| Python / FastAPI | Dashboard backend — WebSocket telemetry, camera proxy, static file serving |
| Pillow | Real-time ROI color extraction for the simulated pH indicator |
google-genai |
Gemini AI advisor client (the current SDK; the older google-generativeai package is deprecated) |
| Chart.js | Biomass, growth-rate, temperature, and pH time-series charts |
| Three.js | Colony-timelapse growth visualization (orthographic camera, instanced-mesh colony sprites) |
| WebSocket + polling MJPEG | Live telemetry and camera streaming to the browser |
Colony-timelapse visualization
The growth panel models a real bacterial-colony timelapse rather than an abstract cluster: a fixed number of colonies seed at positions sampled uniformly over the dish's circular area, using
$$ r = R\sqrt{u}, \qquad u \in [0, 1] $$
for a uniform draw \(u\), which is the correct sampling rule for uniform density per unit area on a disc, as opposed to \(r = Ru\) which bunches points near the center. Each colony expands as a growing circle sprite as biomass rises, rendered as a THREE.InstancedMesh with per-instance scale and color so no custom shader is required. Colony coverage is normalized against the running maximum of the ideal biomass curve (a stand-in for carrying capacity), so the same rendering logic auto-scales correctly across the mock, real-hardware, and demo data sources.
Real mode vs. demo mode
Both modes integrate the identical growth formula; only the clock and, in demo mode only, an additional temperature gate differ:
- Real mode — uses the biomass values reported directly by the edge server, integrated at true instrument pace (tuned slow enough, ~0.0005 simulated hours per wall-clock second, that a live viewing session shows only a few tiny colonies at room temperature, which is the biologically honest behavior for real E. coli doubling times).
- Demo mode — integrates the same formula client-side on a compressed clock (~0.28 simulated hours per wall-clock second) and applies a demo-only smoothstep gate on temperature (near-zero growth multiplier below 28°C, ramping sharply to full by 37°C), so the plate stays empty at room temperature and blooms quickly once the sensor is deliberately heated — a presentation aid clearly marked with a "Demo version" badge, and never applied to real-mode data.
Time axes swap correspondingly: minutes for real mode's slow pace, seconds for demo mode's compressed pace.
Simulated pH Indicator
Real bacterial cultures in this setup do not change color enough to be visible on camera, so rather than fabricating an arbitrary signal, the dashboard simulates having dosed the medium with phenol red — the real colorimetric pH indicator used in cell-culture media (DMEM, RPMI, etc.): yellow at low pH, red/pink near neutral, magenta/purple at high pH. Only the pH interpretation of the color is simulated; the color itself is extracted from a real image.
ui/api/color_ph.py crops the same region-of-interest box shown on screen, downsamples and averages it, converts to HSV, and maps hue to pH via a piecewise-linear reference curve fit to the phenol-red convention. Because the real color path (yellow → red → magenta → purple) crosses the 0°/360° wraparound point of the hue wheel, reference hues above 180° are unwrapped into negative degrees before interpolation to keep the mapping monotonic. Per the culture's requirement, pH ≤ 6.8 is classified as "good" (mixed-acid fermentation acidifying the medium is the healthy sign for this organism) and pH > 6.8 as "bad," raising a dashboard alert.
AI Advisor
ui/api/advisor.py sends the current temperature, growth phase, biomass, and simulated pH reading to Google Gemini (via the google-genai SDK), primed with the same E. coli reference numbers driving the rest of the application (37°C optimum, 8–50°C viable range, phenol-red pH convention), and requests one short, actionable recommendation. It is triggered manually via an "Ask AI" button rather than automatically on every telemetry tick, to control API usage. The client library is soft-imported and the request checks for a configured GEMINI_API_KEY, degrading to a clear "not configured" message rather than crashing when the key is absent.
Reliability and Design Principles
Several design decisions recur throughout the system and are worth stating explicitly as engineering principles rather than incidental choices:
- Report zero or "disconnected," never a guess. Unmeasured actuator power, an unavailable humidity reading, or an unreachable Pi are all surfaced explicitly rather than backfilled with a plausible-looking number.
- One source of truth for the growth model, duplicated deliberately. The exact same formula exists in Python (twice, once as the shared module and once embedded in the self-contained edge script) and in JavaScript, verified to agree by sweeping identical inputs through all three rather than assumed to match.
- Degrade a single subsystem, not the whole service. A missing camera returns a 503 on just that route; a missing AI key disables just the advisor button; a disconnected Pi marks telemetry stale without stopping the WebSocket stream.
- No blocking calls on the event loop. All network I/O to the Pi runs on worker threads so a slow or dead hardware connection cannot stall the entire dashboard server for every other client.
Known Limitations and Future Work
- Actuators — no heater or cooling fan hardware is wired up yet; the control loop is currently read-only (sensing and prediction, no closed-loop actuation).
- Camera framing — the camera shows whatever the Pi happens to be physically aimed at; the pH reading is only meaningful once it is pointed at the actual culture vessel.
- AI advisor — requires a user-supplied
GEMINI_API_KEY; without one, only a "not configured" message is shown. - QNX — the original hackathon track targeted QNX specifically; the current build runs on Ubuntu/Raspberry Pi OS for the reasons detailed above. Revisiting QNX with a kernel-level 1-Wire driver (rather than Python-level bit-banging) remains a possible future direction.
- Sensor identity — the DS18B20's unique ID (e.g.
28-000000870030) is specific to the physical sensor and must be re-documented if it is ever replaced; the GPIO pin itself is fixed in the boot configuration, not in the Python code.
Built With
- 1-wire
- chart-js
- css3
- dht11
- ds18b20
- elevenlabs
- fastapi
- flask
- google-gemini
- html5
- javascript
- linux
- mongodb
- mongodb-atlas
- picamera2
- pillow
- python
- qnx
- raspberry-pi
- raspberry-pi-camera-module
- three-js
- ubuntu
- websocket



Log in or sign up for Devpost to join the conversation.