-
-
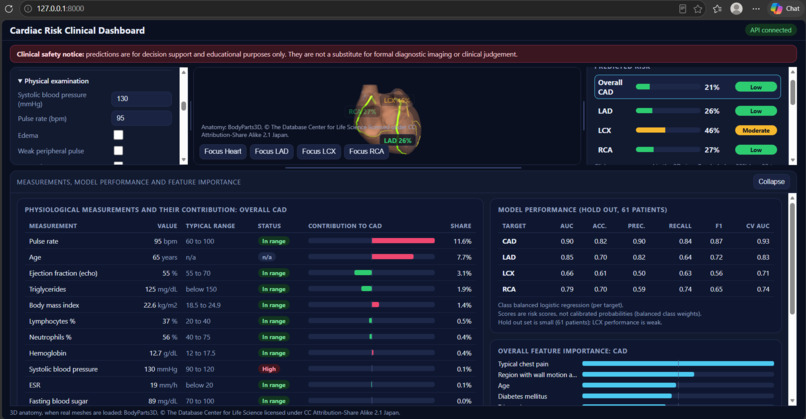
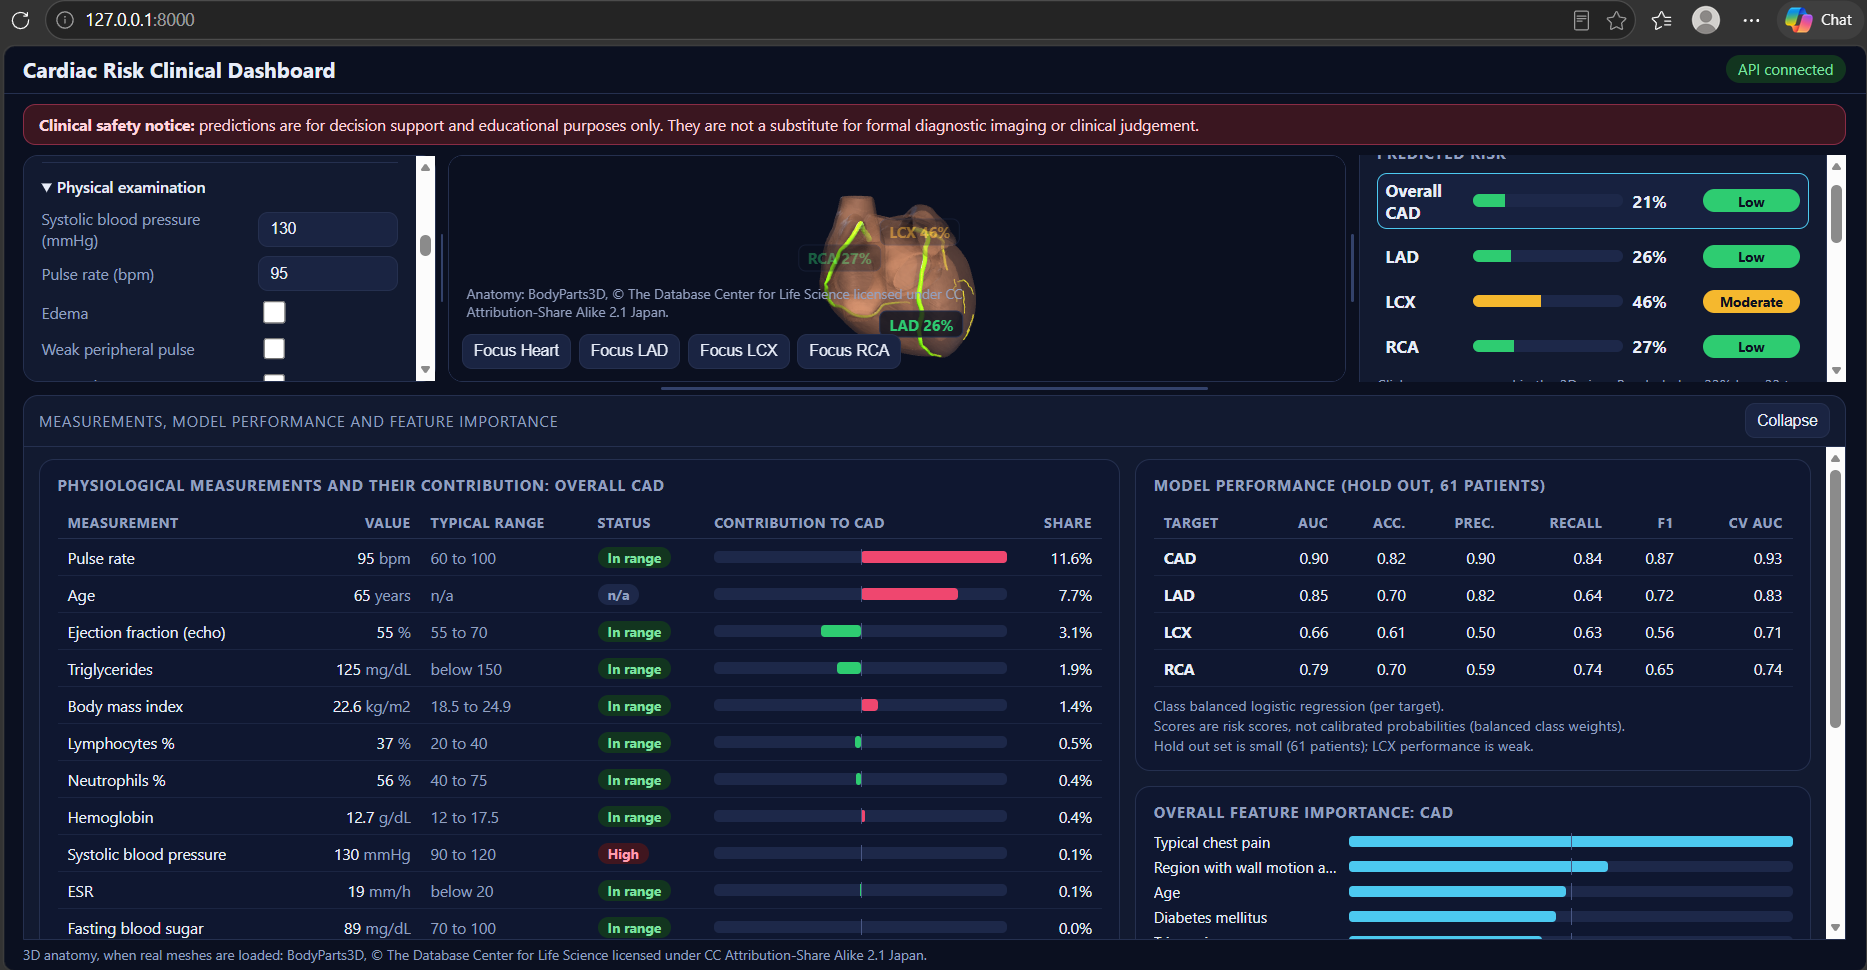
Predicted random patient cad risk
-
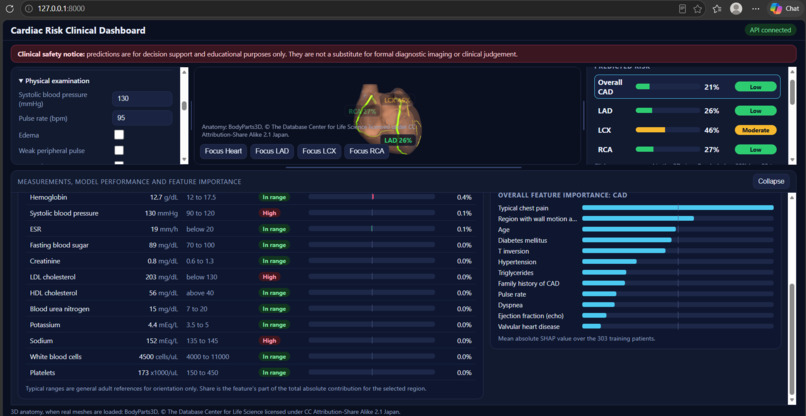
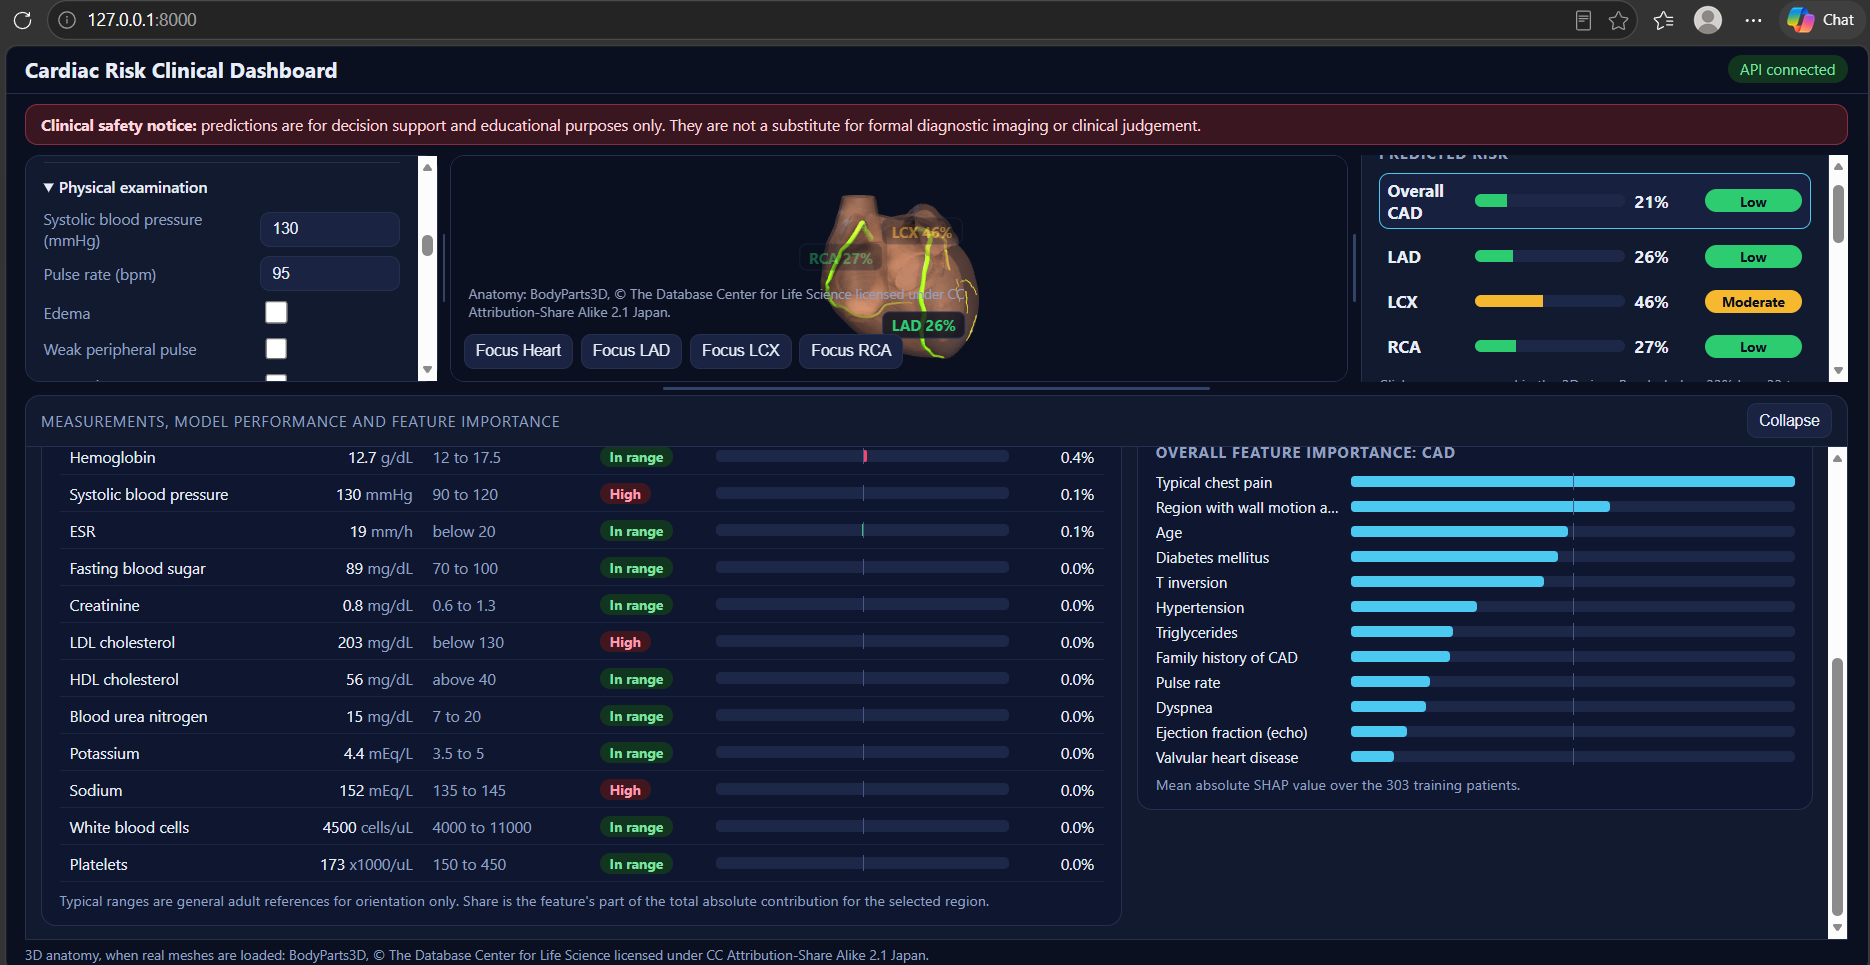
Continue of random patient cad risk
-
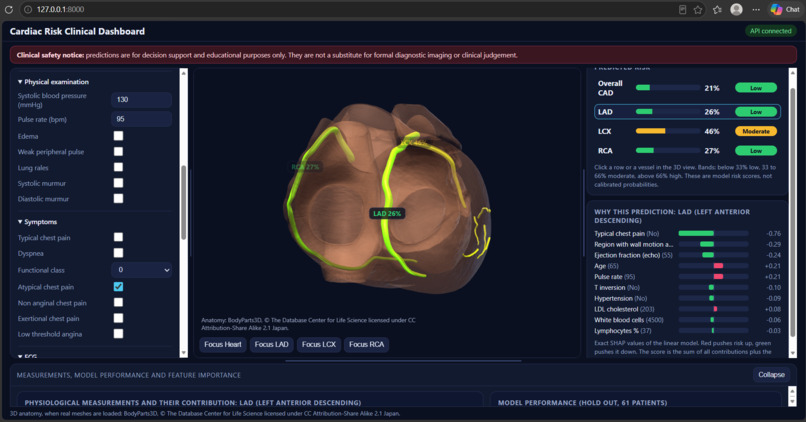
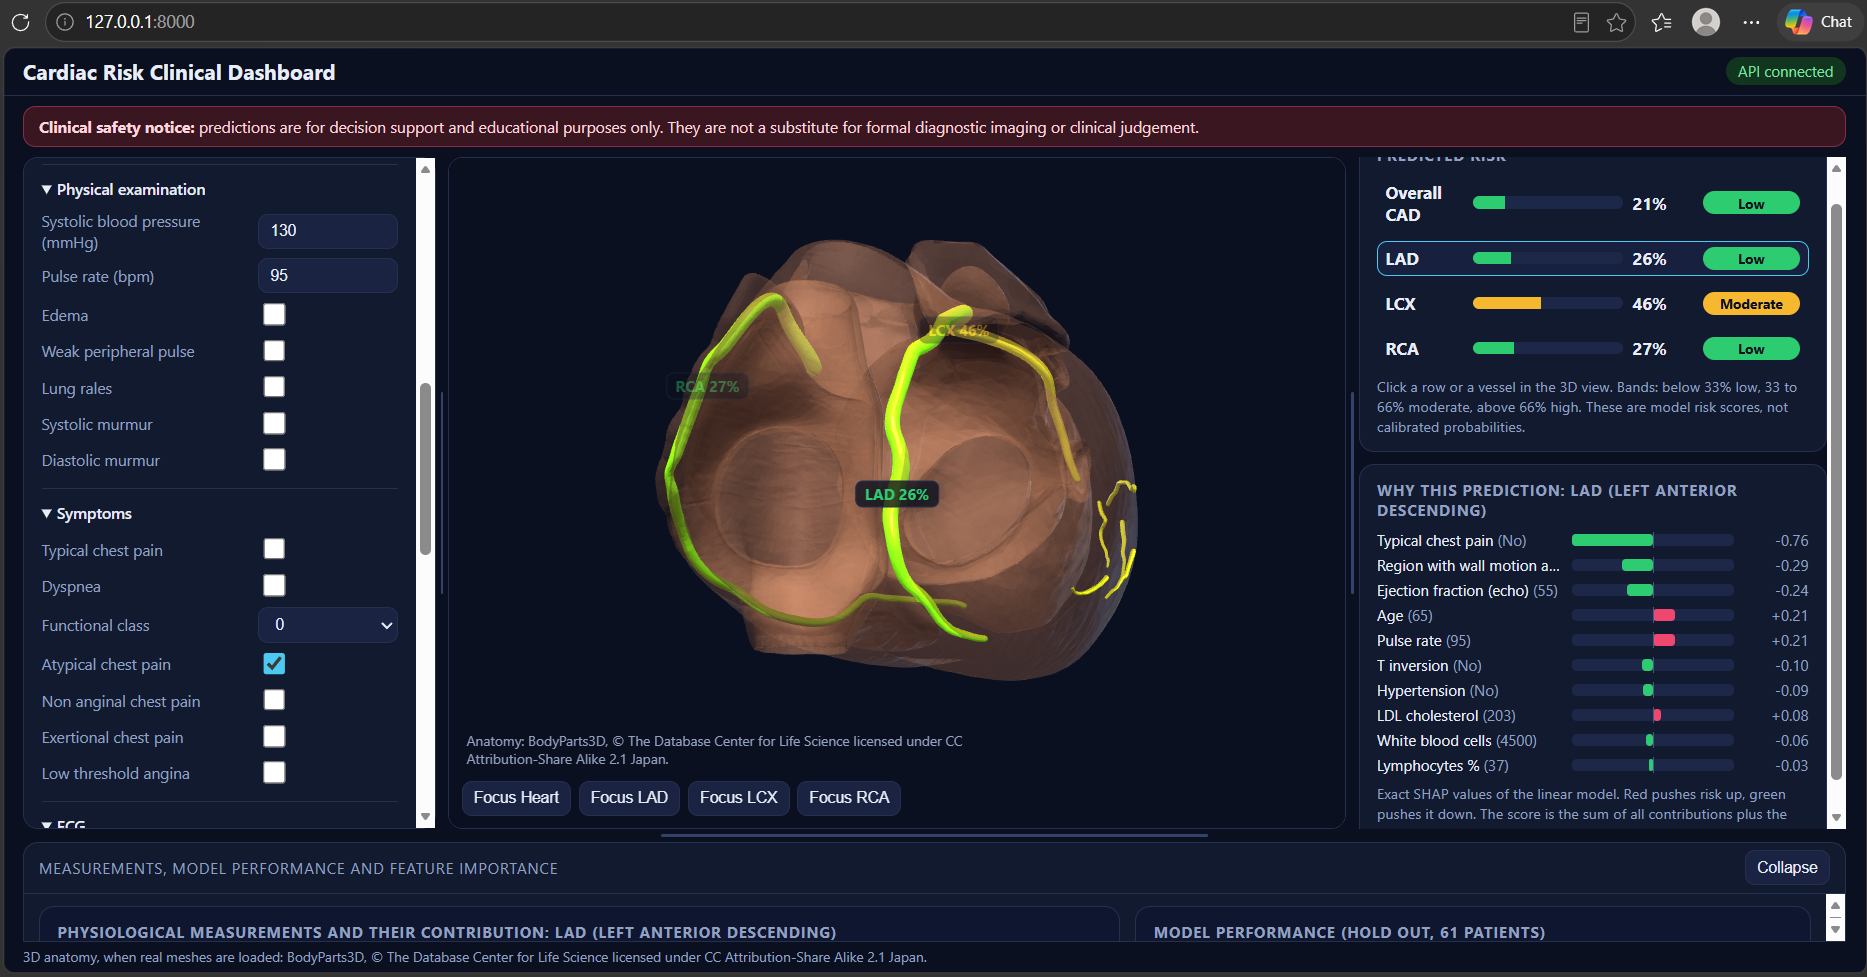
Focus on LAD
-
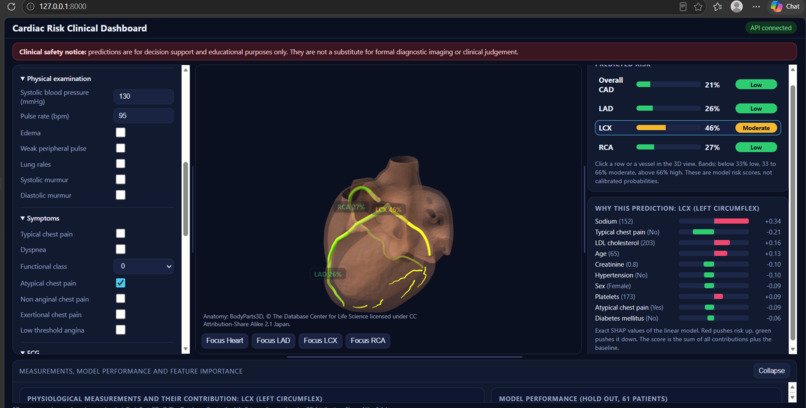
Focus on LCX
-
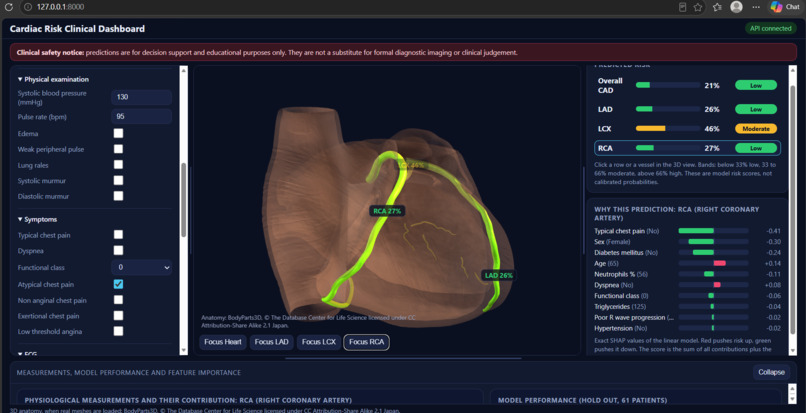
Focus on RCA
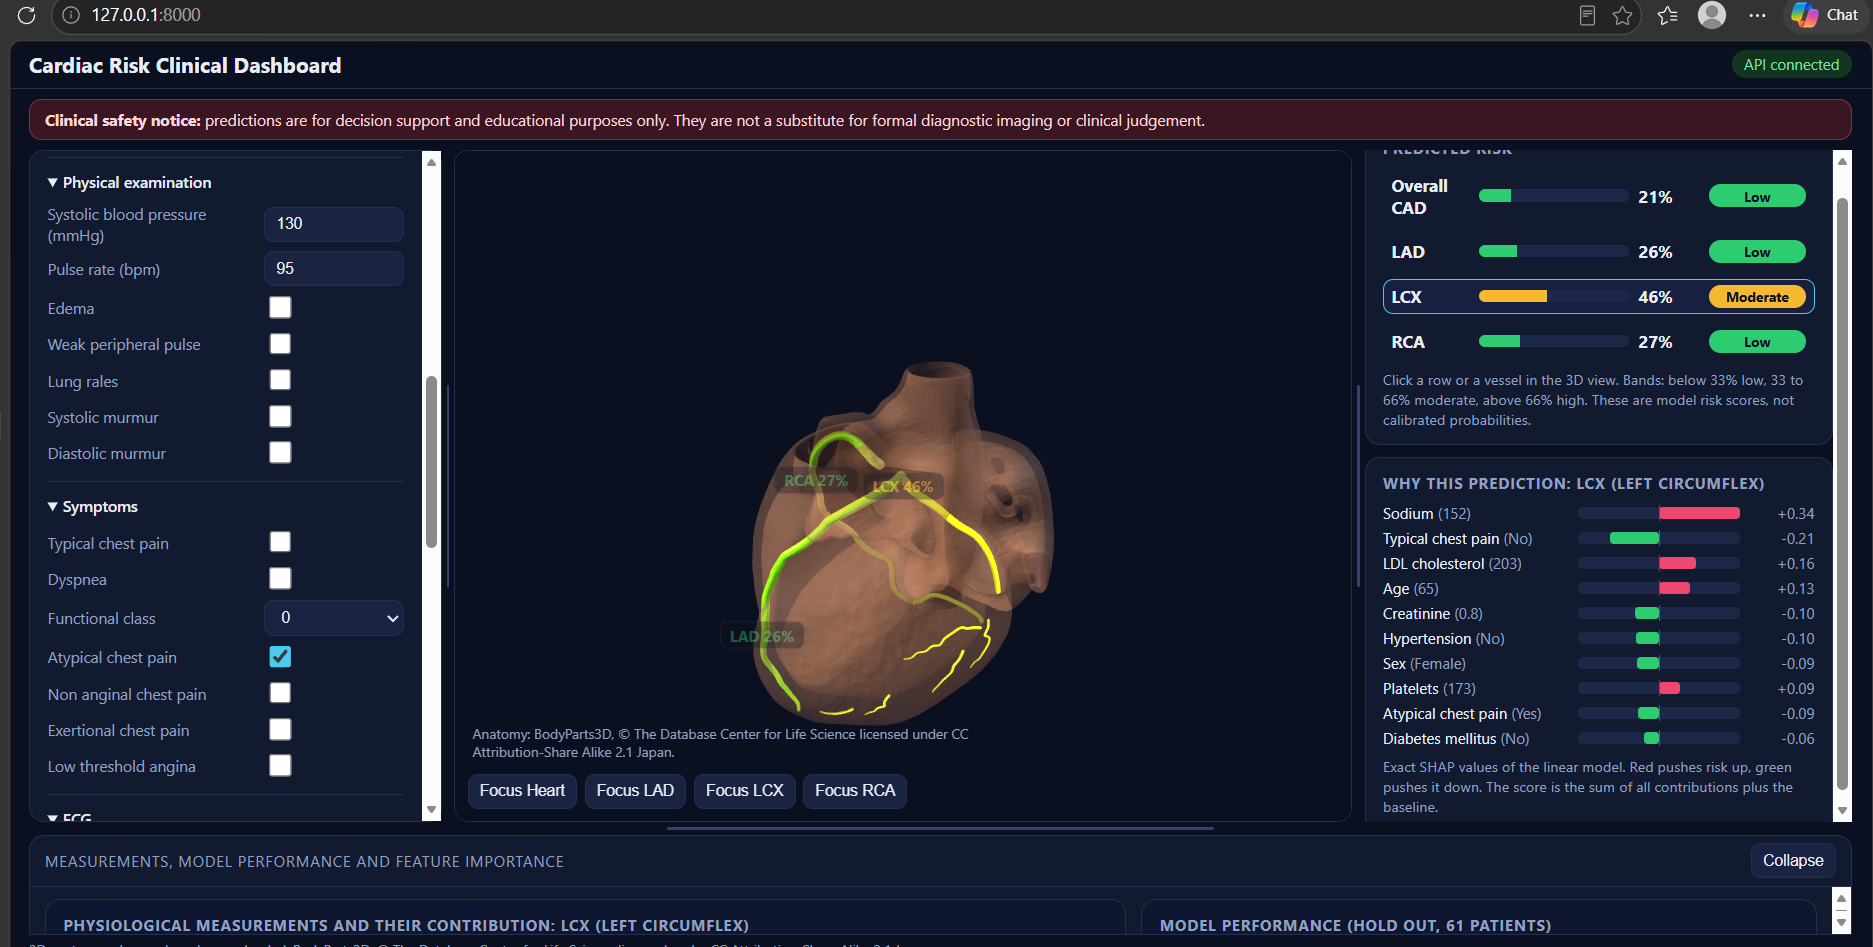
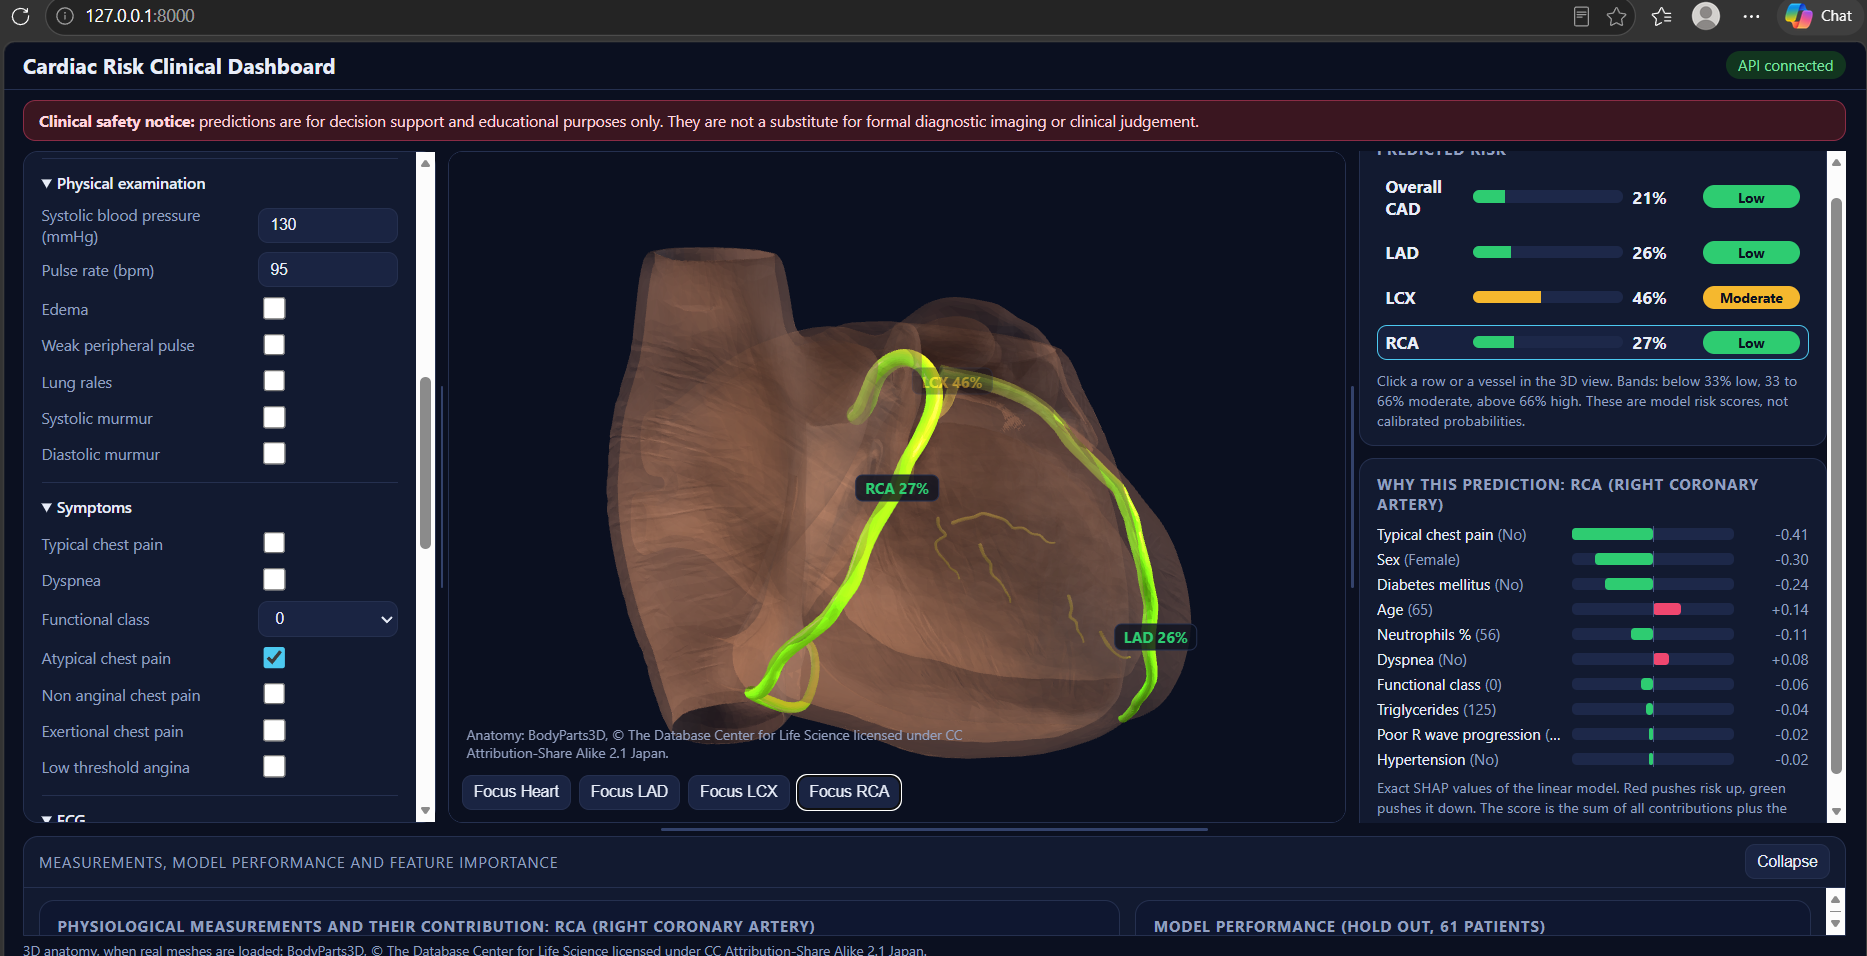
Inspiration
Cardiovascular disease is a major health challenge, and machine learning offers opportunities to identify patterns in clinical data associated with coronary artery disease (CAD). However, numerical risk scores alone can be difficult to interpret, particularly when trying to understand which coronary arteries may be associated with a higher predicted risk.
Inspired by the Multimodal AI Hackathon 2026 Track A challenge, we created Biocore to bridge the gap between AI-generated predictions and visual understanding. Our vision was to combine machine learning, explainable AI, and interactive 3D anatomy to make cardiovascular risk information easier to explore and understand.
What it does
Biocore is an AI-powered cardiovascular risk visualization platform that predicts overall coronary artery disease (CAD) and stenosis risk for three major coronary arteries: the Left Anterior Descending (LAD), Left Circumflex (LCX), and Right Coronary Artery (RCA).
Users can enter or modify patient clinical measurements and view the resulting predictions through an interactive 3D heart visualization. The coronary arteries are colour-coded according to their predicted risk scores, allowing users to explore vessel-specific results.
The dashboard also displays physiological measurements, prediction metrics, and feature-level explanations to help users understand which clinical factors contribute to a prediction. Users can select individual vessels to inspect their corresponding risk details and explanations.
Biocore is designed for educational and decision-support purposes. Its predictions are not a substitute for professional medical judgment or formal diagnostic imaging.
How we built it
We developed Biocore using the Extension of the Z-Alizadeh Sani dataset, which contains 303 patient records with demographic, clinical, laboratory, ECG, and echocardiographic features.
Our development process involved several key stages:
Data preprocessing: We encoded categorical variables, addressed redundant features, handled extreme values using training-derived percentile bounds, and prepared the clinical features for model training.
Leakage prevention: We excluded the target columns Cath, LAD, LCX, and RCA from model inputs to prevent target leakage.
Machine learning: We compared Logistic Regression, Random Forest, and Gradient Boosting using stratified cross-validation and held-out evaluation. We selected class-balanced Logistic Regression for deployment because of its computational efficiency and interpretable feature contributions.
Backend development: We used Python and Flask to build an API that processes clinical inputs and returns model predictions and feature contributions.
3D visualization: We used Three.js to develop an interactive browser-based 3D viewer and incorporated anatomical meshes from BodyParts3D. The LAD, LCX, and RCA are colour-coded according to their respective predicted risk scores.
Explainable dashboard: We integrated patient input controls, risk indicators, physiological measurements, feature-contribution visualizations, and model evaluation metrics into a unified interface.
This approach brought data processing, machine learning, explainability, and 3D visualization together in one application.
Challenges we ran into
One of our biggest challenges was integrating the machine learning backend with the interactive 3D viewer. We needed the predictions generated from clinical inputs to correspond to the correct coronary arteries and be reflected consistently in the visualization and dashboard.
Another challenge was making the predictions understandable. Instead of displaying risk scores alone, we incorporated feature-level explanations to help users explore the clinical factors contributing to the model's outputs.
Working with 3D anatomical meshes also required attention to model orientation, scaling, and the correspondence between anatomical structures and vessel-specific predictions.
We also faced the challenge of developing and evaluating models with a relatively small dataset. Prediction performance varied across the three vessels, with LCX prediction proving particularly challenging. This reinforced the importance of transparent evaluation, careful interpretation, and communicating the limitations of AI-generated predictions.
Accomplishments that we're proud of
Accomplishments that we're proud of
We are proud to have developed an end-to-end prototype that brings together several technologies that are often explored separately.
Our key accomplishments include:
Building a machine learning pipeline for overall CAD and vessel-specific risk prediction.
Comparing multiple classification models and evaluating their performance using appropriate classification metrics.
Developing a Flask backend to connect clinical inputs with model predictions.
Creating an interactive 3D heart visualization using Three.js and anatomical mesh resources.
Connecting vessel-specific predictions to colour-coded coronary artery visualizations.
Integrating feature-level explanations and physiological measurements into a clinical-style dashboard.
Including a clear safety disclaimer that communicates the educational nature and limitations of the system.
Most importantly, Biocore demonstrates how machine learning predictions can be presented through an interactive visual interface rather than as isolated numerical outputs.
What we learned
Through Biocore, we learned how to build an end-to-end machine learning application, from preprocessing clinical data and training classification models to deploying predictions through an API and visualizing them in a browser-based 3D environment.
We gained practical experience with Python, Flask, scikit-learn, Three.js, anatomical mesh integration, classification metrics, cross-validation, target leakage prevention, and explainable AI.
We also learned that building an AI-powered healthcare prototype requires more than achieving good model performance. Interpretability, reliable evaluation, appropriate visualization, and clear communication of limitations are equally important.
The project helped us understand the challenges of combining data-driven predictions with anatomical representations while avoiding the implication that a predicted risk score is equivalent to a confirmed medical finding.
What's next for Biocore
Our long-term vision is to make Biocore a more transparent and intuitive platform for exploring cardiovascular risk, helping users understand not only what an AI model predicts, but also which factors contribute to its predictions and where its limitations lie.
Disclaimer: Biocore is an educational prototype intended for decision-support exploration. Its outputs are model-generated predictions, not confirmed diagnoses or direct measurements of coronary stenosis. The platform must not replace professional medical judgment or formal diagnostic imaging.
Built With
- 3d-visualization
- bodyparts3d
- css
- explainable-ai
- flask
- gradient-boosting
- healthcare
- html
- javascript
- logistic-regression
- machine-learning
- numpy
- pandas
- python
- random-forest
- rest-api
- scikit-learn
- shap
- three.js
- webgl


Log in or sign up for Devpost to join the conversation.