Inspiration
Biochemistry and clinical diagnostics are often taught and practiced in silos dense textbooks on one side and complex laboratory reports on the other. Understanding how a single biomarker anomaly relates to cellular organelles, tissue systems, and targeted drug mechanisms requires synthesizing vast amounts of medical knowledge on the fly. We were inspired to build Biochem Interpreter & AI Diagnostic Workspace to bridge this gap: an interactive, visual-first workspace where medical students, clinicians, and researchers can dynamically map pathways, run biomarker calculations, and query an embedded AI assistant in real time.
What It Does
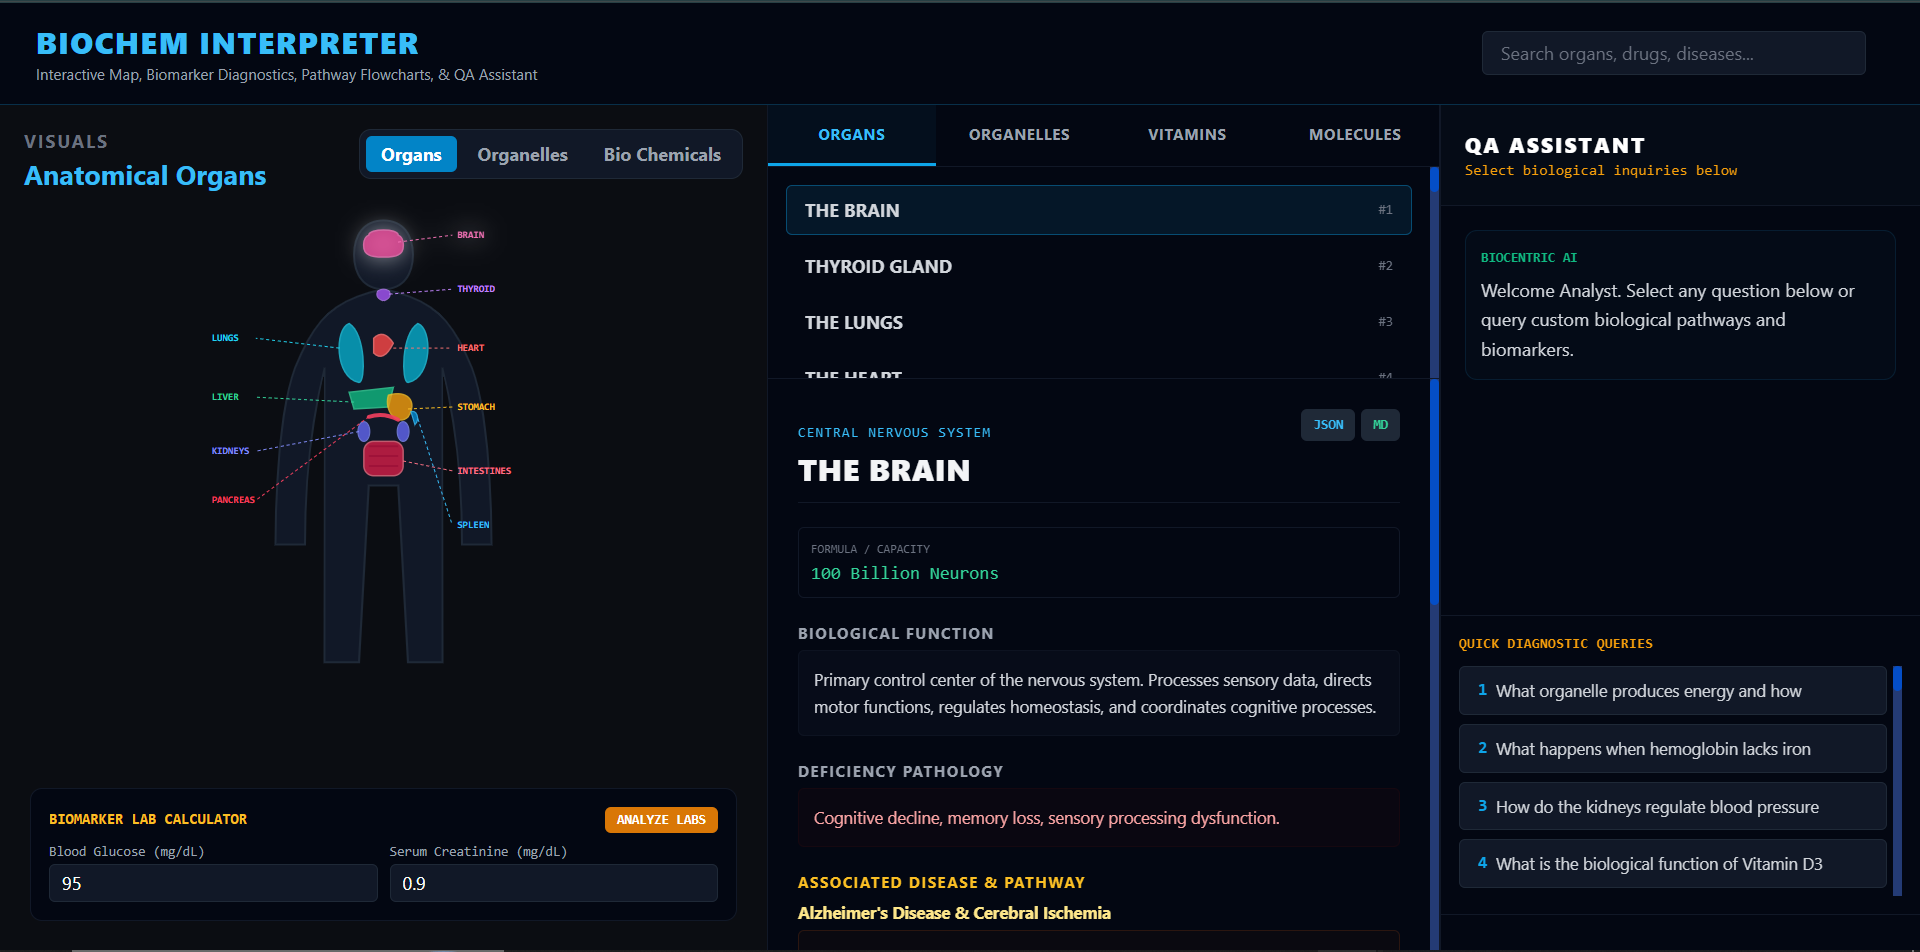
Biochem Interpreter & AI Diagnostic Workspace is an integrated interactive environment designed for metabolic and anatomical exploration:
- Interactive 2D Canvas: Switch seamlessly between Anatomical Organs (Brain, Heart, Liver, Kidneys, Pancreas), Cellular Organelles (Mitochondria, Endoplasmic Reticulum, Golgi Apparatus), and Biochemical Molecules (Vitamins, ATP, DNA, Glucose).
- Biomarker Lab Calculator: Real-time clinical evaluation for biomarkers such as blood glucose, serum creatinine, and metabolic profiles.
- Dynamic Flowcharts & Pathways: Auto-renders interconnected metabolic and disease pathways using Mermaid.js.
- Pharmacology & Target Engine: Maps therapeutic agents directly to their underlying biological mechanisms and organ targets.
- Embedded AI Diagnostic QA: Instant retrieval of complex biochemical relationships and clinical interpretations.
- Global Search: Fast filtering across biological targets, clinical conditions, and pharmacological agents.
How We Built It
- Frontend Architecture: Lightweight, responsive single-page web application built with native HTML5, CSS3, and ES6+ JavaScript.
- UI & Styling: Tailwind CSS framework for modern dark-mode diagnostics aesthetics and responsive panel layouts.
- Pathway Rendering: Integrated Mermaid.js for real-time declarative diagram generation.
- Visual Maps: Custom inline vector SVG graphics for scalable anatomical and biochemical maps.
Technical & Mathematical Concepts
The laboratory interpreter calculates rate reactions and biomarker clearance indices using standard kinetic equations such as:
$$ C = \frac{U \times V}{P} $$
Where C is clearance rate, U is urinary concentration, V is urine flow rate, and P is plasma concentration.
Challenges We Faced
- Dynamic SVG Rendering & Responsiveness: Ensuring vector overlays for anatomical organs, organelles, and molecular structures remained sharp and correctly aligned across varying window dimensions.
- Pathway Synchronization: Parsing complex metabolic networks into clean, readable Mermaid.js charts without cluttering the diagnostic UI.
- State Management: Seamlessly linking user selections from the global search bar across both the visual canvas and the clinical diagnostic panels.
Accomplishments We're Proud Of
- Successfully combining three distinct analytical views (Anatomical, Cellular, and Molecular) into a single cohesive visual interface.
- Creating a zero-dependency frontend stack that renders visual interactive maps and dynamic flowcharts instantaneously.
- Building a seamless workflow connecting biomarker inputs to diagnostic summaries and target pharmacology.
What We Learned
- Advanced manipulation of dynamic SVG overlays for clinical mapping.
- Efficient client-side diagram rendering using Mermaid.js syntax generation.
- Structuring clean UI hierarchies for multi-panel clinical tools without overloading user focus.
What's Next for Biochem Interpreter
- Expanded Predictive Modeling: Incorporating multi-marker diagnostic scoring algorithms.
- 3D Structural Rendering: Expanding biochemical molecules into interactive 3D WebGL renders.
- EHR Integration: Exploring integrations with clinical health record standards (FHIR/HL7) for direct lab import.
Built With
- biochemistry
- css3
- html5
- javascript
- mermaid.js
- svg
- tailwind


Log in or sign up for Devpost to join the conversation.