-
-
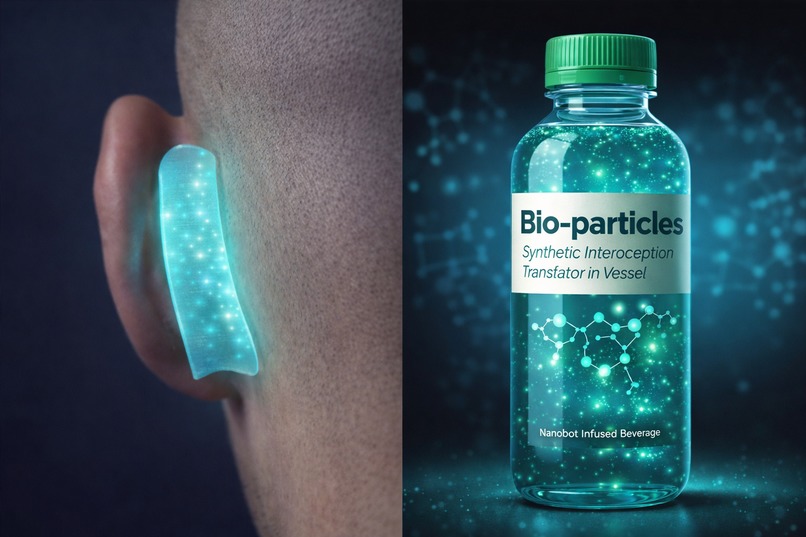
Bio-particles product mock
-
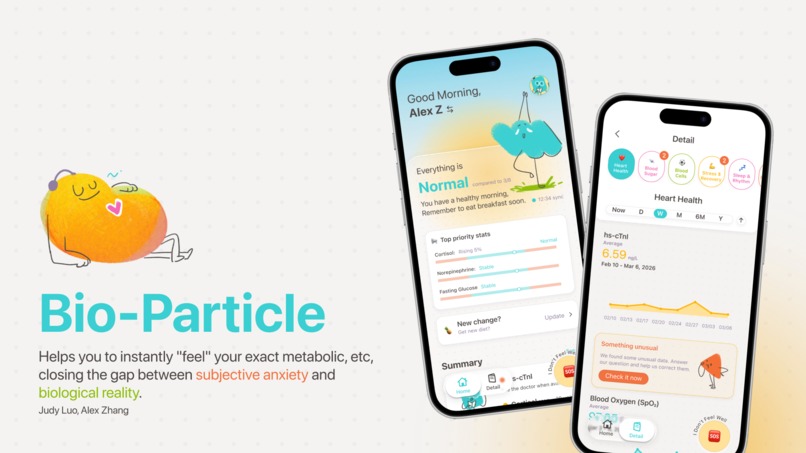
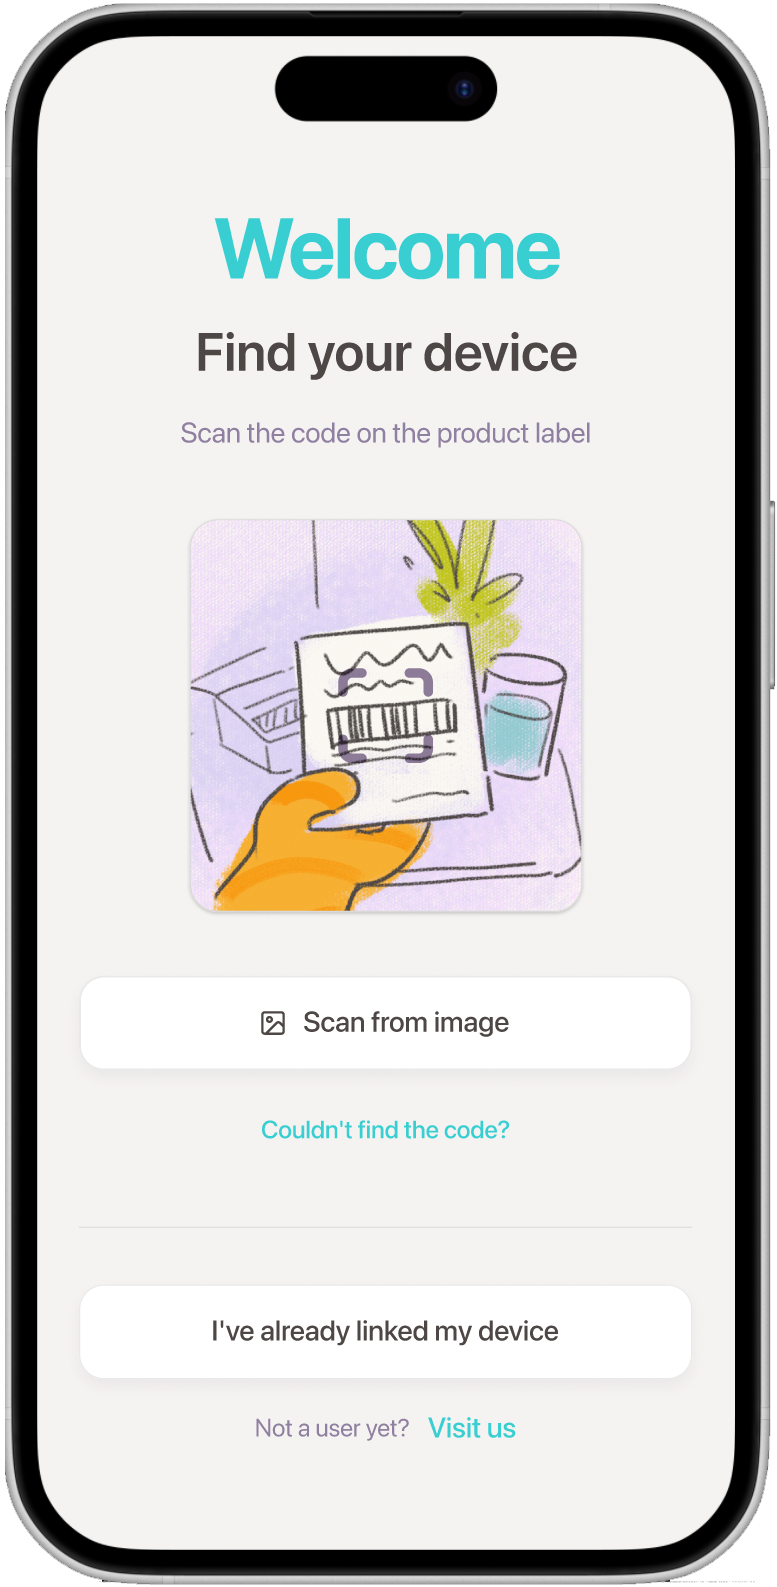
cover
-
app 1
-
app 2
-
app 3
-
app 4
-
app 5
-
app 6
-
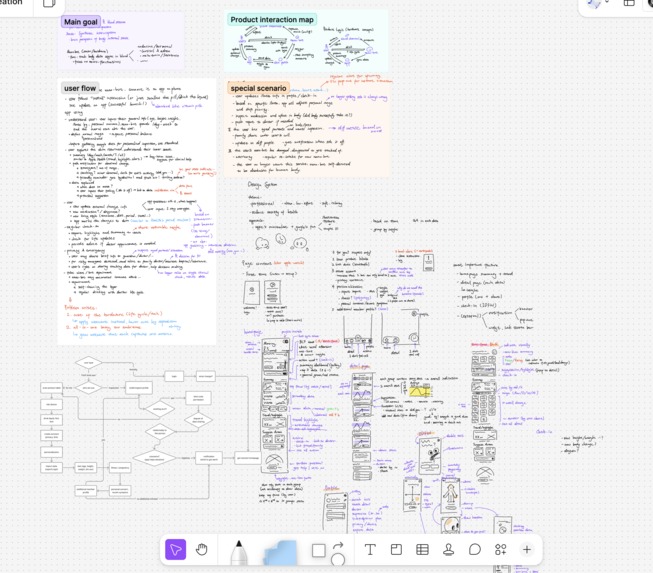
Ideation process


Inspiration
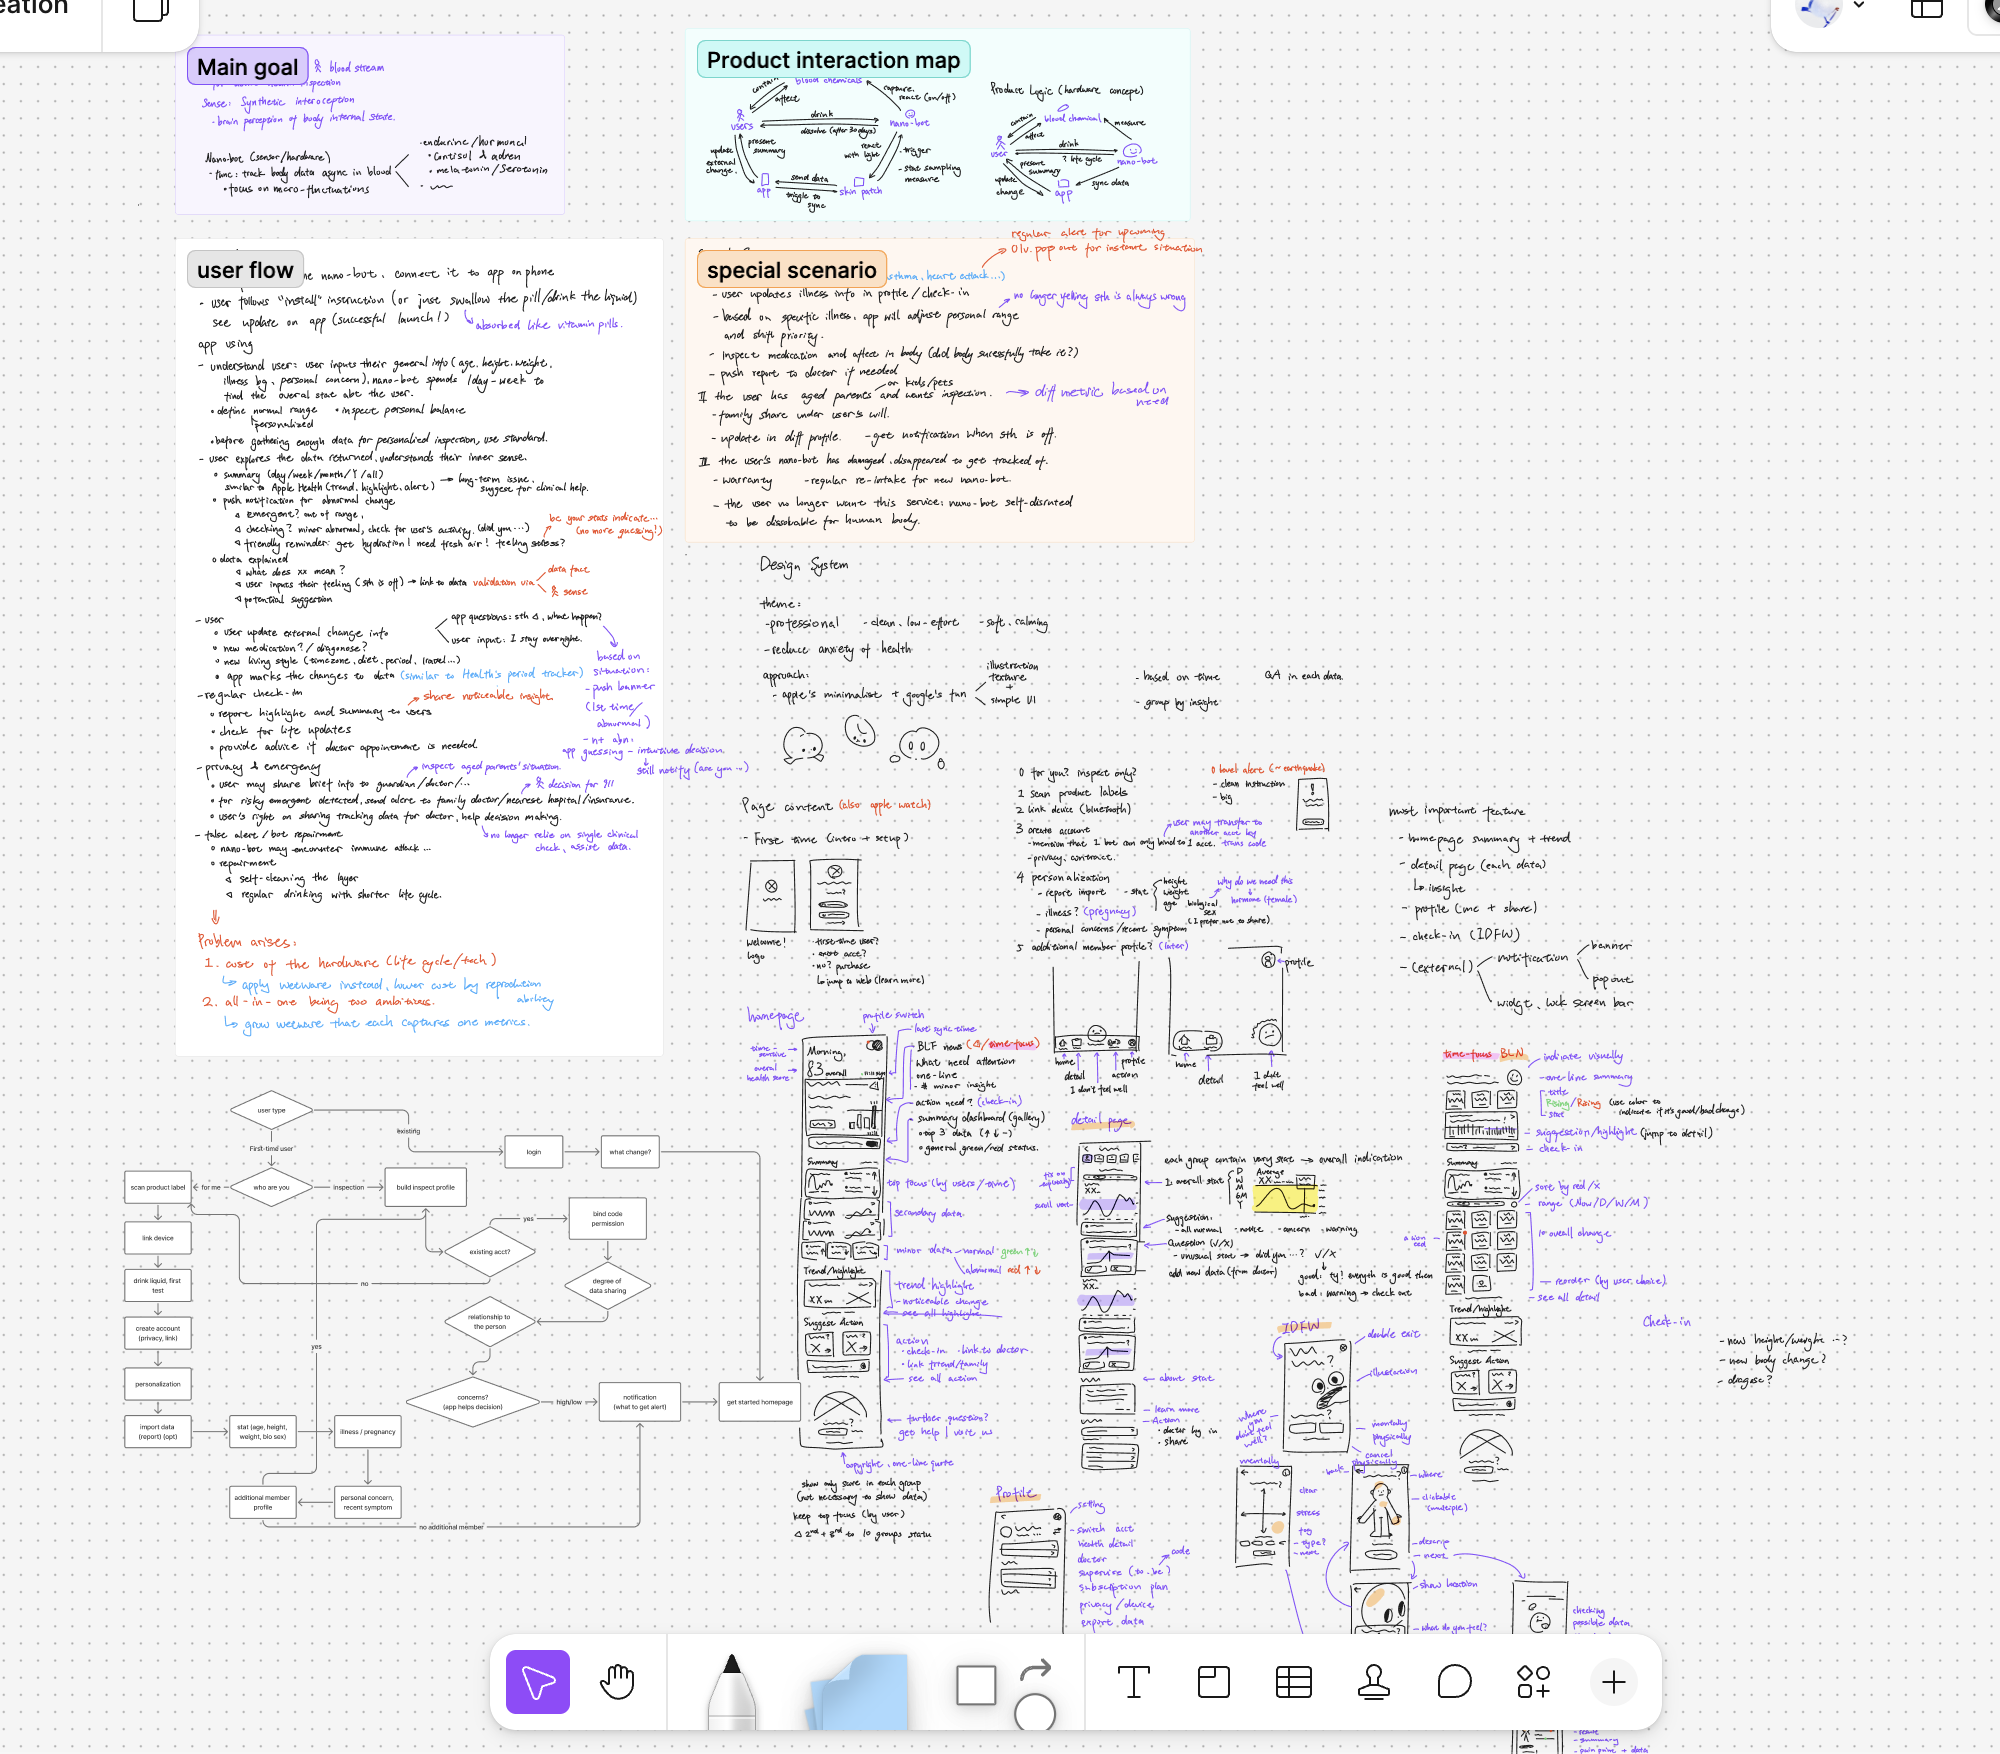
People frequently experience vague, recurring symptoms—chest tightness, fatigue after meals, nighttime heartburn—and enter an anxious loop: Google symptoms, panic, debate whether it's worth a $300 doctor visit, then get told labs are "perfectly normal." Our Reddit research confirmed this pattern: users tolerate vague anxiety for weeks until an emotional breaking point forces action, and even then, normal lab results feel dismissive rather than reassuring. We realized the core gap isn't diagnosis—it's that humans have no way to objectively validate what they're feeling inside their own bodies in real time. The existing sense of interoception is too vague, and clinical labs only capture a single snapshot. We wanted to bridge that gap.
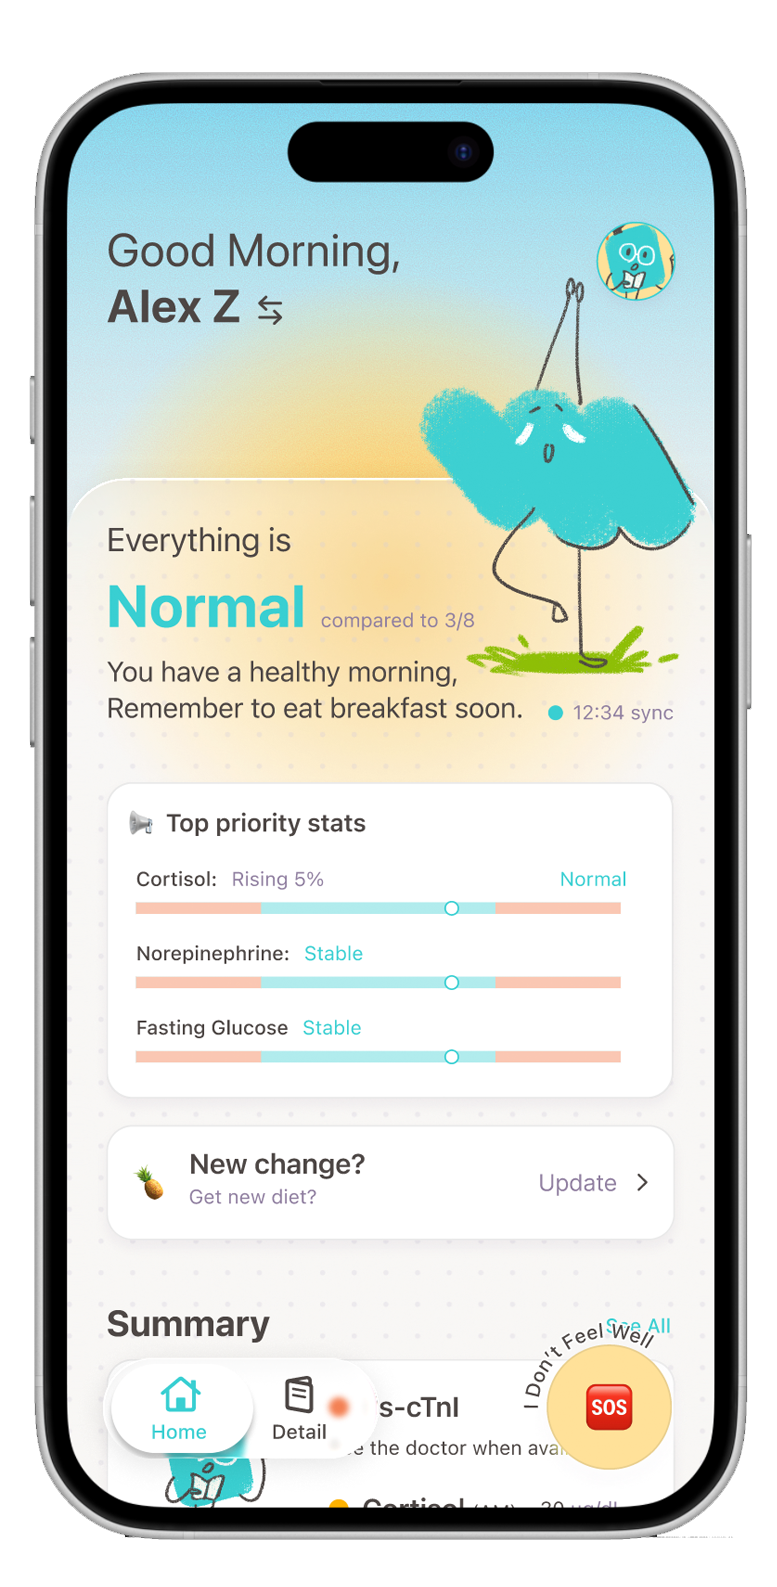
What it does
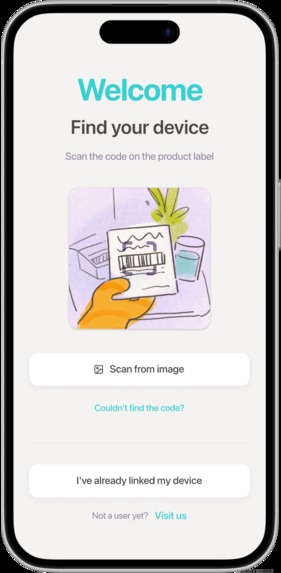
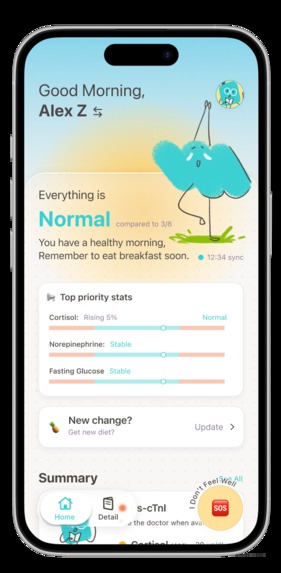
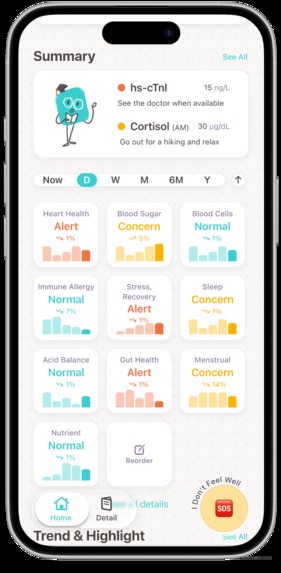
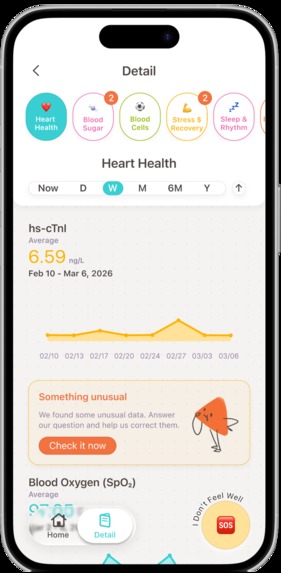
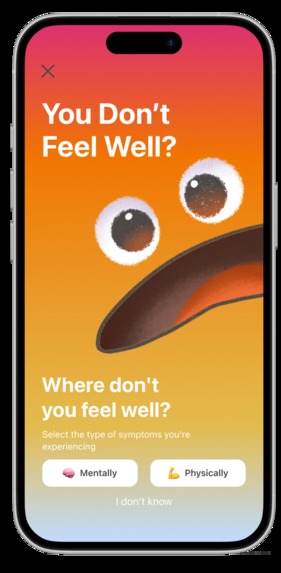
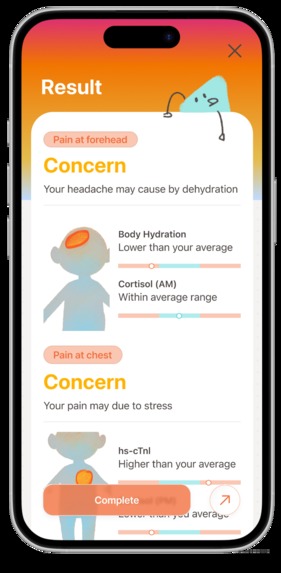
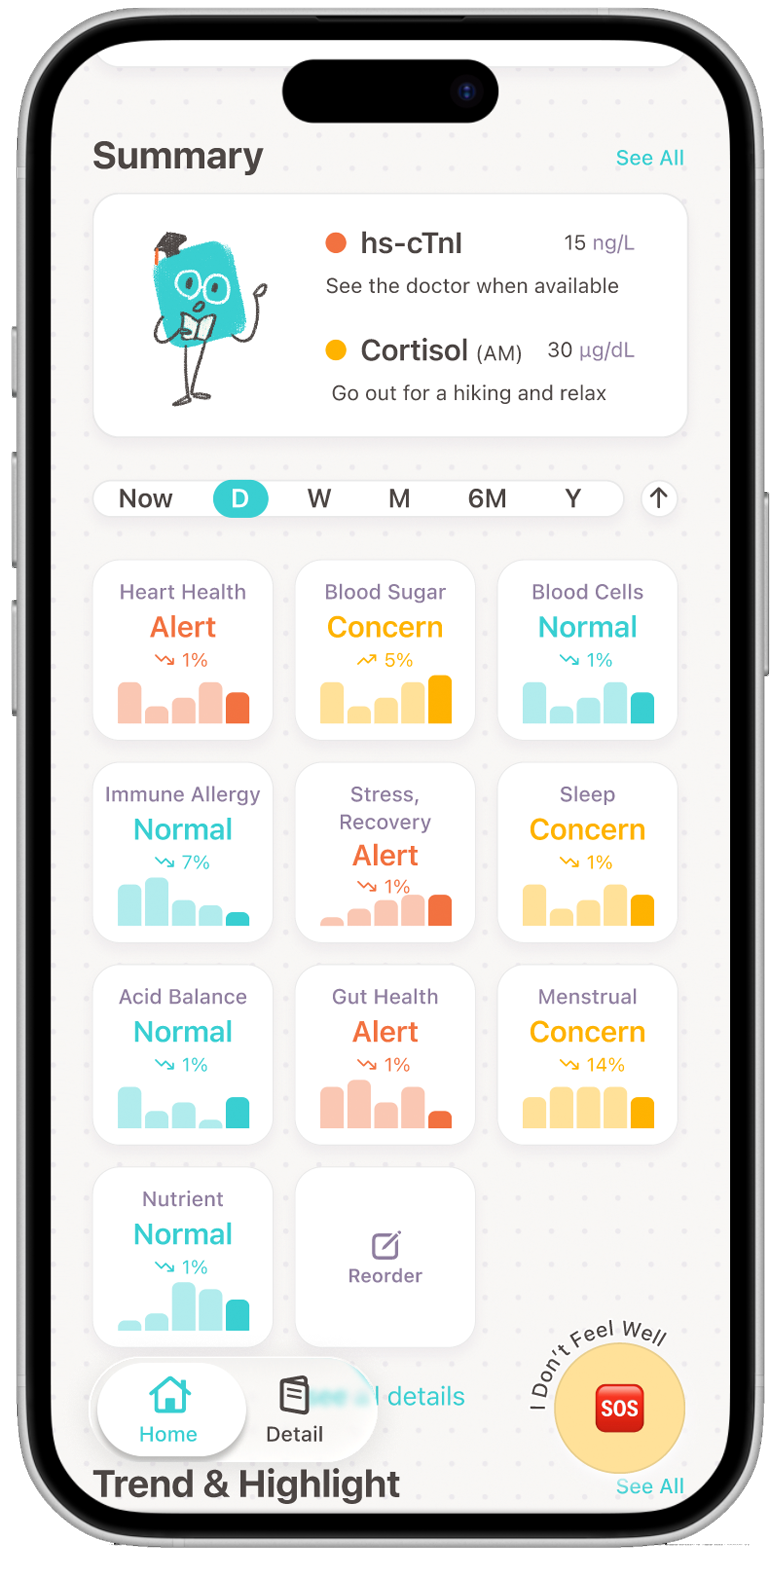
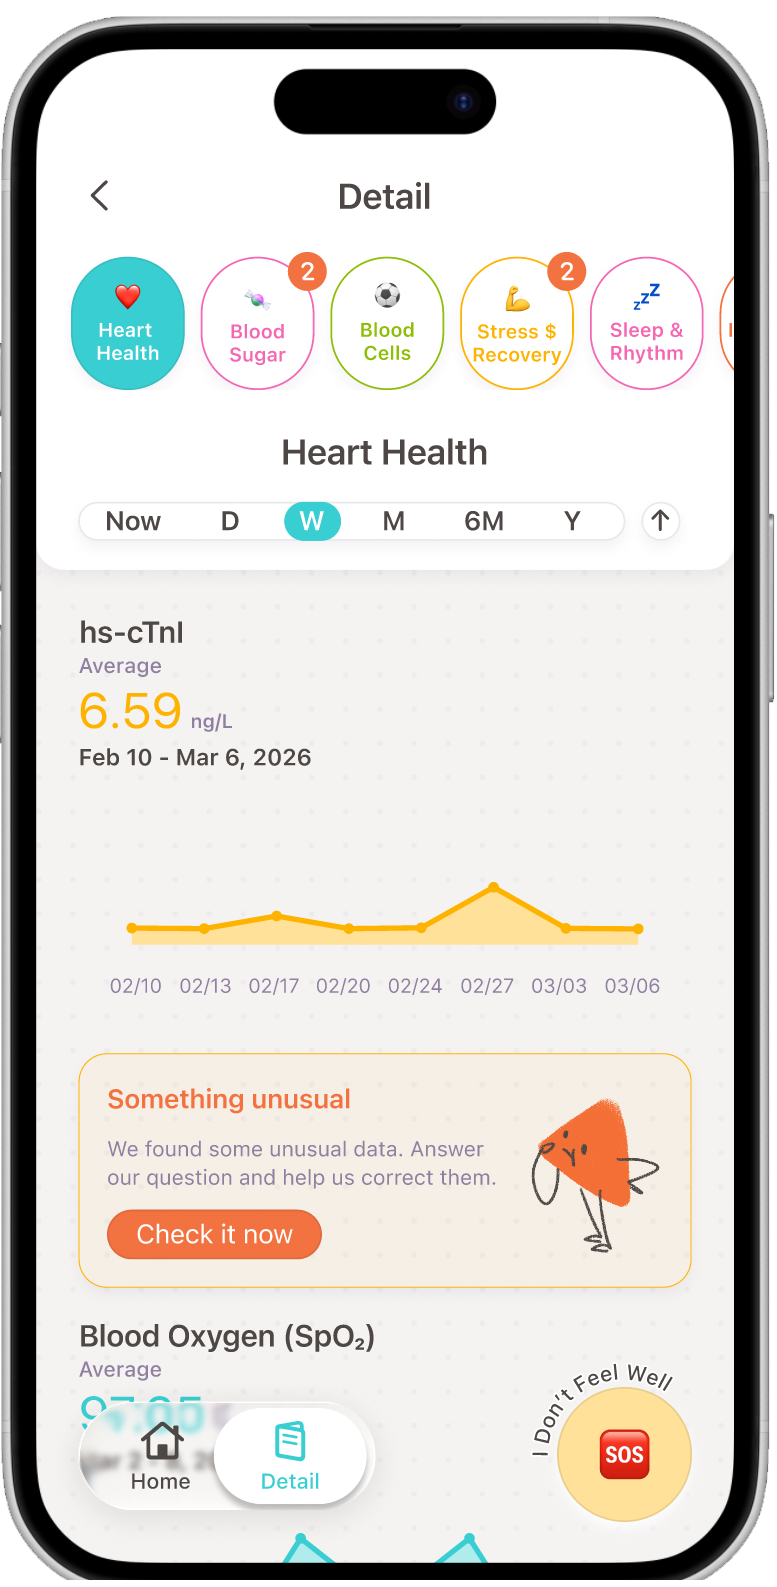
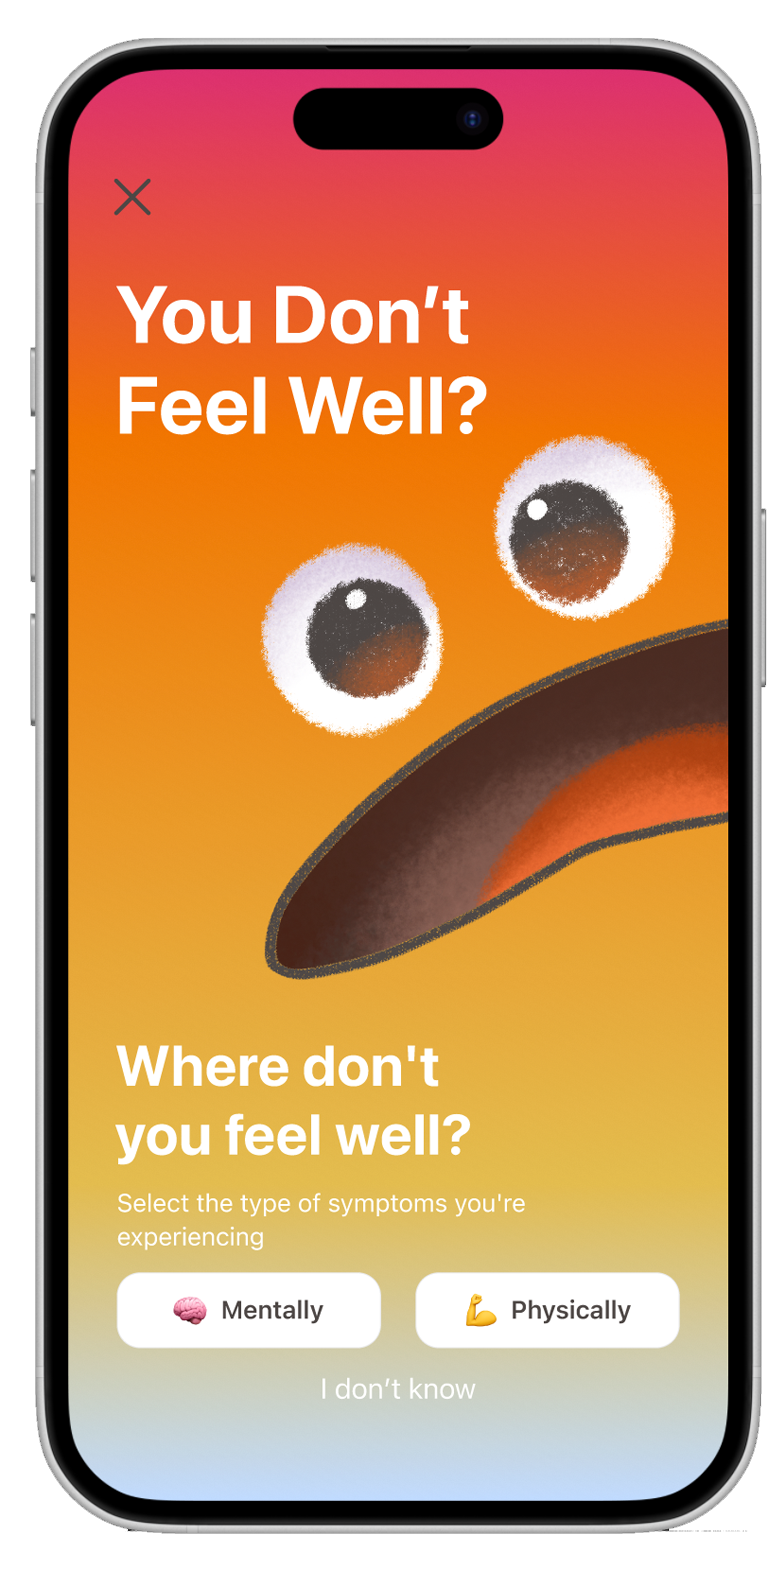
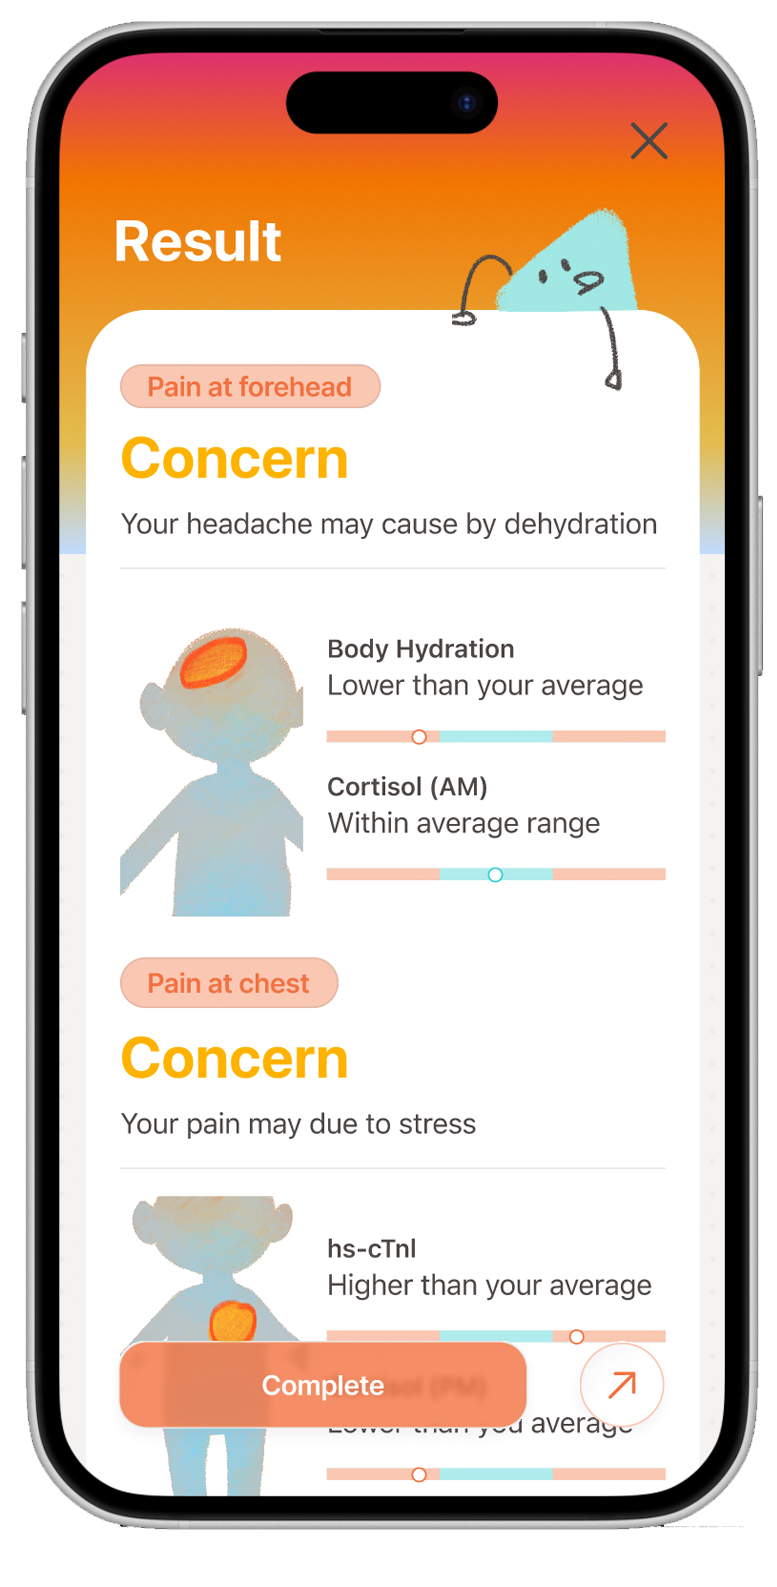
Bio-particles is a conceptual synthetic interoception system: ingestible nanoscale biosensors that flow through the bloodstream and continuously measure internal biomarkers—inflammation (CRP, IL-6), metabolic state (glucose, insulin, lactate), immune activity (histamine, WBC, PCT), hormonal cycles (estradiol, progesterone, LH for menstrual tracking), and critical cardiac markers (hs-cTnI). The data syncs to a companion mobile app that shows a "Personal Normal" trendline against the user's own baseline rather than broad clinical averages. Users can tap "I Don't Feel Well (IDFW)" to timestamp subjective symptoms against objective biochemical data. If markers deviate from their personal baseline for a sustained period, a "Time to Go" alert gives them concrete evidence to bring to a clinician — shifting the paradigm from "Are you dying right now?" to "Why do you feel awful today compared to yesterday?"
How we built it
We first built the design fully on Figma Design, with hand-crafted illustrations, plots, and figures. We also used Figma Make to generate a sketch of the pages and implement our design based on that sketch. We then built a mobile-first web prototype using React with Tailwind CSS for the biomarker trendline visualization, styled in light mode with cute illustrations for a warm, helpful, and friendly feel. Biomarker data is mocked via hardcoded data in Supabase, simulating a 30-day data stream across our defined biomarker categories. We developed a detailed data specification covering 30+ biomarkers across endocrine, metabolic, immune, hematological, female reproductive, and cardiac categories—each with phase-specific normal ranges, clinical significance at high/low values, and monitoring priority ratings. The "IDFW" button overlays subjective timestamps onto the continuous data graph, and the "Time to Go" alert banner is conditionally rendered based on the data state. The prototype is designed as a Wizard-of-Oz setup for user testing—the researcher can manually trigger alert states during interviews to gauge emotional reactions.
Challenges we ran into
Defining clinically meaningful biomarker ranges that are simultaneously accurate and understandable to non-medical users was a major challenge. Many biomarkers have phase-dependent ranges (e.g., estradiol varies dramatically across menstrual cycle phases), high individual variability (e.g., β-endorphin), or fast half-lives that make continuous monitoring interpretation complex (e.g., epinephrine at 1–2 min half-life). We also had to carefully navigate the line between providing validation and inducing more anxiety — our guardrail metric explicitly requires the interface not to increase user panic. Balancing radical simplicity (no medical jargon, relative scales only) against the depth of 30+ biomarkers with real clinical logic was a constant tension.
Accomplishments that we're proud of
We're proud of the comprehensive data specification—mapping 30+ biomarkers with priority tiers, normal ranges, clinical interpretations, and automated detection patterns (e.g., the menstrual phase detection matrix combining E2/P4/LH trends and the cardiac emergency pattern table cross-referencing hs-cTnI with lactate, PCT, and NT-proBNP). We also developed a clear product philosophy that avoids diagnostic triage or lifestyle coaching—the system only reports deltas from personal baselines, which keeps it honest and prevents the "WebMD effect" of scaring users with disease labels. The user journey design, grounded in real Reddit research about emotional breaking points and the "Gaslit Googler" persona, feels authentic rather than hypothetical.
What we learned
We learned that the core emotional need isn't information—it's validation. Users don't want to be told what's wrong; they want proof that what they feel is real. This insight shaped every design decision: showing personal baselines instead of clinical averages, timestamping subjective feelings against objective data, and framing alerts as "permission slips" to seek care rather than diagnoses. We also learned how much complexity hides behind "simple" health data—a single biomarker like serum iron or blood sugar can fluctuate 2× after a meal, making naive continuous monitoring misleading without careful contextual interpretation.
What's next for Bio-particles: Synthetic Interoception translator in vessel
What's next for bio-particles: a synthetic interoception translator in vessel The most critical next step is advancing the core wetware—the nano-sized biological material bots themselves. Without a functioning biosensor that can survive in the bloodstream, harvest energy from body heat or blood flow, and reliably assay even one biomarker in real time, the product remains conceptual. Immediate research priorities include biocompatibility and immune evasion (preventing the body from attacking the particles), miniaturized continuous biomarker assay mechanisms (starting with a single high-priority marker like glucose or lactate), and a viable data transmission pathway from inside the vessel to an external receiver like the ear-mounted sticker. Once the foundational hardware reaches proof-of-concept, the next layer is expanding from one biomarker to multi-analyte sensing across our defined priority tiers and validating that the "Personal Normal" baseline approach holds with real biological noise rather than mocked data. From there, the product roadmap includes supervised monitoring for family members (aging parents, children with chronic conditions), condition-specific panels (e.g., DKA early warning combining β-hydroxybutyrate + glucose + pH), female reproductive cycle tracking via real-time hormone curves, and predictive alerts that catch deviations before symptoms manifest. Longer-term, the wetware platform could extend to animal interoception for veterinary care. But all of that depends on the wetware working first—that is the bottleneck everything else builds on.


Log in or sign up for Devpost to join the conversation.