-

Big Belly Bin Hotspot Analysis
Inspiration
Boston University has committed to an ambitious Zero Waste Plan: diverting 90% of waste from landfills and incineration by 2030 through initiatives like Choose to Reuse, increased recycling, and composting. As part of this effort, BU has deployed BigBelly smart waste bins across campus, bins that automatically monitor fullness levels, collection times, and locations in real time.
When the BU sustainability team shared their BigBelly data with us, we noticed a clear imbalance: some bin locations were consistently overcrowded with delayed pickups, while others were barely used. We wanted to turn that raw data into actionable insights, helping BU make smarter decisions about where and when to collect waste, directly supporting their 2030 goal.
What It Does
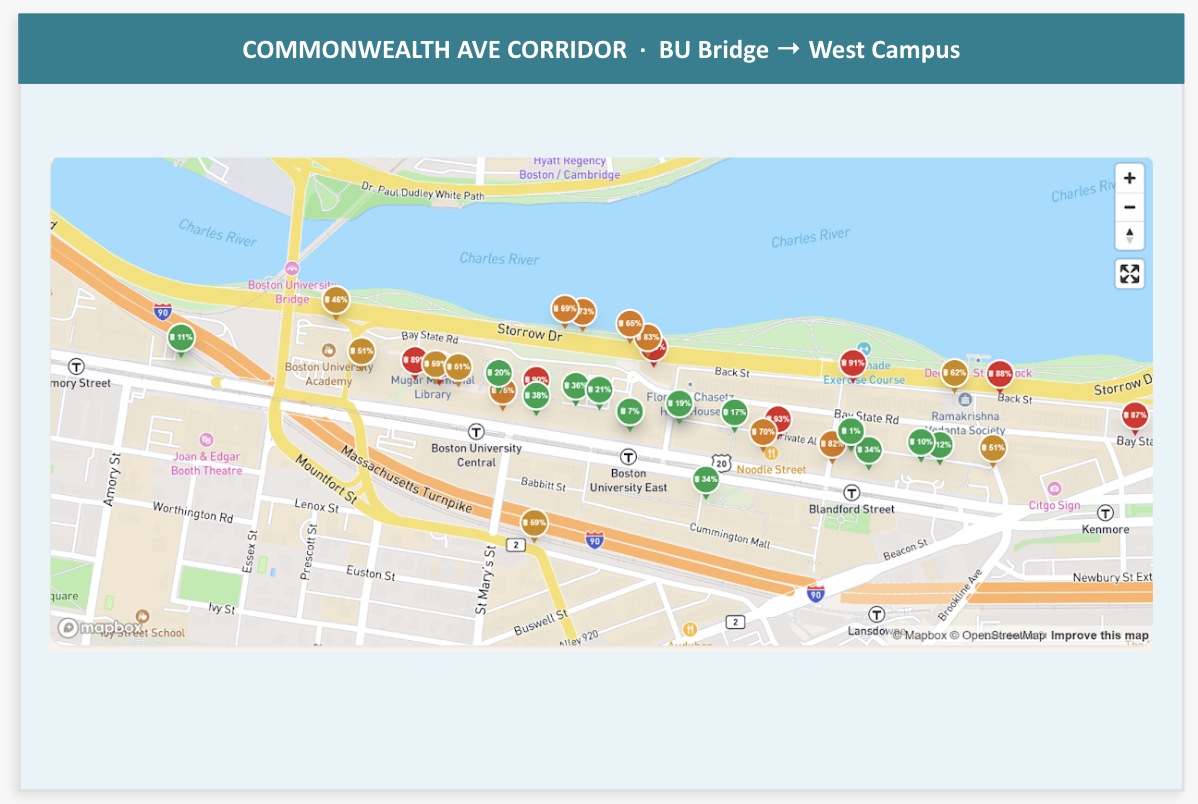
Bin There Done That is an interactive dashboard that visualizes waste collection patterns across BU's campus using BigBelly smart bin data.
The core of the project is our Hotspot Metric — a score that quantifies bin stress by factoring in how long a bin takes to be picked up relative to how full it is at collection:
\text{Hotspot Score} = \frac{\text{Avg. Days to Pickup} \times 0.80}{\text{Avg. Fullness at Collection}}
A low score indicates a bin that fills up to 80% quickly, a true waste hotspot that needs more frequent service or additional bins nearby. A high score indicates a slower-filling bin that may be underutilized.
A low score indicates a bin that fills up to 80% quickly — a true waste hotspot that needs more frequent service or additional bins nearby. A high score indicates a slower-filling bin that may be underutilized.
The dashboard also provides:
- A map view of all bin locations across campus, color-coded by hotspot score
- Collection trend charts showing pickup frequency over time
- Fullness trend charts showing how fast bins fill up by location
How We Built It
- Data Analysis — We analyzed BigBelly collection data provided by the BU sustainability team, covering bin fullness levels, collection times, and locations across campus. We focused on December 2025 as the most recent and complete snapshot of active bin locations.
- Trend Analysis — We identified patterns in waste collection frequency and bin fill rates across different campus locations.
- Hotspot Metric — We defined and computed the hotspot score to rank locations by waste collection efficiency.
- Geocoding — We cleaned and standardized inconsistent location descriptions from the dataset, then geocoded them using ArcGIS Pro to obtain precise coordinates for mapping.
- Dashboard Development — We built an interactive dashboard using:
- Frontend: React.js, Tailwind CSS, Mapbox GL JS
- Backend: Node.js, Express.js
- Database: SQL
- AI: OpenAI API
Challenges We Ran Into
The biggest challenge was the inconsistency of location data across the dataset. The same physical bin location was often described differently across records, making it difficult to build a consistent spatial narrative across the full dataset. To address this, we manually standardized all location descriptions into clean, structured address fields and focused our analysis on December 2025 data, which represents the most recent and complete set of active bin locations.
Accomplishments That We're Proud Of
- Successfully geocoding and mapping all active bin locations across BU's campus onto an interactive dashboard
- Defining a meaningful Hotspot Metric that gives the sustainability team a clear, interpretable signal of where to focus their efforts
- Building a full-stack dashboard that brings together data cleaning, geospatial analysis, and interactive visualization into a cohesive tool
What We Learned
- Working with real-world, messy data is far more challenging than clean datasets and being transparent about data limitations is just as important as the analysis itself
- Geospatial data cleaning requires careful standardization before any meaningful mapping can be done
- Mapbox GL JS is a powerful library for building interactive, performant map visualizations on the web
What's Next for Bin There Done That
We hope to expand the analysis to compare bin locations across multiple years identifying which locations have historically been optimal and which have consistently underperformed. We also aim to work closely with BU's sustainability team to use our hotspot findings to inform better bin placement across campus, adjusting collection schedules and reallocating underutilized bins to directly support BU's Zero Waste 2030 goal.
Built With
- express.js
- mapbox
- node.js
- openai
- react.js
- sql
- tailwind
- tailwind-css


Log in or sign up for Devpost to join the conversation.