-
-
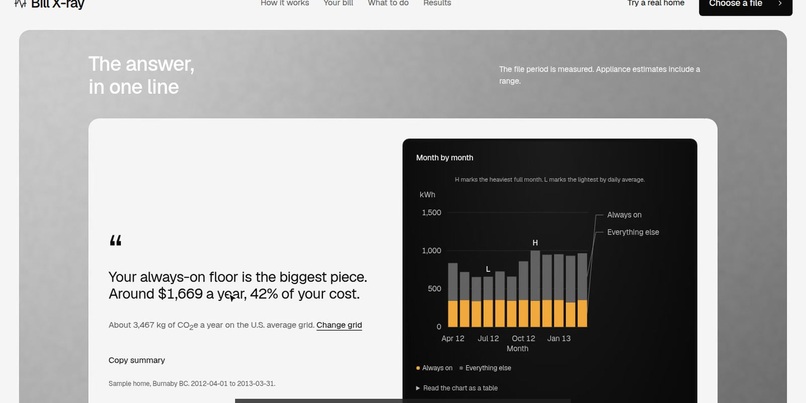
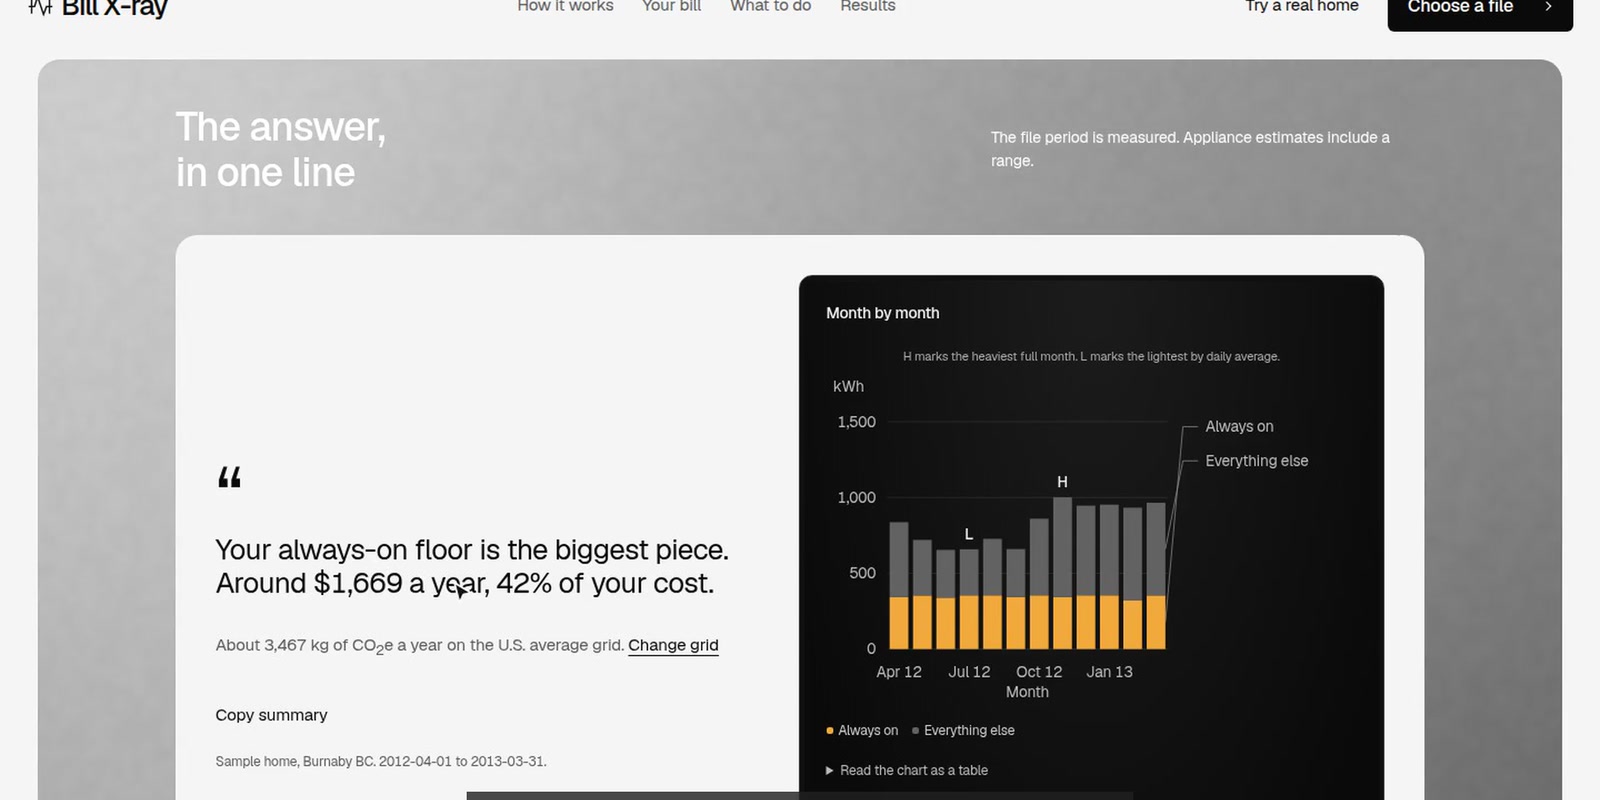
The answer in one line, in dollars and in carbon.
-
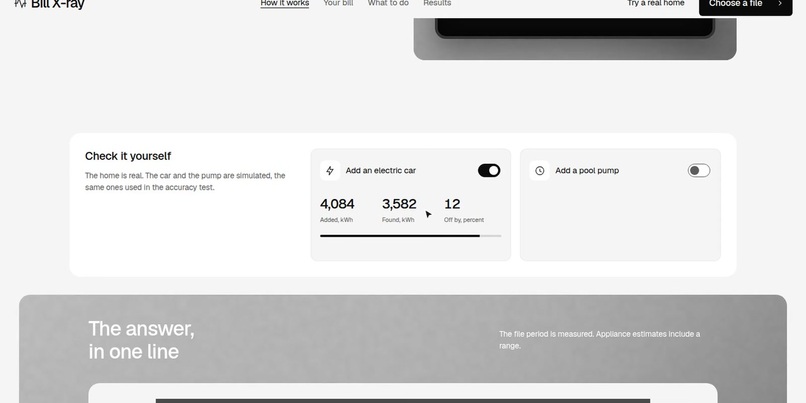
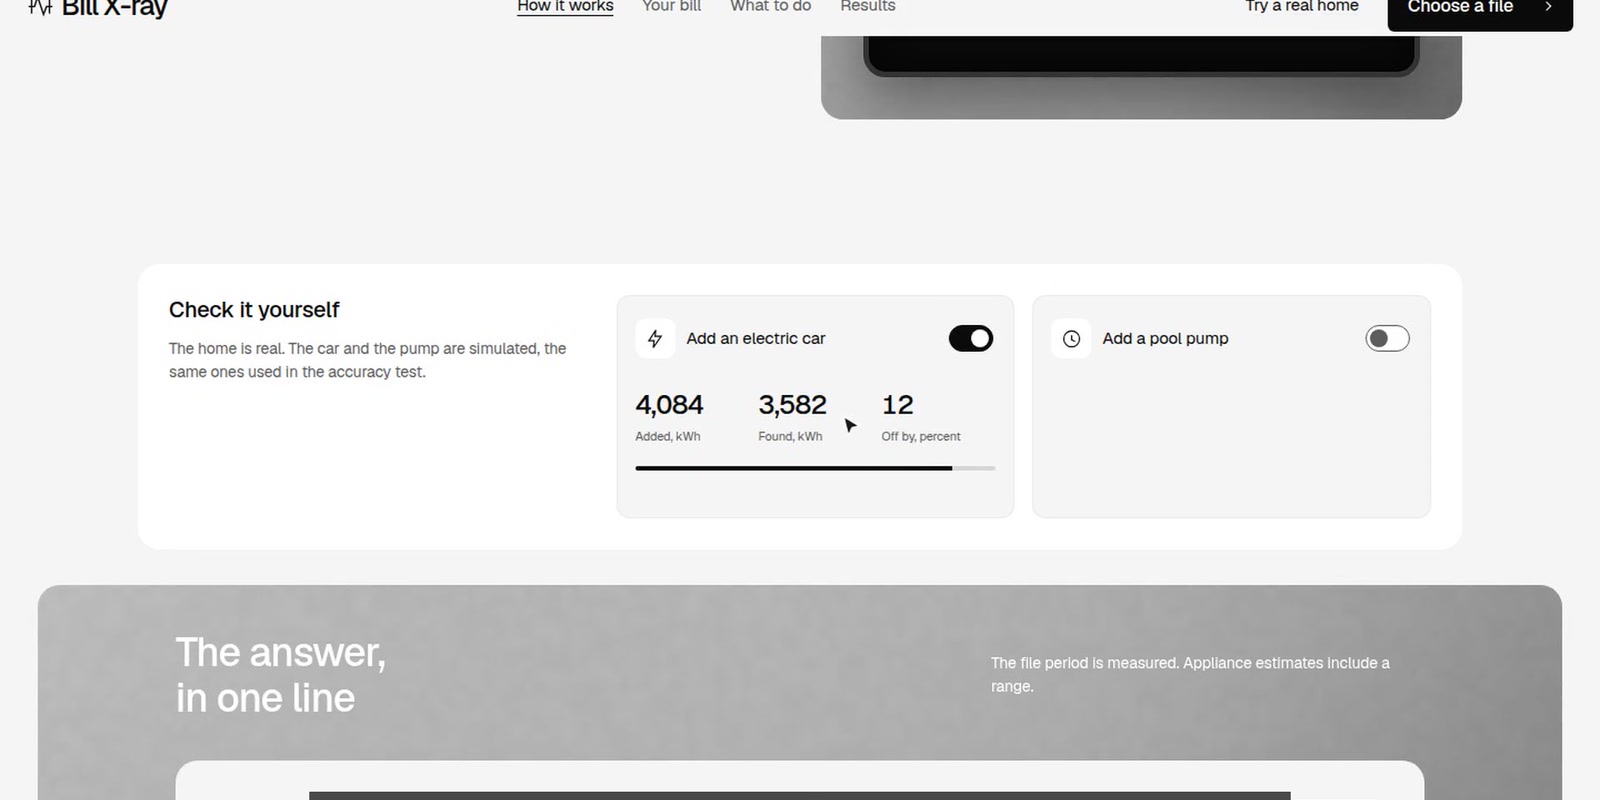
Check it yourself. Add a known electric car and see what the tool finds.
-
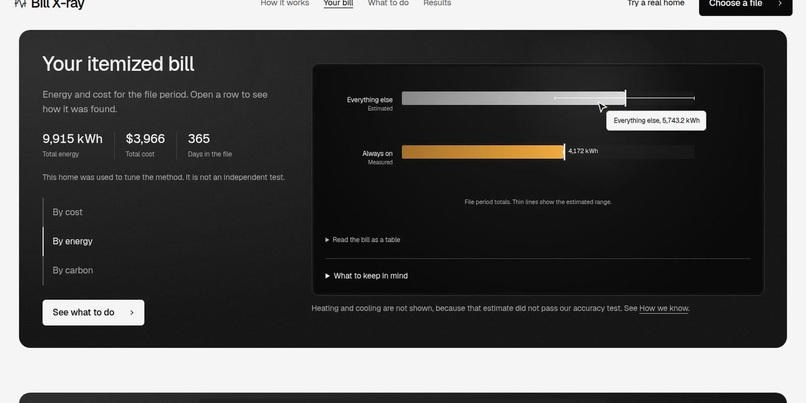
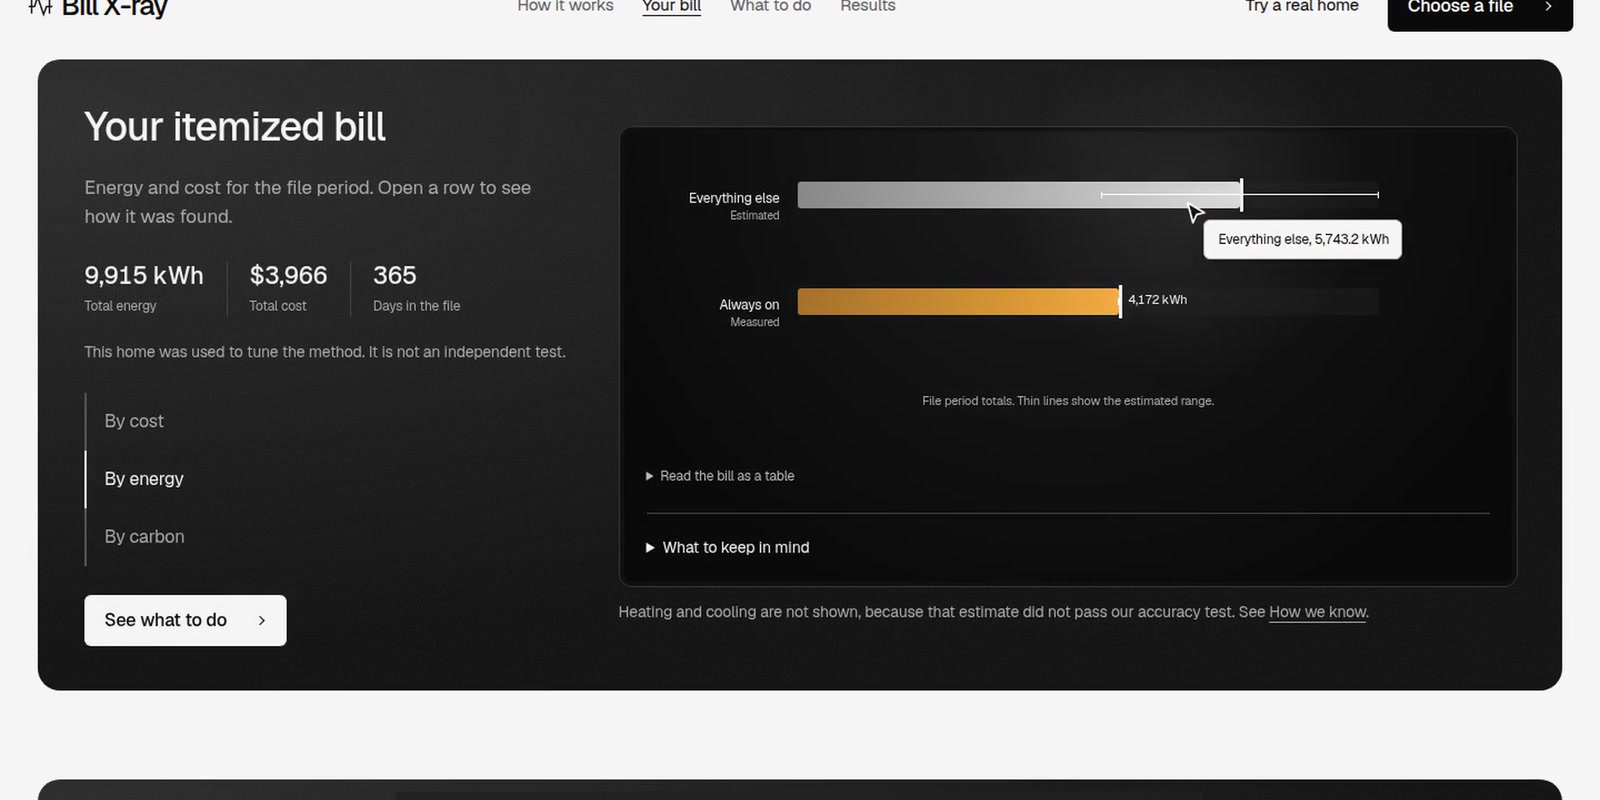
The itemized bill, with a range on every estimate.
-
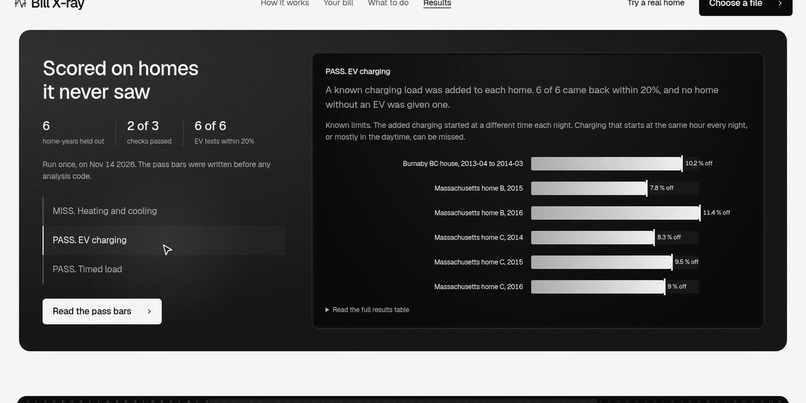
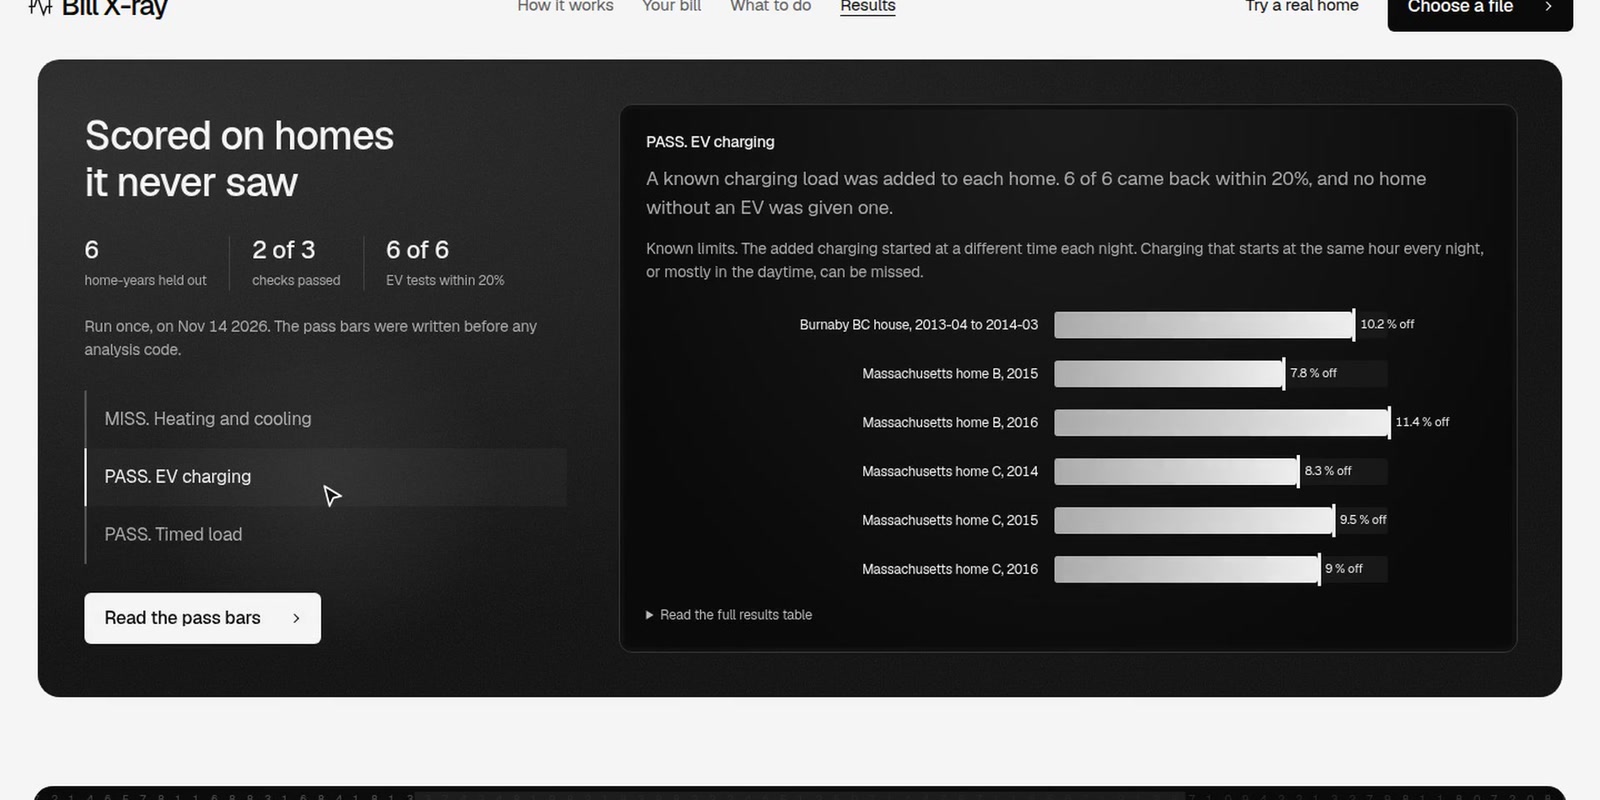
Scored on six held-back home-years, with the miss shown next to the passes.
Track. Sustainability
Inspiration
Many power companies let you download a file with your electricity use for every hour of the year, and the bill itself only gives one total. I wanted to know what that total is actually made of, and I wanted the answer to be something I could check.
What it does
You drop the usage file onto the page and Bill X-ray takes the bill apart.
- It finds your always-on floor, which is the power your home never drops below, and tells you what that costs over a year.
- It finds EV charging and timed loads like a pool pump.
- It shows when your power goes, hour by hour across the week and month by month.
- It tells you what to do about it, and every suggestion comes with the dollars or kilowatt hours it is worth, worked out from your own file.
- It shows the carbon next to the dollars, in kilograms of CO2e a year, using the EPA's grid figure for your state.
- It lets you check it yourself. On the built-in home you can switch on a simulated electric car, and the page shows what was added next to what it found.
The file never leaves your device, so there is no account and nothing is uploaded. If you do not have a file yet, you can try it on a real home that is built in.
What is new here
Most estimates of where your power goes come as a number you have to trust. Bill X-ray is built so you can test it.
- You can run the accuracy test yourself. On the built-in home, switch on a simulated electric car. The page adds a known amount of charging to a real home's year, runs again, and shows what it added next to what it found. The answer key is on the page.
- The rules were set before the work. I wrote down the bars each estimate had to pass and committed that file before any analysis code existed. The commit history shows the order.
- It hides what did not pass. The heating and cooling estimate missed its bar on homes it had never seen, so the site does not show that number, and the results panel shows the miss.
- Your file stays on your device. The whole analysis runs in the browser, so a family can use it on its own bill without sending anyone a record of when they are home.
How I built it
The whole thing is plain HTML, CSS and JavaScript with no framework and no build step, so the same analysis code runs in the browser and in the tests.
Before any analysis code existed I wrote down the bars it had to pass, and I committed that file first so I could not move the goalposts later. Then I scored the tool against three real homes that have separate meters on their appliances and circuits, which is 8 years of data. I tuned on two of those years and held the other six back, and I ran the held-back years exactly once.
I also ran the file reader on six real export files from SDG&E, PG&E and Con Edison. The first run rejected two of them and misread three, so I fixed it until every file's total matched a sum done by hand.
The design follows the structure and motion of a site I admire, rebuilt in my own code with my own colours and story. The small 3D objects that appear when you hover a headline are my own too, and they are built and rendered from a Blender script, so there is no stock art anywhere on the site.
AI helped implement and write the code to increase productivity.
Challenges I ran into
The hardest part was the heating and cooling estimate. On the two tuning years I got it down to an error of 3.8 points of the yearly total, which looked great. Then I ran the six held-back years and it came out at 11.4, when my own bar was 6. It had learned the two homes I tuned on and not the general pattern.
I had already written down what would happen in that case, so I did it. The site does not show a heating and cooling number, and the results panel shows that miss right next to the two checks that passed.
Accomplishments that I'm proud of
- EV charging passed on all six held-back years, between 7.8 and 11.4 percent off, and it never invented an EV in a home that did not have one.
- The timed load check passed on five of six.
- The results on the site are the real ones, including the one that missed, and anyone can open the file they come from.
- Anyone can repeat the test in ten seconds. Switch on the simulated car on the built-in home and the page adds 4,084 kWh of charging and finds 3,582 kWh, which is 12 percent off.
- It reads real exports from SDG&E, PG&E and Con Edison, and every total matches the file to three decimals.
- The page works with no account and no upload, which matters because a usage file says a lot about when a family is home.
What I learned
I learned that a number that looks right on the data you tuned on tells you very little, and that the only way I trust a result now is if the test was set before the work and run once. I also learned that hiding the part that failed made the rest of the tool more believable, not less.
What's next for Bill X-ray
- Score it on homes in hot, dry climates, since all three test homes are in cold ones.
- Bring back heating and cooling only when it passes the same bar on homes it has not seen.
- Catch EV charging that starts at the same hour every night, which the current check can miss.
- Use the grid's carbon figure for each hour and not a yearly average, so it can say when the cleanest hours are.
- Read more power companies' file formats.
