-
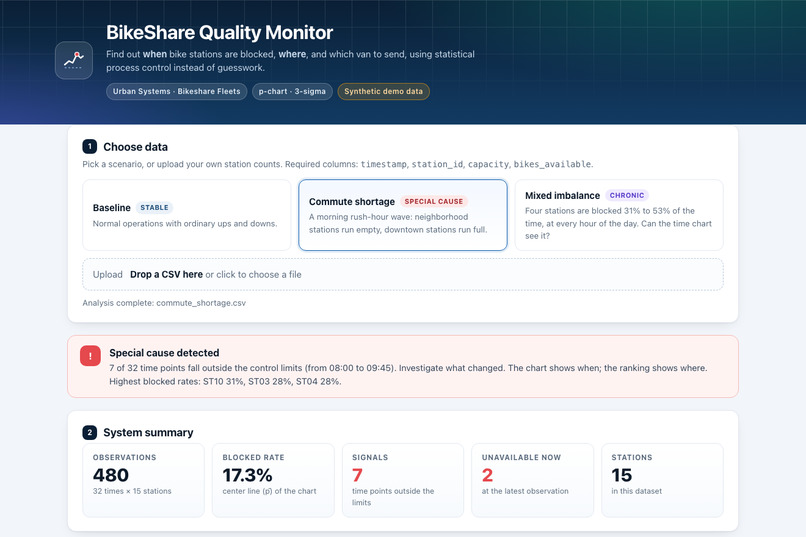
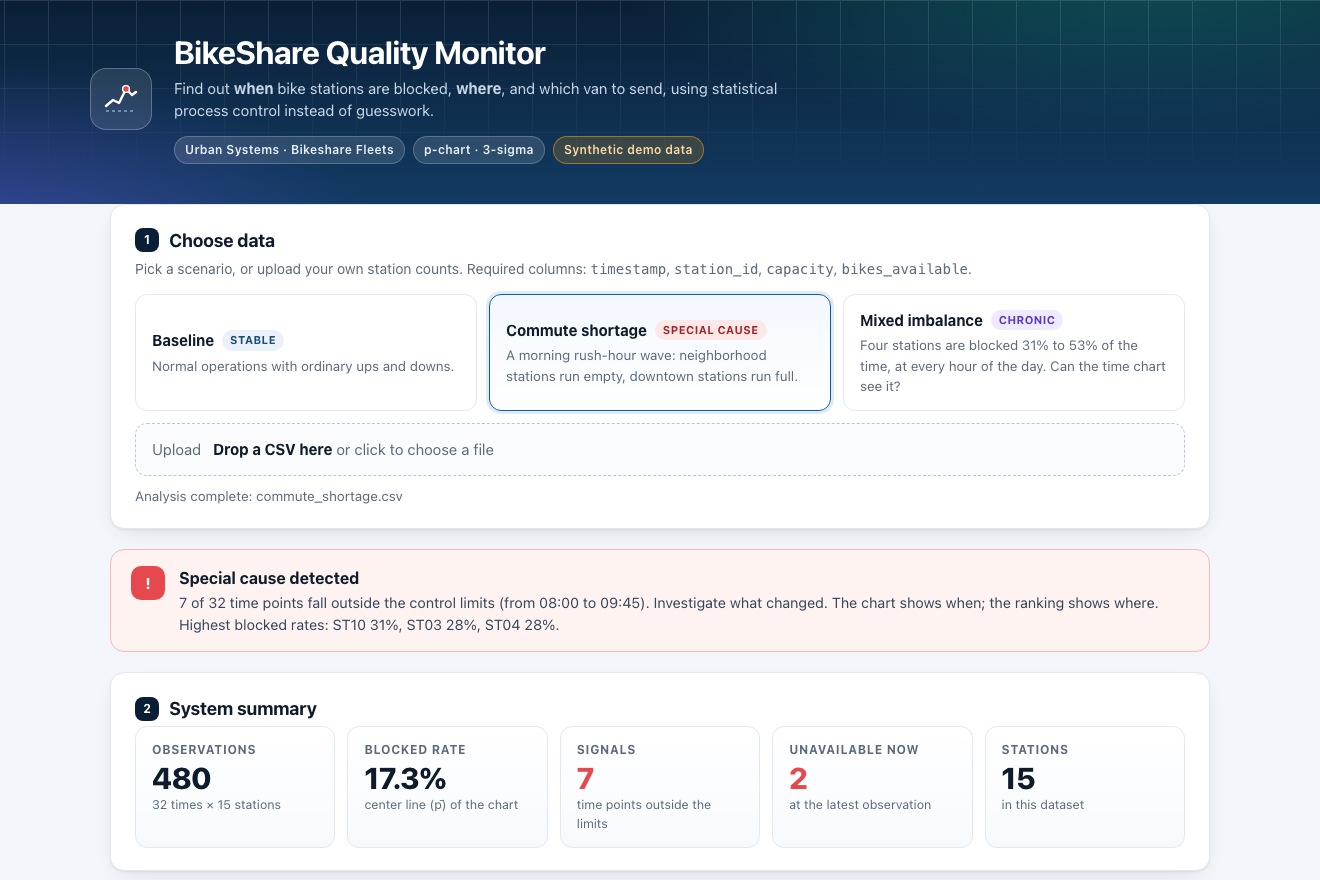
Pick a scenario or drop a CSV: the verdict banner and five key numbers appear at once (synthetic data)
-
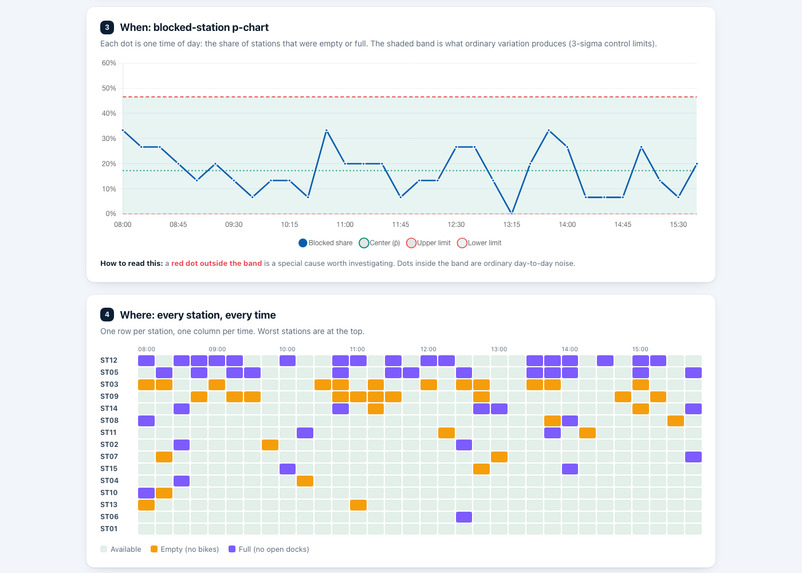
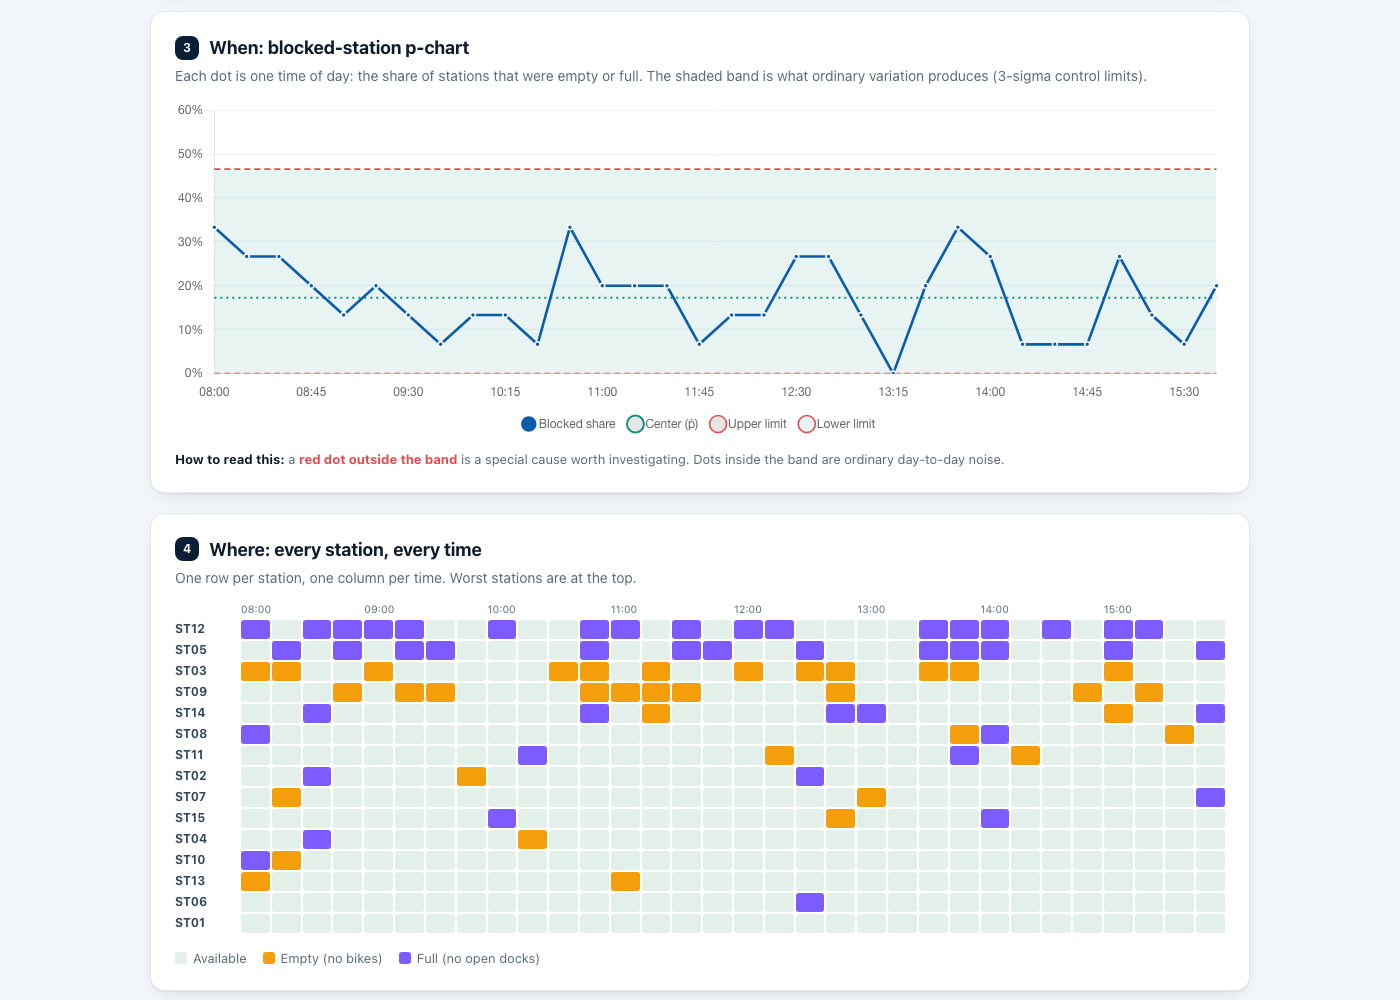
Chronic imbalance: the p-chart stays in control (17.3% blocked), yet the heatmap shows four stations blocked again and again
-
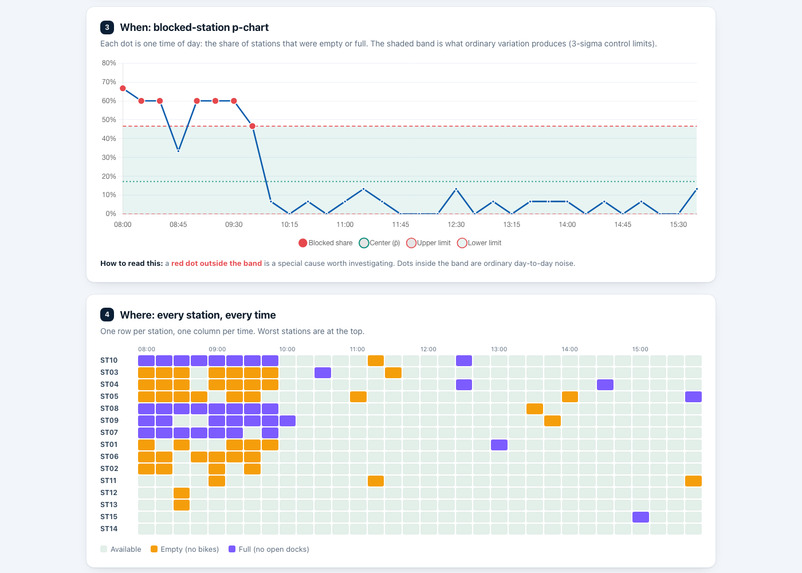
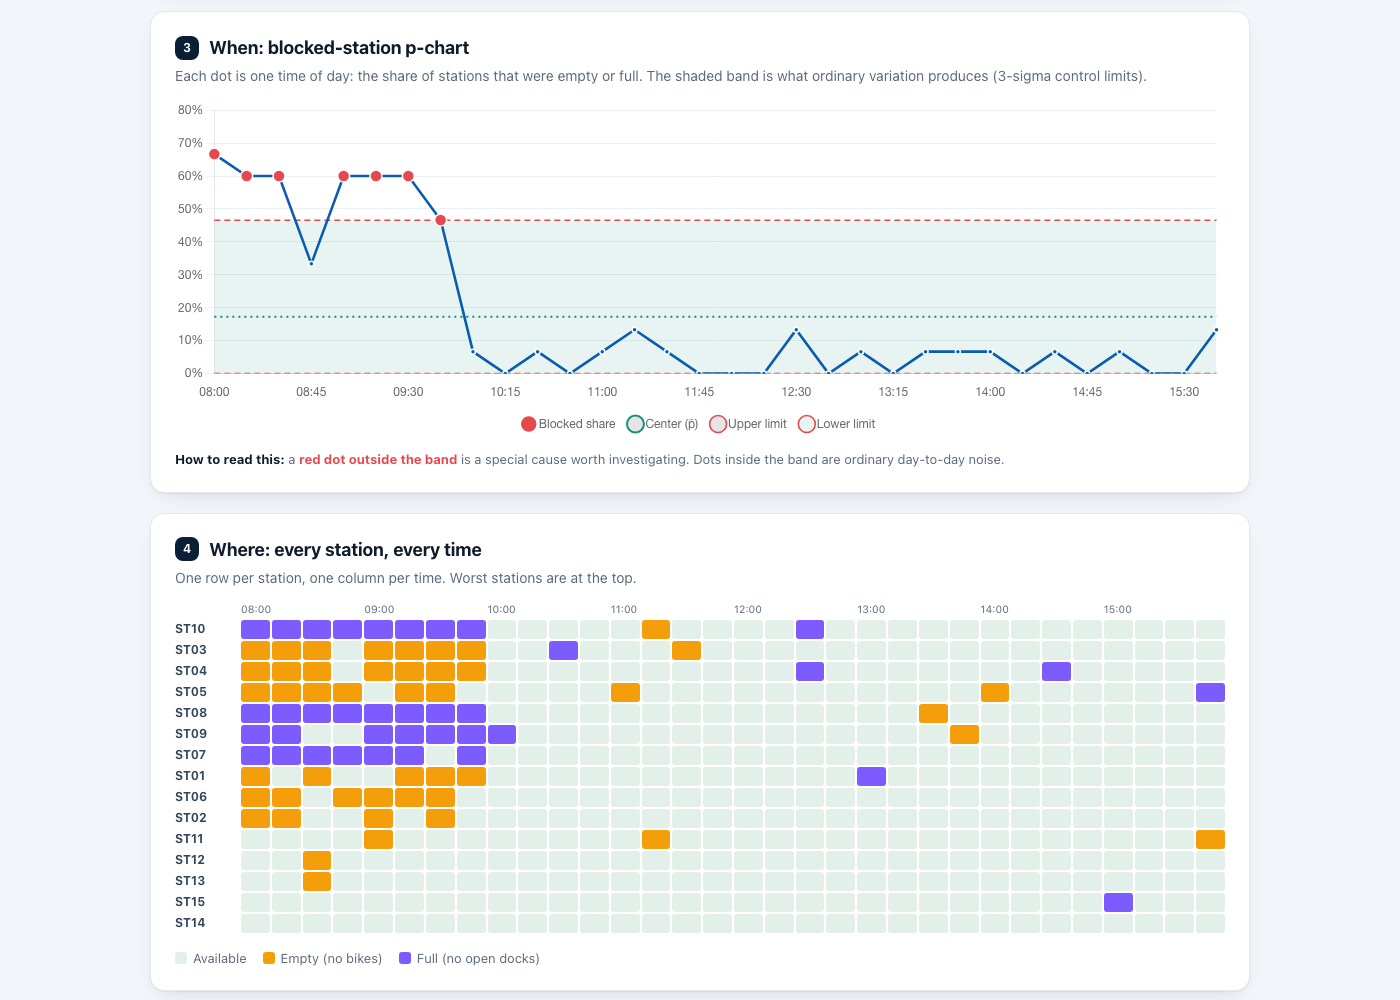
Commute wave: 7 of 32 time points leave the 3-sigma band (8:00 to 9:45), and the heatmap shows which stations were blocked
-
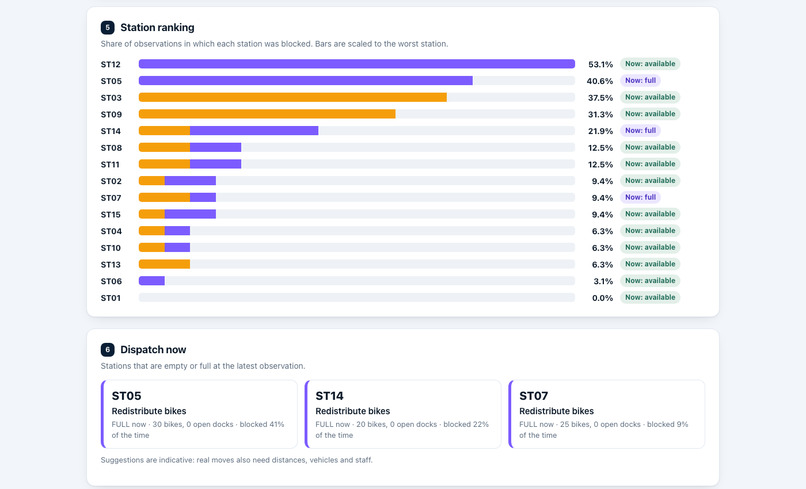
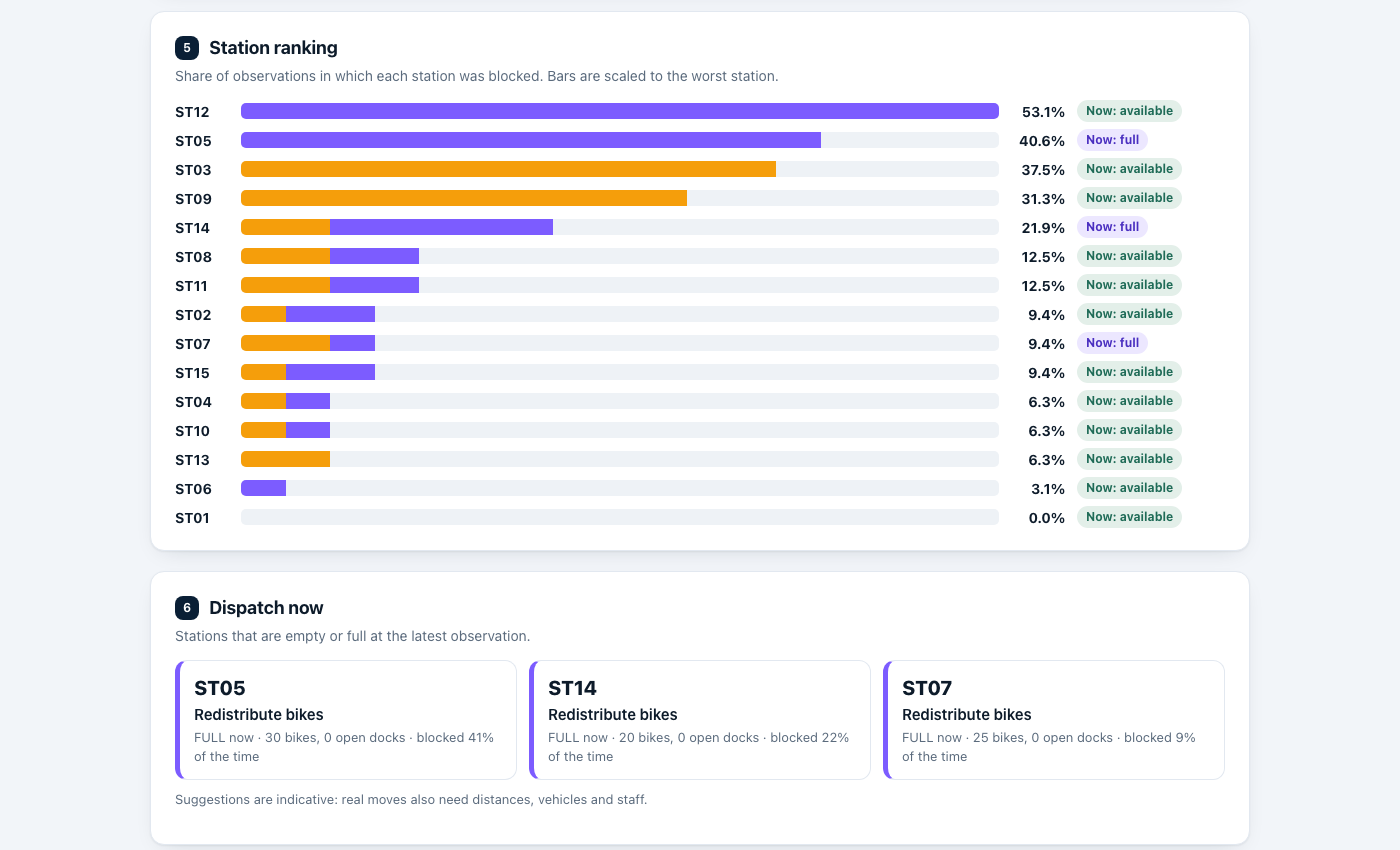
Station ranking: ST12 53%, ST05 41%, ST03 38%, ST09 31%. Dispatch cards say which van to send now
Inspiration
The Urban Systems prompt describes a "docks full / docks empty" crisis at rush hour, with maintenance vans dispatched blindly. A supervisor needs to tell ordinary variation from a real special cause, and to know which stations need a van right now.
What it does
Upload station counts as a CSV (timestamp, station_id, capacity, bikes_available). A station is blocked when it has 0 bikes or 0 open docks. The tool shows:
- a p-chart of the share of blocked stations at each time, with 3-sigma limits that depend on how many stations were observed (points outside the limits are flagged as special causes),
- a station ranking by blocked rate, with empty and full counts,
- dispatch suggestions for stations that are empty ("Deliver bikes") or full ("Redistribute bikes") at the latest observation.
Three synthetic scenarios show what it detects:
baseline: a stable system, about 4.6% blocked and no points outside the limits.commute_shortage: an 8:00 to 9:45 rush-hour wave, with 7 points above the upper limit (46.6%).mixed_imbalance: the p-chart looks in control, but four stations (ST12, ST05, ST03, ST09) are blocked 31% to 53% of the time. The time chart cannot see this; the station ranking can.
Data collection challenge: the agency has no telemetry yet, so we define what a field worker must log: one row per station per count, with the time, the station code, its dock capacity and the bikes available. The codebook explains what collecting this for real would take.
How we built it
Python and FastAPI for the statistics and API, and a browser dashboard with Chart.js. The statistic lives in one plain module (backend/analysis.py) with no web code in it. 14 automated tests run on GitHub Actions, including a hand-calculated p-chart (4 timepoints of 10 stations with 1, 1, 1 and 9 blocked give pbar = 0.30 and an upper limit of 0.734741) and degenerate cases. The three datasets are regenerated exactly by generate_data.py (fixed seeds), and the repo has a codebook, a demo walkthrough and scripts for deploying to Posit Connect.
Challenges we ran into
A p-chart assumes independent observations with the same blocking probability at every station. The same stations are observed repeatedly and commuting is predictable, so this is only approximate; the tool says so, and a signal means "investigate", not "proof". Designing synthetic data that behaves like field data (and that exercises each feature) took several iterations.
Accomplishments that we're proud of
A tested, documented, reproducible prototype that goes from a CSV to a chart, a ranking and a dispatch list, with three scenarios that each show a different behavior.
What we learned
A control chart over time can miss a chronic problem that never changes with the time of day, so the chart has to be paired with a station-level view. Checking the statistic against a hand calculation before building any interface kept the numbers trustworthy.
What's next for BikeShare Quality Monitor
Run-rule tests (for example eight points on one side of the center line), stratifying by time of day and station group, a station map, and real data from scheduled counts or a permissioned station-status feed, together with staff and van constraints for dispatch.
Built With
- chart.js
- fastapi
- github-actions
- javascript
- pytest
- python

Log in or sign up for Devpost to join the conversation.