Demo:https://connect.systems-apps.com/workflowqc/
Inspiration
Bike sharing systems are an important part of urban transportation, but stations frequently become completely full or empty during peak commuting hours. This prevents users from renting or returning bicycles and reduces the reliability of the entire network.
For the Six Sigma Hackathon, I wanted to create a practical engineering tool that uses statistical analysis to identify service disruptions and help maintenance teams make better decisions.
What it does
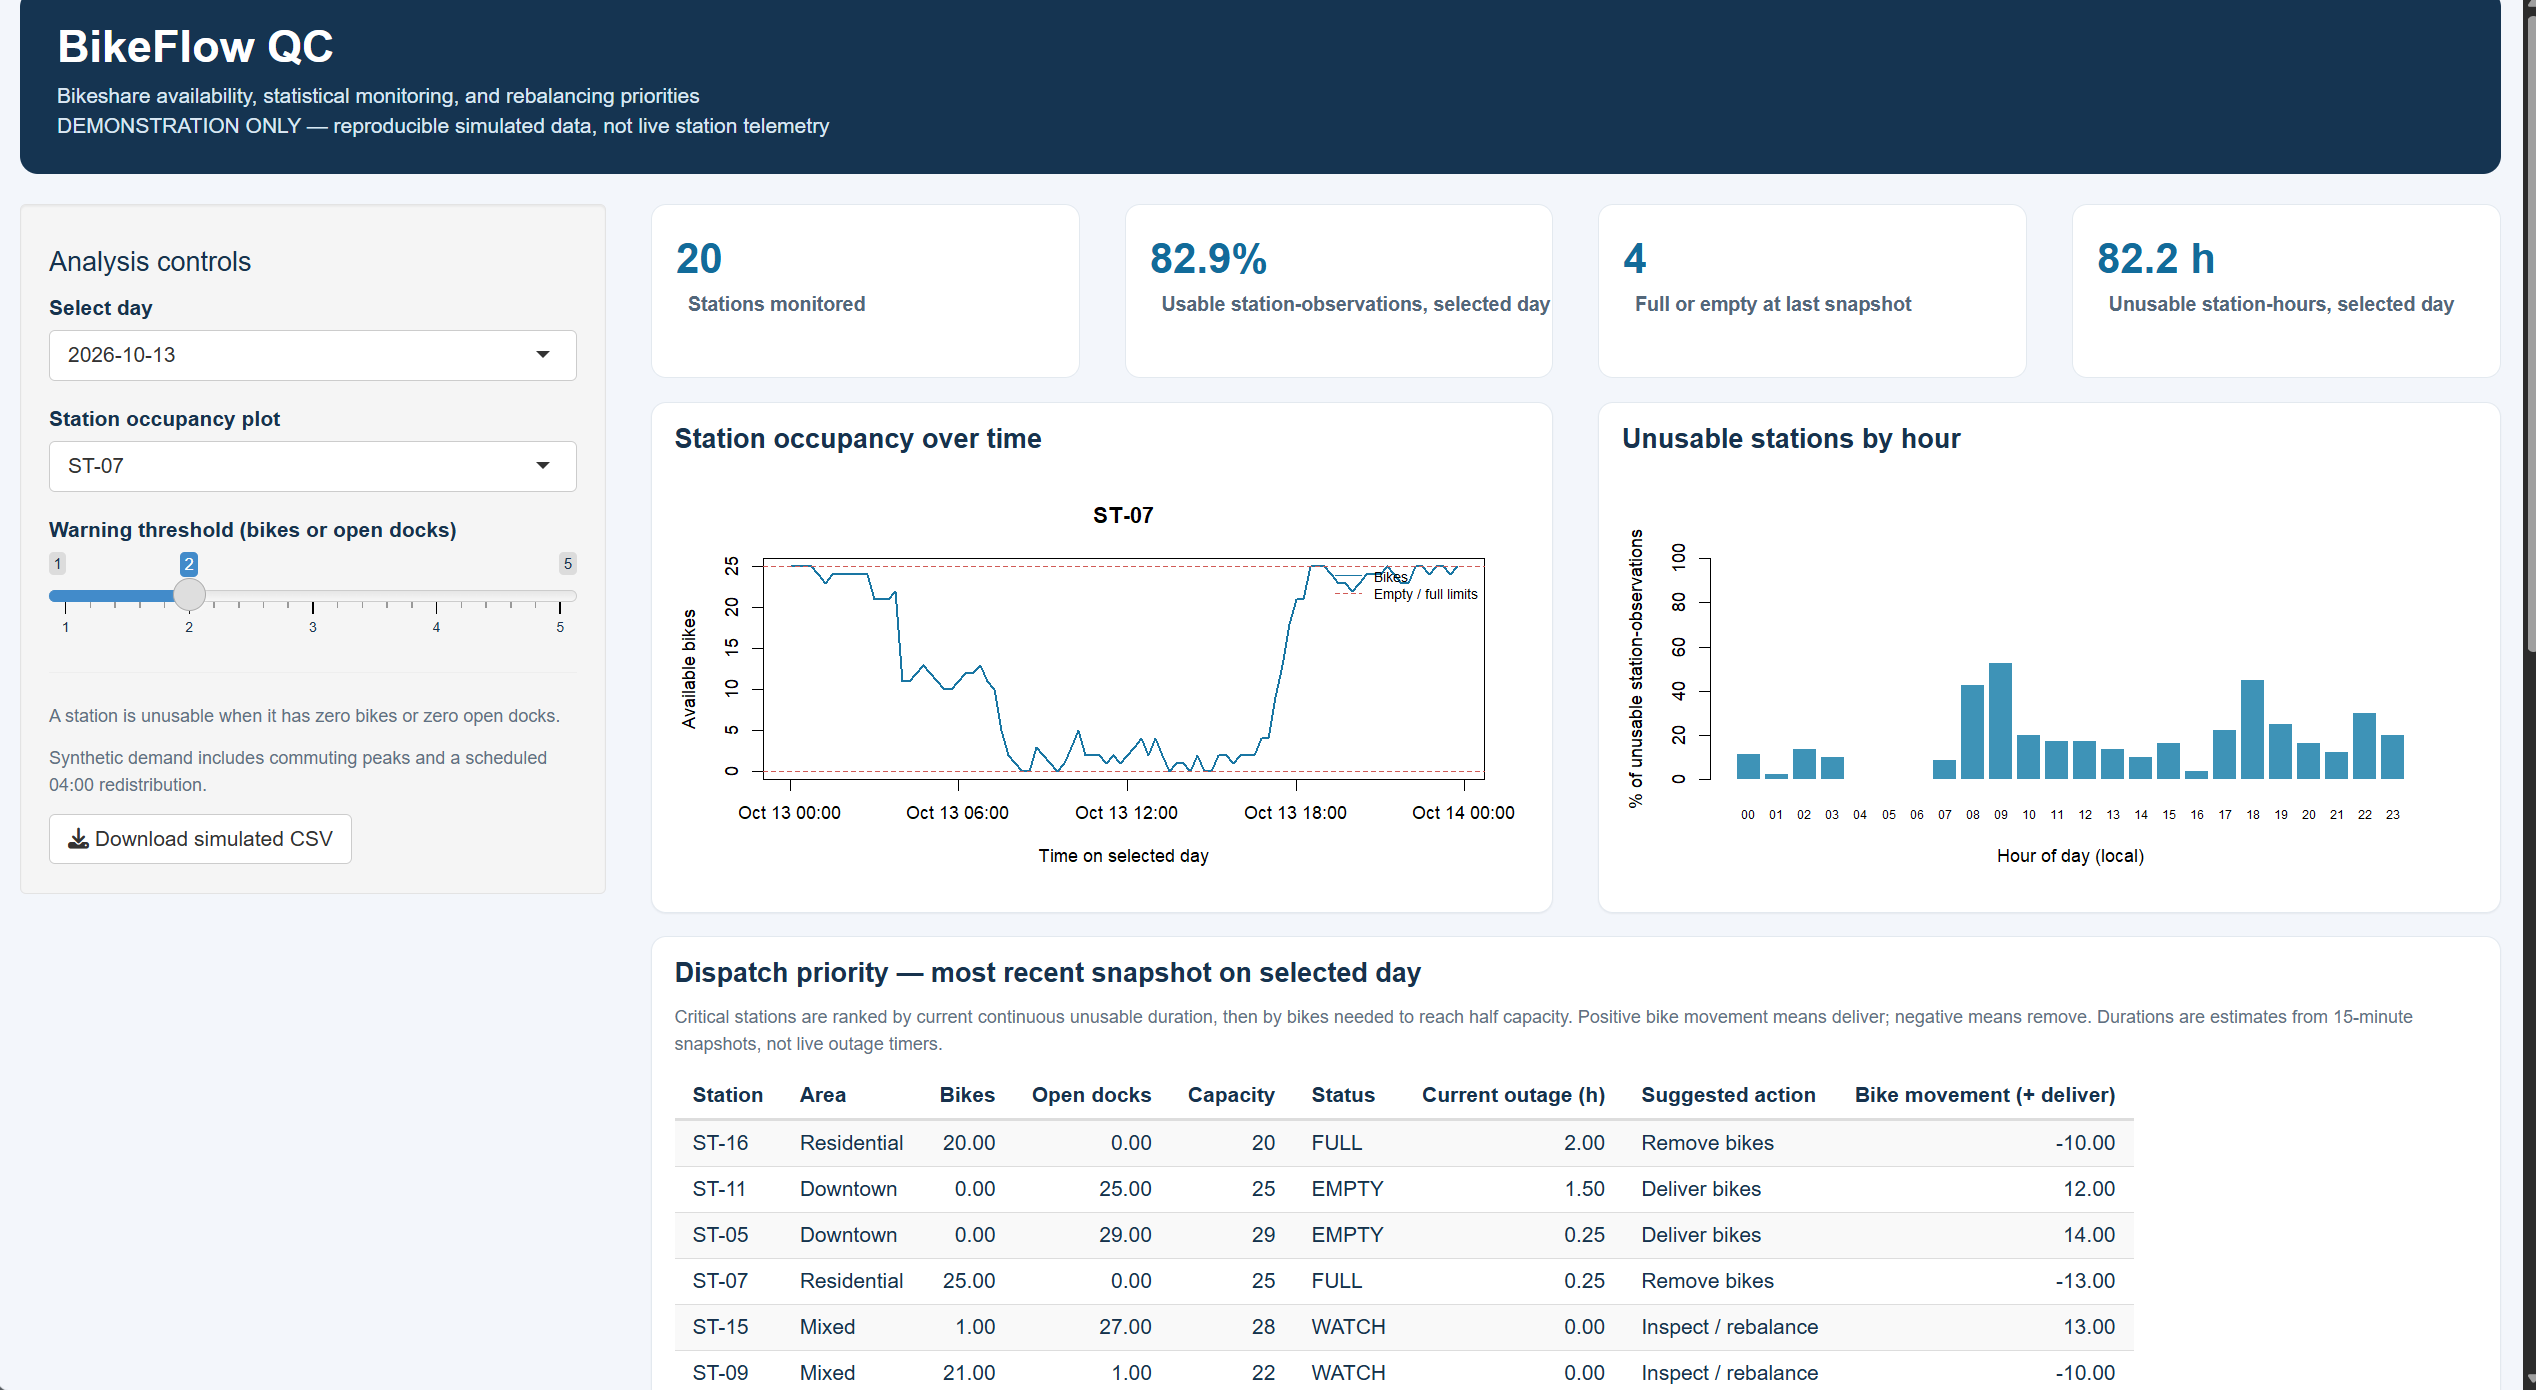
BikeFlow QC is an interactive quality-control dashboard designed to monitor the performance of a municipal bike-sharing network.
The application:
- Monitors 20 simulated bike-sharing stations over seven days.
- Tracks available bicycles, empty docks, and station capacity.
- Identifies stations that are completely full or empty.
- Calculates network and neighborhood service availability.
- Visualizes station occupancy and rush-hour disruption patterns.
- Estimates how long stations have remained unusable.
- Generates rule-based dispatch priorities and rebalancing recommendations.
- Includes an exploratory p-chart to examine network-level service variation.
- Allows users to download the simulated dataset as a CSV file.
How I built it
I developed BikeFlow QC using R, Shiny, Positron, Git, and GitHub, with AI assistance for coding and troubleshooting.
I created a reproducible synthetic dataset containing 20 stations, with observations recorded every 15 minutes over seven days. The simulation incorporates commuting patterns and station rebalancing events.
I then implemented availability calculations, service-disruption tracking, statistical visualizations, and a dispatch-priority system within an interactive Shiny dashboard.
Challenges I faced
One of my biggest challenges was completing the project independently after I wasnt able to find a team.
I also had to learn how to work with GitHub, configure an R Shiny application, troubleshoot package dependencies, and understand the statistical assumptions behind the analysis.
An important challenge was distinguishing normal rush-hour demand patterns from potential statistical process-control signals. Because station observations are correlated, the dashboard explicitly labels its p-chart limits as exploratory rather than definitive evidence of statistical control.
Accomplishments and what I learned
I am proud of developing a functioning application that connects statistical analysis with practical engineering decisions.
This project helped me better understand process monitoring, operational availability, data visualization, and how Six Sigma concepts can support real-world service improvements.
What's next
Future improvements could include integrating real bike-sharing station data, forecasting station availability, and optimizing maintenance vehicle routes.
The current version is a reproducible demonstration using simulated data rather than live operational measurements.

Log in or sign up for Devpost to join the conversation.