-
-
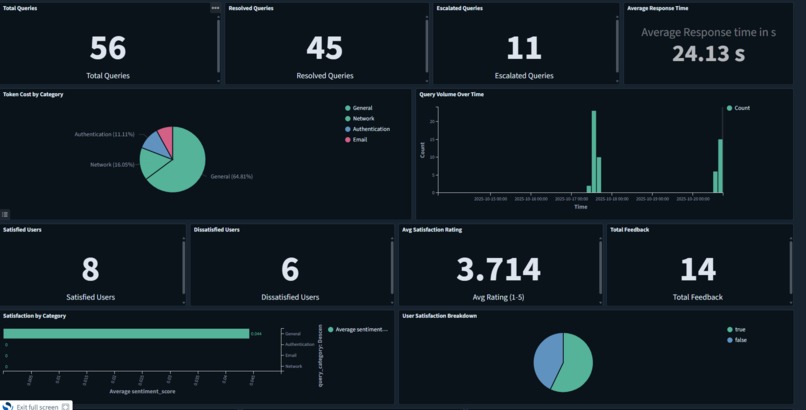
Sample opensearch Dashboard
-
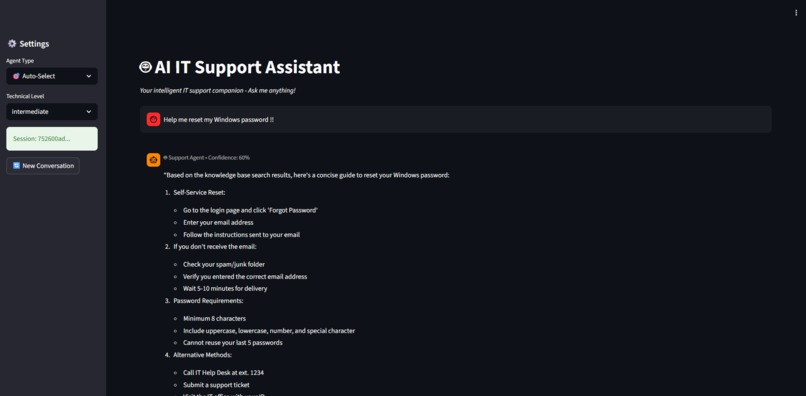
Application User interface
-
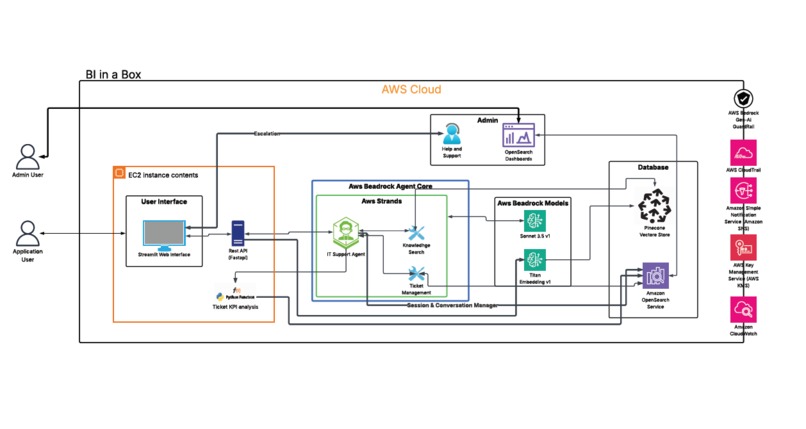
System Architecture Diagram


BI in a Box for IT Support Executive Summary BI in a Box is an AI-powered analytics platform that transforms IT support from a reactive cost center into a data-driven operation. We analyze every support interaction - tickets, conversations, agent actions - to give leadership real visibility into what's actually happening in their support organization.
The difference from traditional BI tools is simple: we don't just count tickets. We use AWS Bedrock and OpenSearch to understand why issues happen, where knowledge gaps exist, and what support actually costs. This lets IT leaders optimize spending, reduce employee downtime, and make informed decisions about automation and staffing.
The Problem and Business Value The Problem:
IT support is a black box for business leaders. Most organizations only track basic metrics like ticket count and resolution time. These numbers don't answer the questions that actually matter:
What does a single support interaction really cost us?
How much money are we wasting on the same recurring issues?
How much productivity are we losing to IT problems?
Are our agents struggling because issues are complex, or because they can't find the right information?
Which systems are causing the most pain for employees?
Our Solution:
BI in a Box provides the answers by shifting focus from ticket management to operational intelligence.
For IT Leadership: We deliver hard numbers on support costs and ROI. You can justify budgets, optimize headcount, and prove how IT improvements drive business productivity.
For IT Managers: Real-time dashboards show agent workload, performance trends, and emerging issues. You can manage proactively, identify coaching opportunities, and fix systemic problems before they escalate.
For the Business: Our platform powers faster automated support and ensures agents have the right information, minimizing employee downtime and frustration.
Product Capabilities Core Platform Features:
AI-Powered Ticket Intelligence: Uses AWS Bedrock (Claude 3.5) for intent recognition, sentiment analysis, and smart routing to the right agent or queue.
Agent Assist: Gives agents a Streamlit interface that automatically surfaces relevant knowledge base articles from Pinecone vector search, cutting search time and improving accuracy.
Session-Based Analytics: This is our key differentiator. We capture the complete user journey - initial query, AI interaction, knowledge base searches, escalation - as a single session. This context is what individual ticket data misses.
The Analytics Layer (OpenSearch and Kibana):
Performance Dashboard: Real-time agent workload, query volume, response times, and first-contact resolution rates.
Cost and Token Dashboard: Granular tracking of token consumption and costs for every AI interaction, filterable by category, agent, or time period.
Trend and Sentiment Analysis: Identifies recurring issues, maps user sentiment across problem categories, and visualizes knowledge gaps.
Session Flow Visualization: Shows user journeys, pinpointing where users drop off, where escalations happen, and which knowledge articles work or don't.
Solution Architecture We built a decoupled architecture for scalability, real-time performance, and maintainability.
Operational System:
PostgreSQL: Primary transactional database storing tickets, user data, and system configuration. Ensures data integrity for the core application.
AgentCore: Our custom Python orchestration service that manages support interaction flow. Coordinates between the user interface, Bedrock AI models, and Pinecone vector search.
Streamlit: Internal interface for support agents, providing rapid Agent Assist tools.
FastAPI: Secure REST APIs for analytics dashboards to consume data.
Analytics System:
Data Pipeline: ETL process that extracts data from PostgreSQL and interaction logs into our analytics engine.
AWS OpenSearch: The core of our insights platform. We migrated from purely relational because OpenSearch is built for high-speed aggregation of large, unstructured text and event data like our session flows. This separation ensures analytics queries don't impact live support performance.
Kibana: Visualization layer for OpenSearch, powering our interactive dashboards.
Key Challenges and Learnings Technical Challenges:
Service Stability: AgentCore experienced initial instability. We implemented comprehensive health monitoring and resilient retry logic to solve this.
RAG Performance: Achieving sub-2-second response times for semantic search required significant tuning of Pinecone indexing and query optimization.
Data Architecture: Migrating analytics from relational (PostgreSQL) to document-based (OpenSearch) was complex. We learned to design OpenSearch index mappings carefully before migration to ensure query performance.
Business and Product Learnings:
Cost Drives Behavior: The Cost Visibility dashboard became our most impactful feature. When managers and agents see the literal cost of interactions, they actively improve knowledge base articles and optimize workflows.
Usability Over Completeness: Our initial dashboards were overwhelming. Managers prefer a few actionable insights over screens full of charts. Less is more.
Speed Over Perfection: User feedback confirms employees strongly prefer fast, good-enough automated answers over waiting for perfect human responses. This validates our AI-first approach.
Roadmap Immediate (Next 3 Months):
Goal: Move from reactive insight to proactive management.
Predictive Analytics: Forecast support volume based on historical trends and time patterns, enabling optimized staffing.
Automated Reporting: Weekly insight summaries delivered to IT leadership via PDF or email, highlighting trends, costs, and emerging issues.
ITSM Integrations: APIs to connect with ServiceNow and Jira Service Management for automated ticket creation and synchronization.
Medium-term (6 Months):
Goal: Expand platform intelligence and market reach.
Multi-Language Support: Integrate translation models to serve non-English support organizations.
Root Cause Analysis: Train ML models to recommend root causes, like identifying that 75% of VPN failures link to a specific software patch.
Mobile Dashboard: Read-only mobile view for managers to monitor operations on the go.
Long-term Vision (12-18 Months):
Goal: Evolve from IT Support tool to Digital Experience Intelligence platform.
Strategy: Provide a single pane of glass for all IT operations. Ingest data beyond support tickets - infrastructure monitoring from Datadog or New Relic, application performance logs. By correlating support sentiment with real-time system performance, we can definitively answer: How is our IT stack impacting employee productivity and business outcomes? This transforms IT from a cost center into a strategic driver for business optimization.
Opensearch Dashboard testing creds -> username: readonly_user password: AwsDemoUser@098
Built With
- agent
- agentcore
- fastapi
- opensearch
- pinecone
- python
- strands


Log in or sign up for Devpost to join the conversation.