-
-

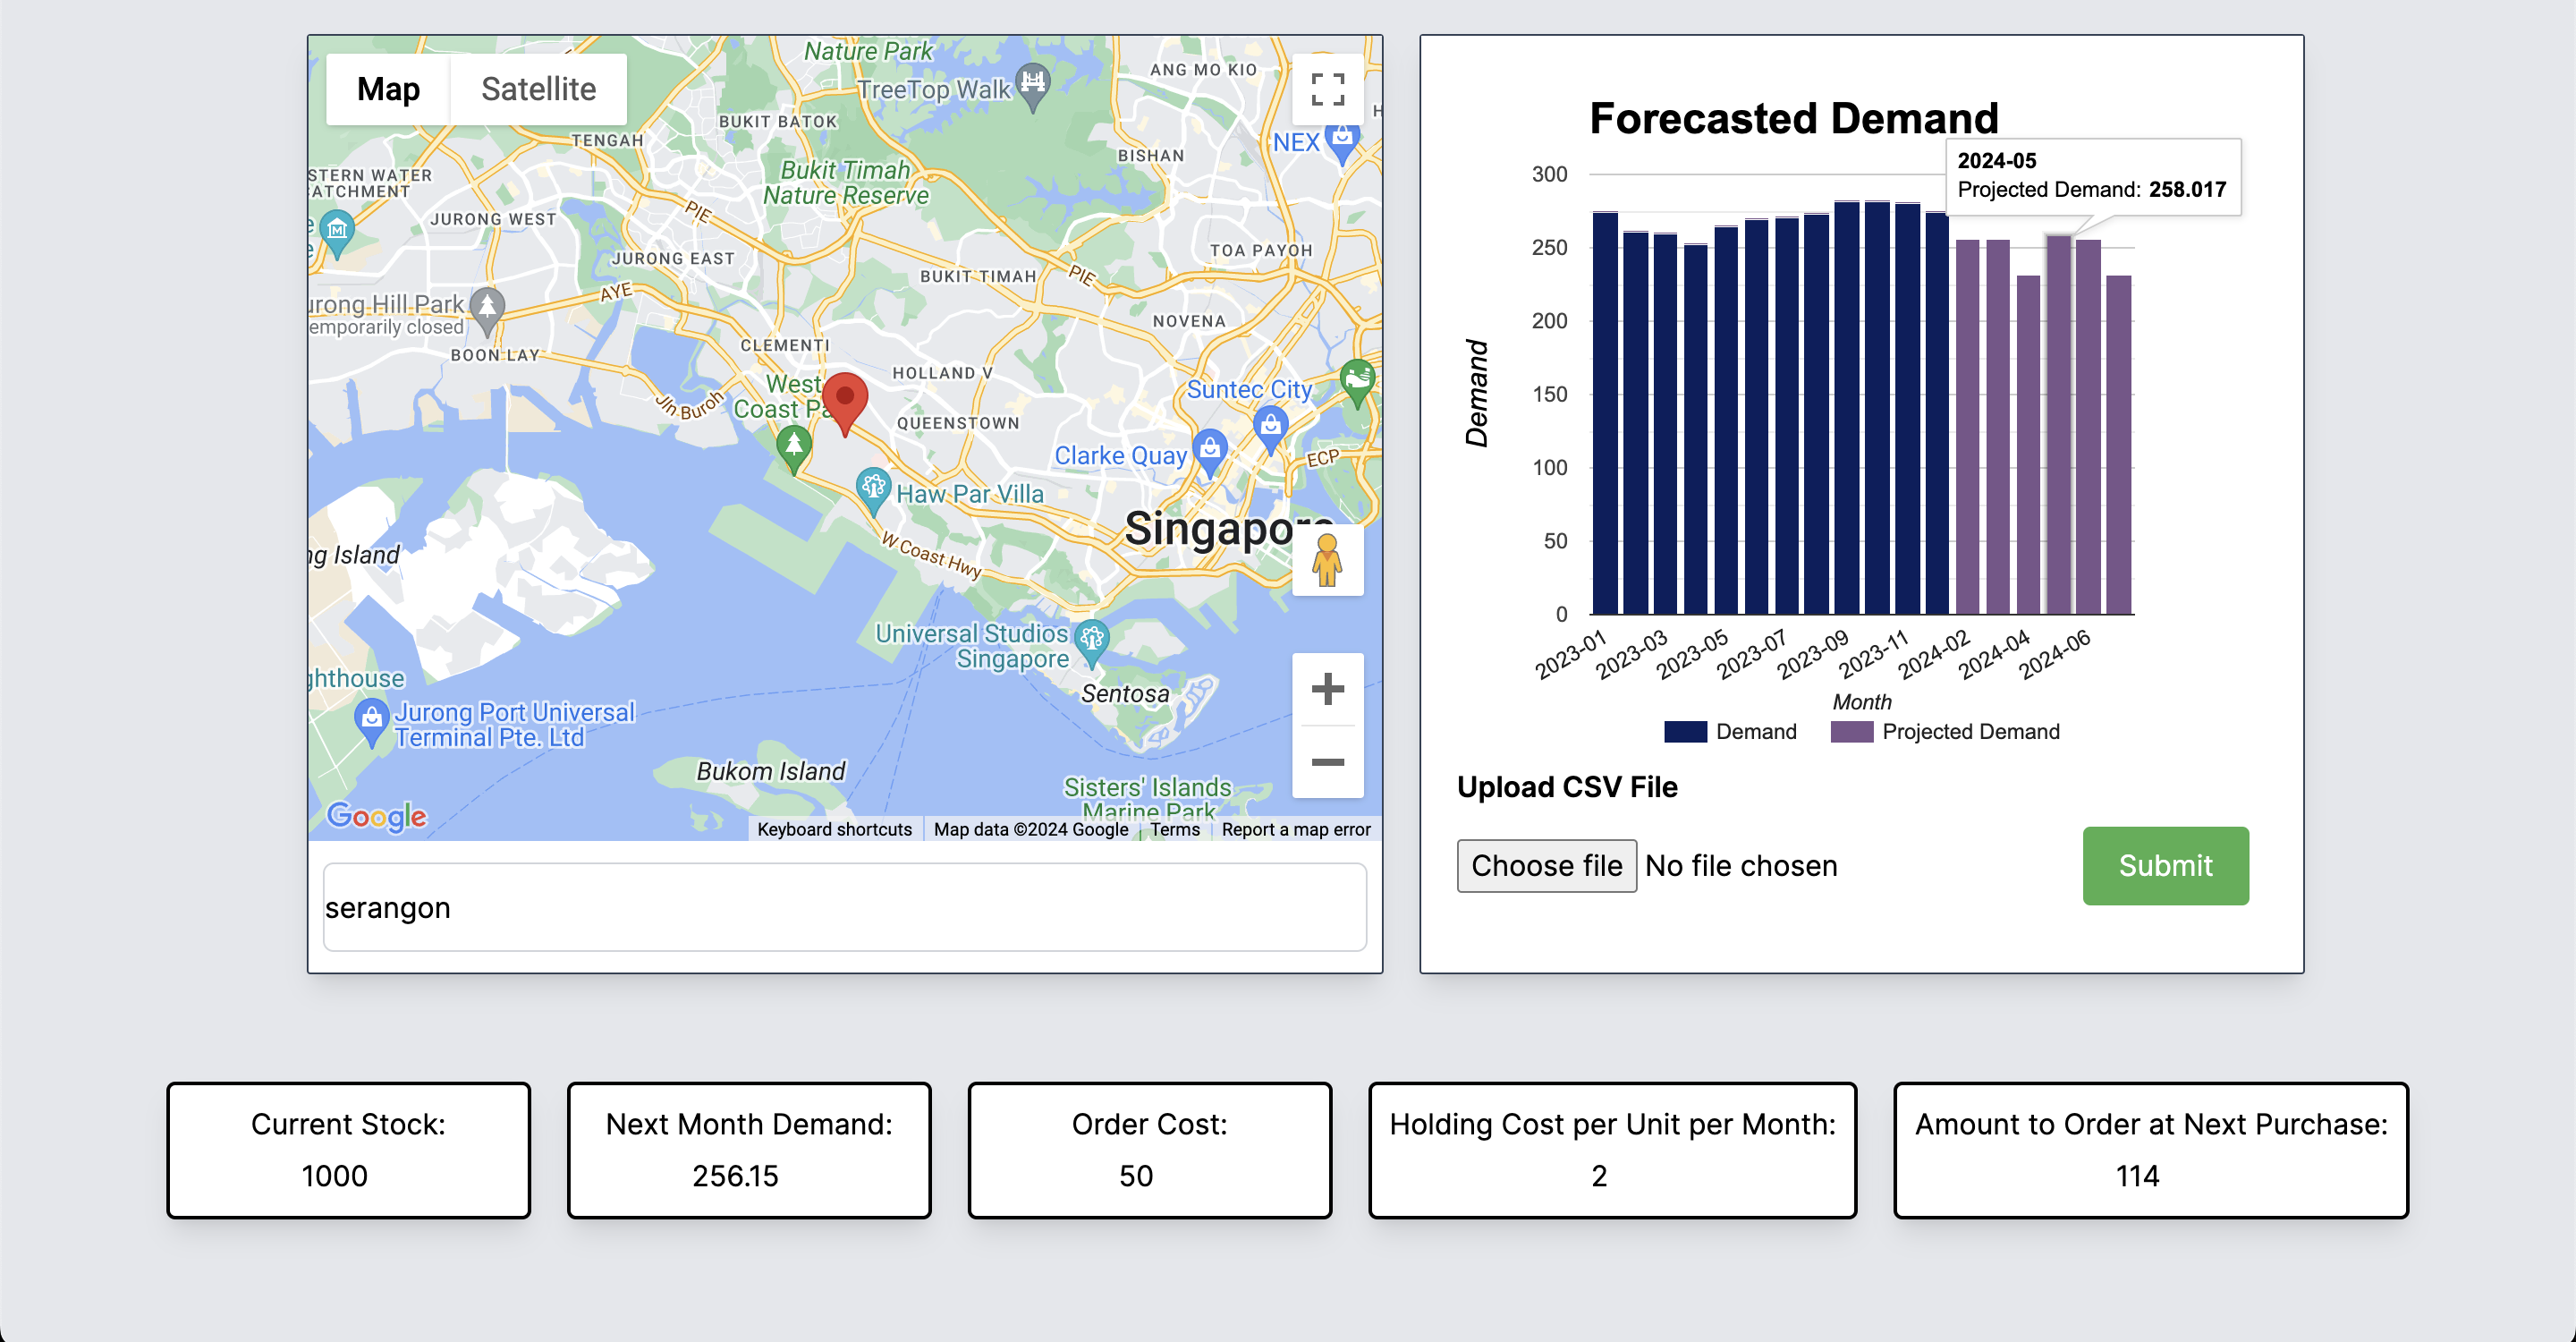
The website
-

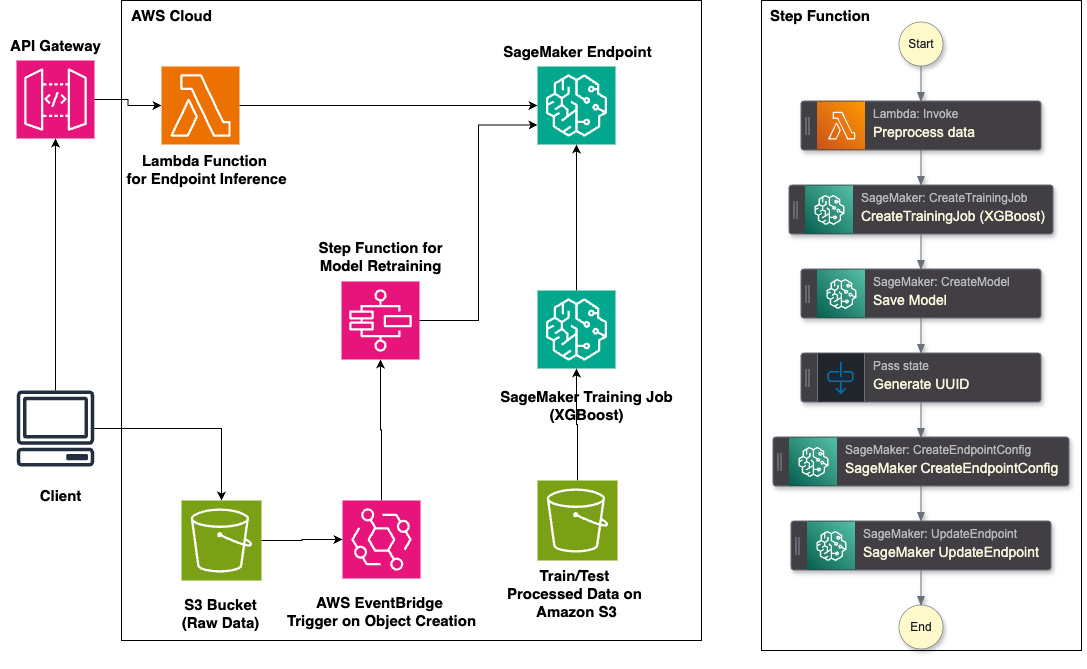
AWS Pipeline
Inspiration
In today's fast-paced market, businesses need real-time insights to stay ahead. Supply chain optimisation is essential in the world and it was something that we were unfamiliar with. Therefore, we wanted to dive headfirst into it and learn as much as possible. We were inspired to create a solution that integrates MLOps to help companies make data-driven decisions efficiently.
What it does
Our dashboard provides:
- Demand Forecasting: Predicts future demand using machine learning models that retrain with new data automatically.
- Route Planning: Plan delivery routes in advance for efficiency and cost-effectiveness.
- Inventory Management: Manages stock levels to prevent overstocking or stockouts, ensuring optimal inventory levels.
How we built it
The demand forecasting model was trained on synthetically generated data. The data was stored in an S3 bucket and trained in SageMaker with the XGBoost algorithm and deployed to an endpoint once it was trained. The endpoint was exposed using a Lambda function which is connected to an API Gateway.
Model retraining is achieved through a system whereby the client uploads a raw .csv file containing the time series and input into an S3 bucket. AWS Eventbridge detects the creation of the file in the bucket and triggers an AWS StepFunction to retrain the model. A Lambda function preprocesses the data and sends it into SageMaker for retraining. It then updates the existing SageMaker endpoint, where the API can now access the new model.
Inventory management was implemented using data from the demand forecasting model. It retrieves the next month's forecasted demand and the current stock to determine the amount to order at the next purchase using formulas.
Route planning was implemented using Google Maps API. A google maps is embedded in the website and a search bar was added using Google Maps Places Autocomplete.
Challenges we ran into
Integration of webapp with AWS. It was challenging to settle the permissions of who could access the AWS services.
Accomplishments that we're proud of
Successfully deploying a robust machine learning model hosted on AWS with MLOps elements. Creating an intuitive and user-friendly dashboard interface. Deploying a web app that provides access to all features.
What we learned
Techniques for maintaining and updating machine learning models. How to build a web app from scratch.
What's next for BHQ Bros
Feature Expansion: Incorporating route optimization into the Google Maps feature.
Things to Take Note
- Please wait around 30 seconds for the forecasting graph to appear on the website. Do not refresh during this time or the timer will reset.
- Only one person can test the add file function at a time.
- The file uploaded must have the following columns only. 'date' as 'YYYY-mm-dd' and 'units_sold' as a number. An example file can be found in the Github repo with the name milk_consumption.csv
Built With
- amazon-web-services
- google-maps
- lambda
- nextjs
- s3
- sagemaker
- stepfunctions
- vercel


Log in or sign up for Devpost to join the conversation.