Inspiration
As high school and undergraduate students, we noticed that success stories do not often highlight one's struggles and barriers students face, creating a skewed understanding of opportunity and achievement.
What it does
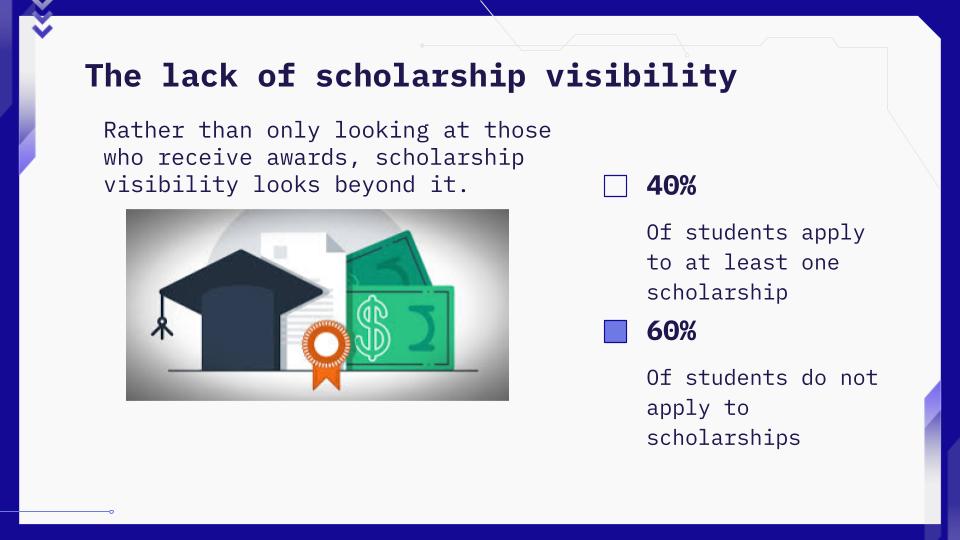
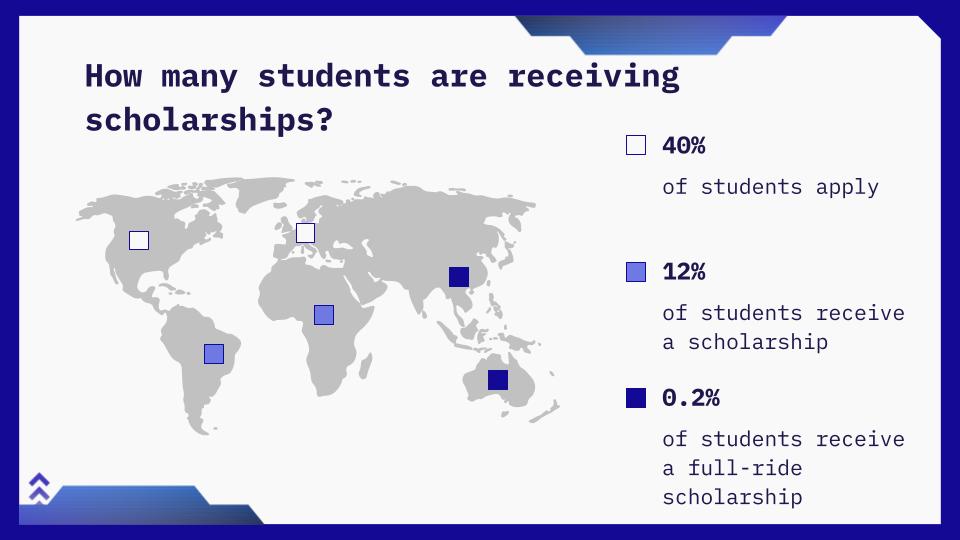
Our project anonymously collects and visualizes student experiences, offers scholarship and educational opportunities, highlights patterns of bias, and provides resources for students.
How we built it
Using HTML, we built a webpage where there are visual dashboards (funnel, pie, and stacked bar graphs), anonymous submission forms, real-time data updates taken from personal submissions, and resources and events sections. We also integrated accessible features such as color-blind safe charts, readable fonts, and not needing to login. For some of the graphs, JavaScript was used.
Challenges we ran into
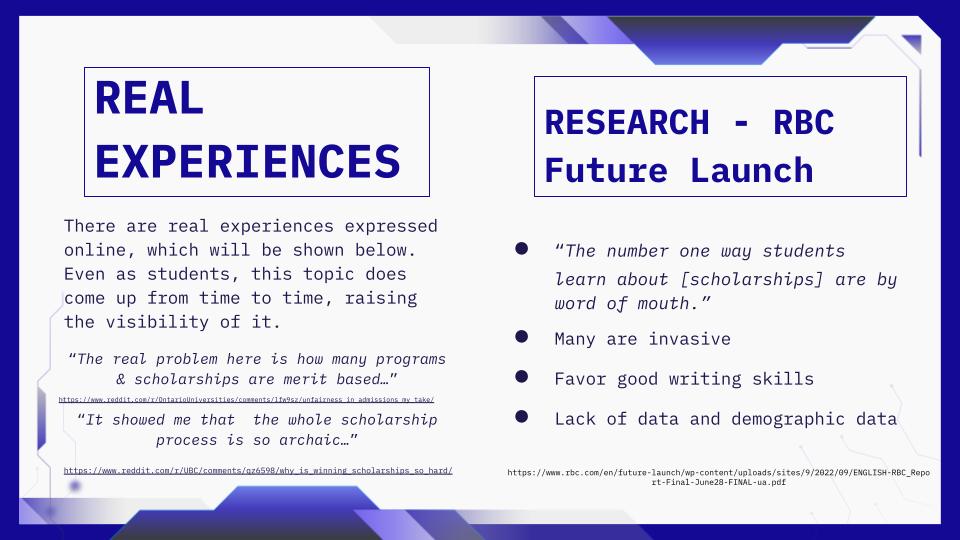
The main challenges that we ran into focused on researching the problem itself. We struggled finding data on studies about survivorship bias on scholarships. However, we found cases that lacked considering survivorship bias, proving that it is a problem.
Due to our limited skills, it was a huge learning curve learning how to input new features into our webpage. For example, the graph made from JavaScript was created with no knowledge of the language.
Accomplishments that we're proud of
Although it was difficult and time-consuming, we’re proud of turning an idea into a functional, accessible webpage that lets students anonymously share their experiences, visualize patterns in scholarships and educational opportunities. Despite having no prior JavaScript experience, we created real time, interactive dashboards including funnels, pie charts, stacked bar graphs and integrated features like colorblind safe charts and readable fonts. Beyond the technical side, we built a platform that boosts student voices, highlights gaps in opportunity and provides resources, turning our observation of hidden struggles into a practical tool that can make a difference.
What we learned
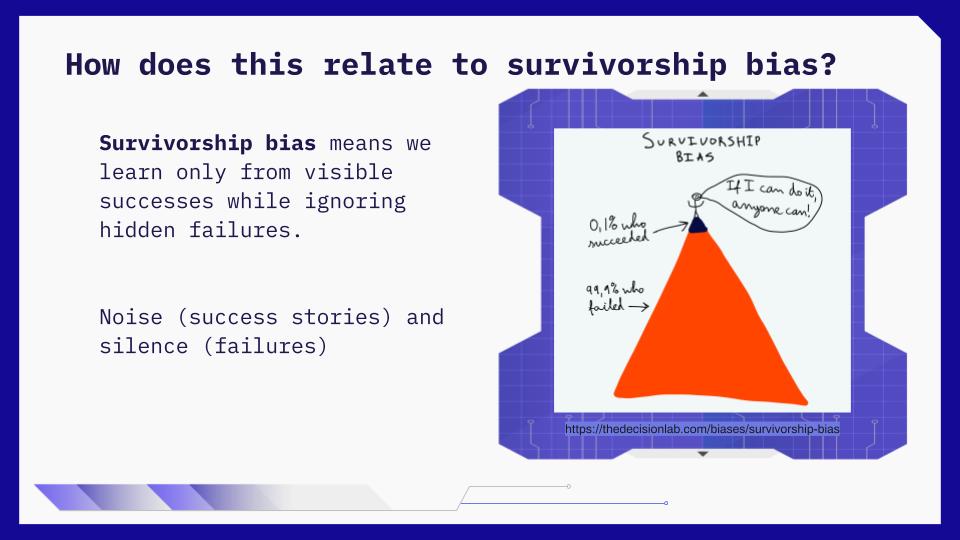
This project taught us a lot about technology, research, and bias. Technically, we learned to implement dynamic, accessible dashboards and troubleshoot new coding challenges. Research-wise, we discovered how survivorship bias skews perceptions of success, as most scholarship studies highlight winners while ignoring those who face barriers. We also learned the value of persistence, collaboration and designing, realizing that thoughtful tools can not only share data but also give students a clearer, fairer understanding of opportunities and challenges.
What's next for Beyond the Success Story
If we were to make this a fully functioning project, we would improve or implement these features: -Create a storage database to store people's submissions and connect to graphs for real-time graph updates. -Find educators or teachers to connect students to -Find or host online mentoring events (ex career fairs, scholarship mentoring lessons, resources to improve scholarship applications) -Have volunteers moderate the platform and check the data monthly, ensuring that it isn't skewed (or if there are unwanted submissions) -With the data collected, reach out to local governments or school systems to design more inclusive scholarship systems -Improve outreach and support by hiring educators to visit schools and talk about survivorship bias


Log in or sign up for Devpost to join the conversation.