Inspiration
Team USA carries a powerful nationwide story, but fans often only see isolated medal moments instead of the broader legacy behind the team. This creates a challenge for both sides: fans need a more engaging way to connect with the full Team USA story, while Team USA needs stronger visibility for athletes across all disciplines, including Paralympic athletes and athletes from diverse communities.
The gap is data discovery: over 126 years of Olympic and Paralympic data reveals powerful patterns in hometown identity, sport representation, and athletic diversity, but it is rarely presented in a way fans can actively explore.
Our Unique Challenge: Beyond the Dashboard
How can we turn large-scale sports data into an immersive exploration experience for fans beyond static dashboards? Could we build a multimodal fan experience that makes 127+ years of Team USA Olympic and Paralympic history conversational, explorable, and interactive through AI-powered storytelling, geographic exploration, and real-time data interaction?
What it does
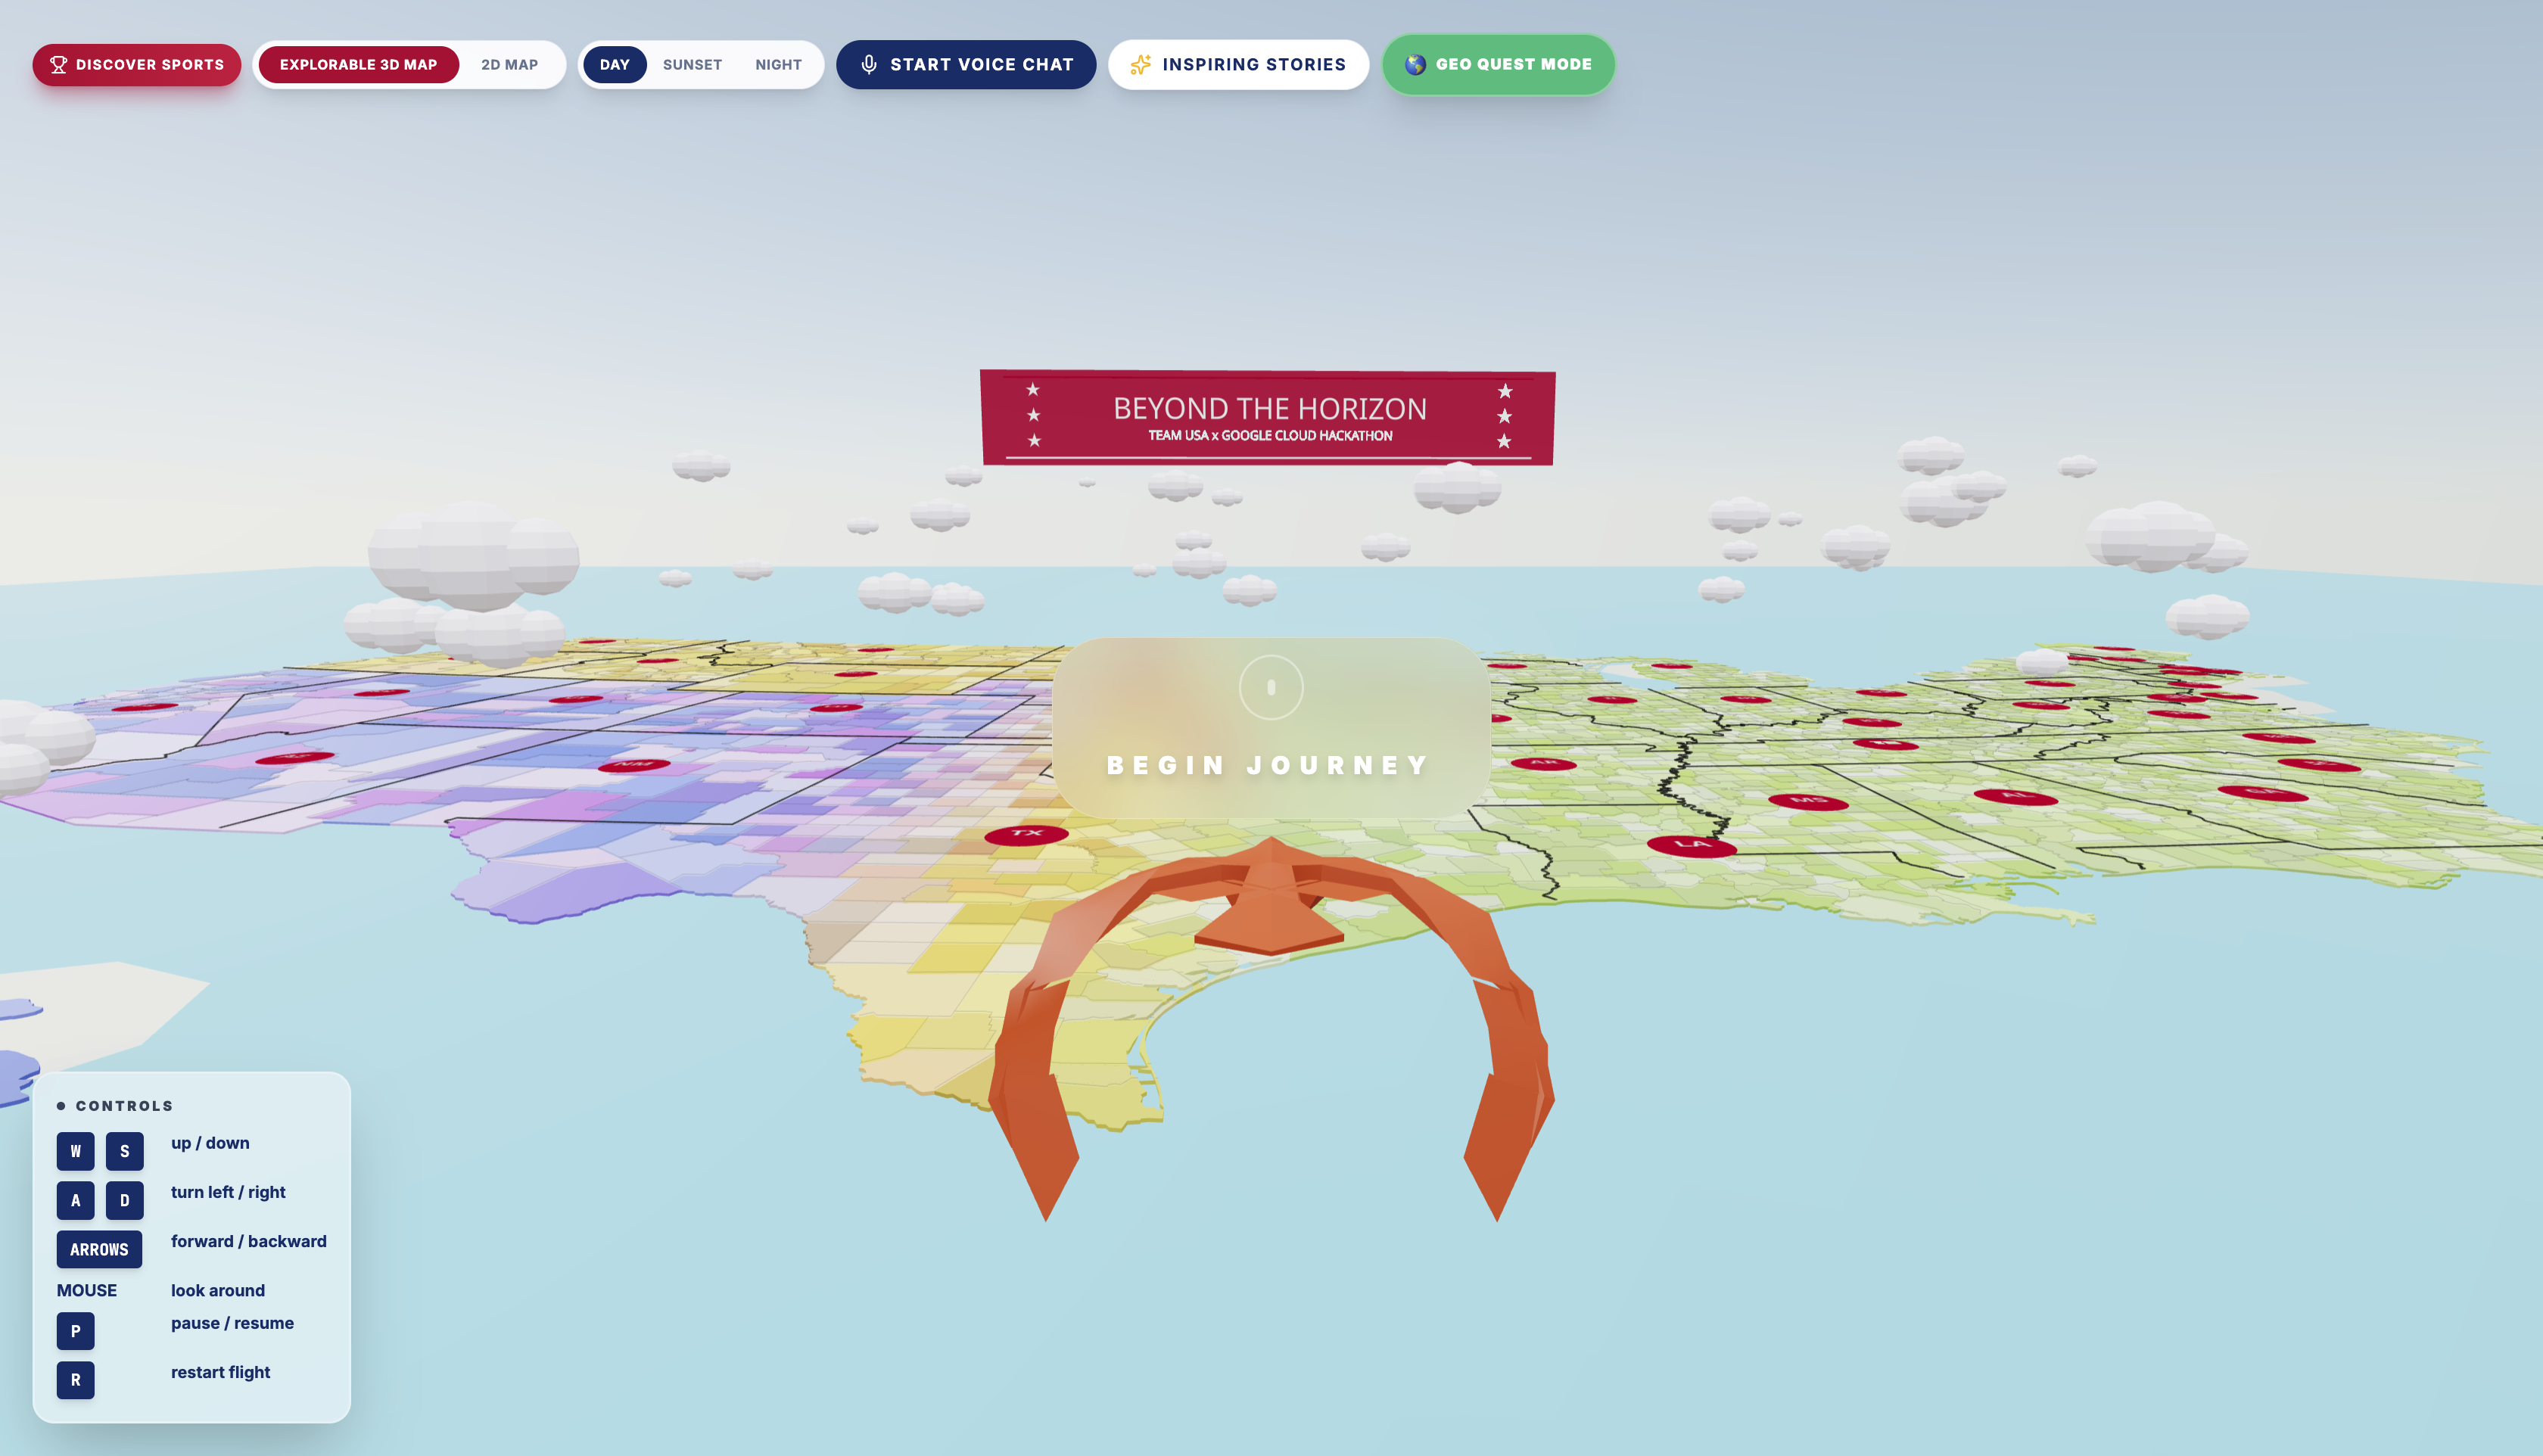
Beyond the Horizon is a multi-agent AI experience powered by Gemini that transforms 127 years (1900–2026) of Team USA Olympic & Paralympic athlete data into an immersive, explorable 3D world. Powered by a Conversational Data Analyst Agent, Hometown Intelligence Agent, and Storytelling Agent, fans can fly across the United States to uncover hometown patterns, collective milestones, regional hubs, and inspiring stories across diverse athlete communities.
Try it out!
Explore the live demo: Beyond the Horizon
GitHub Repo (Open Source – Apache License 2.0): Beyond the Horizon
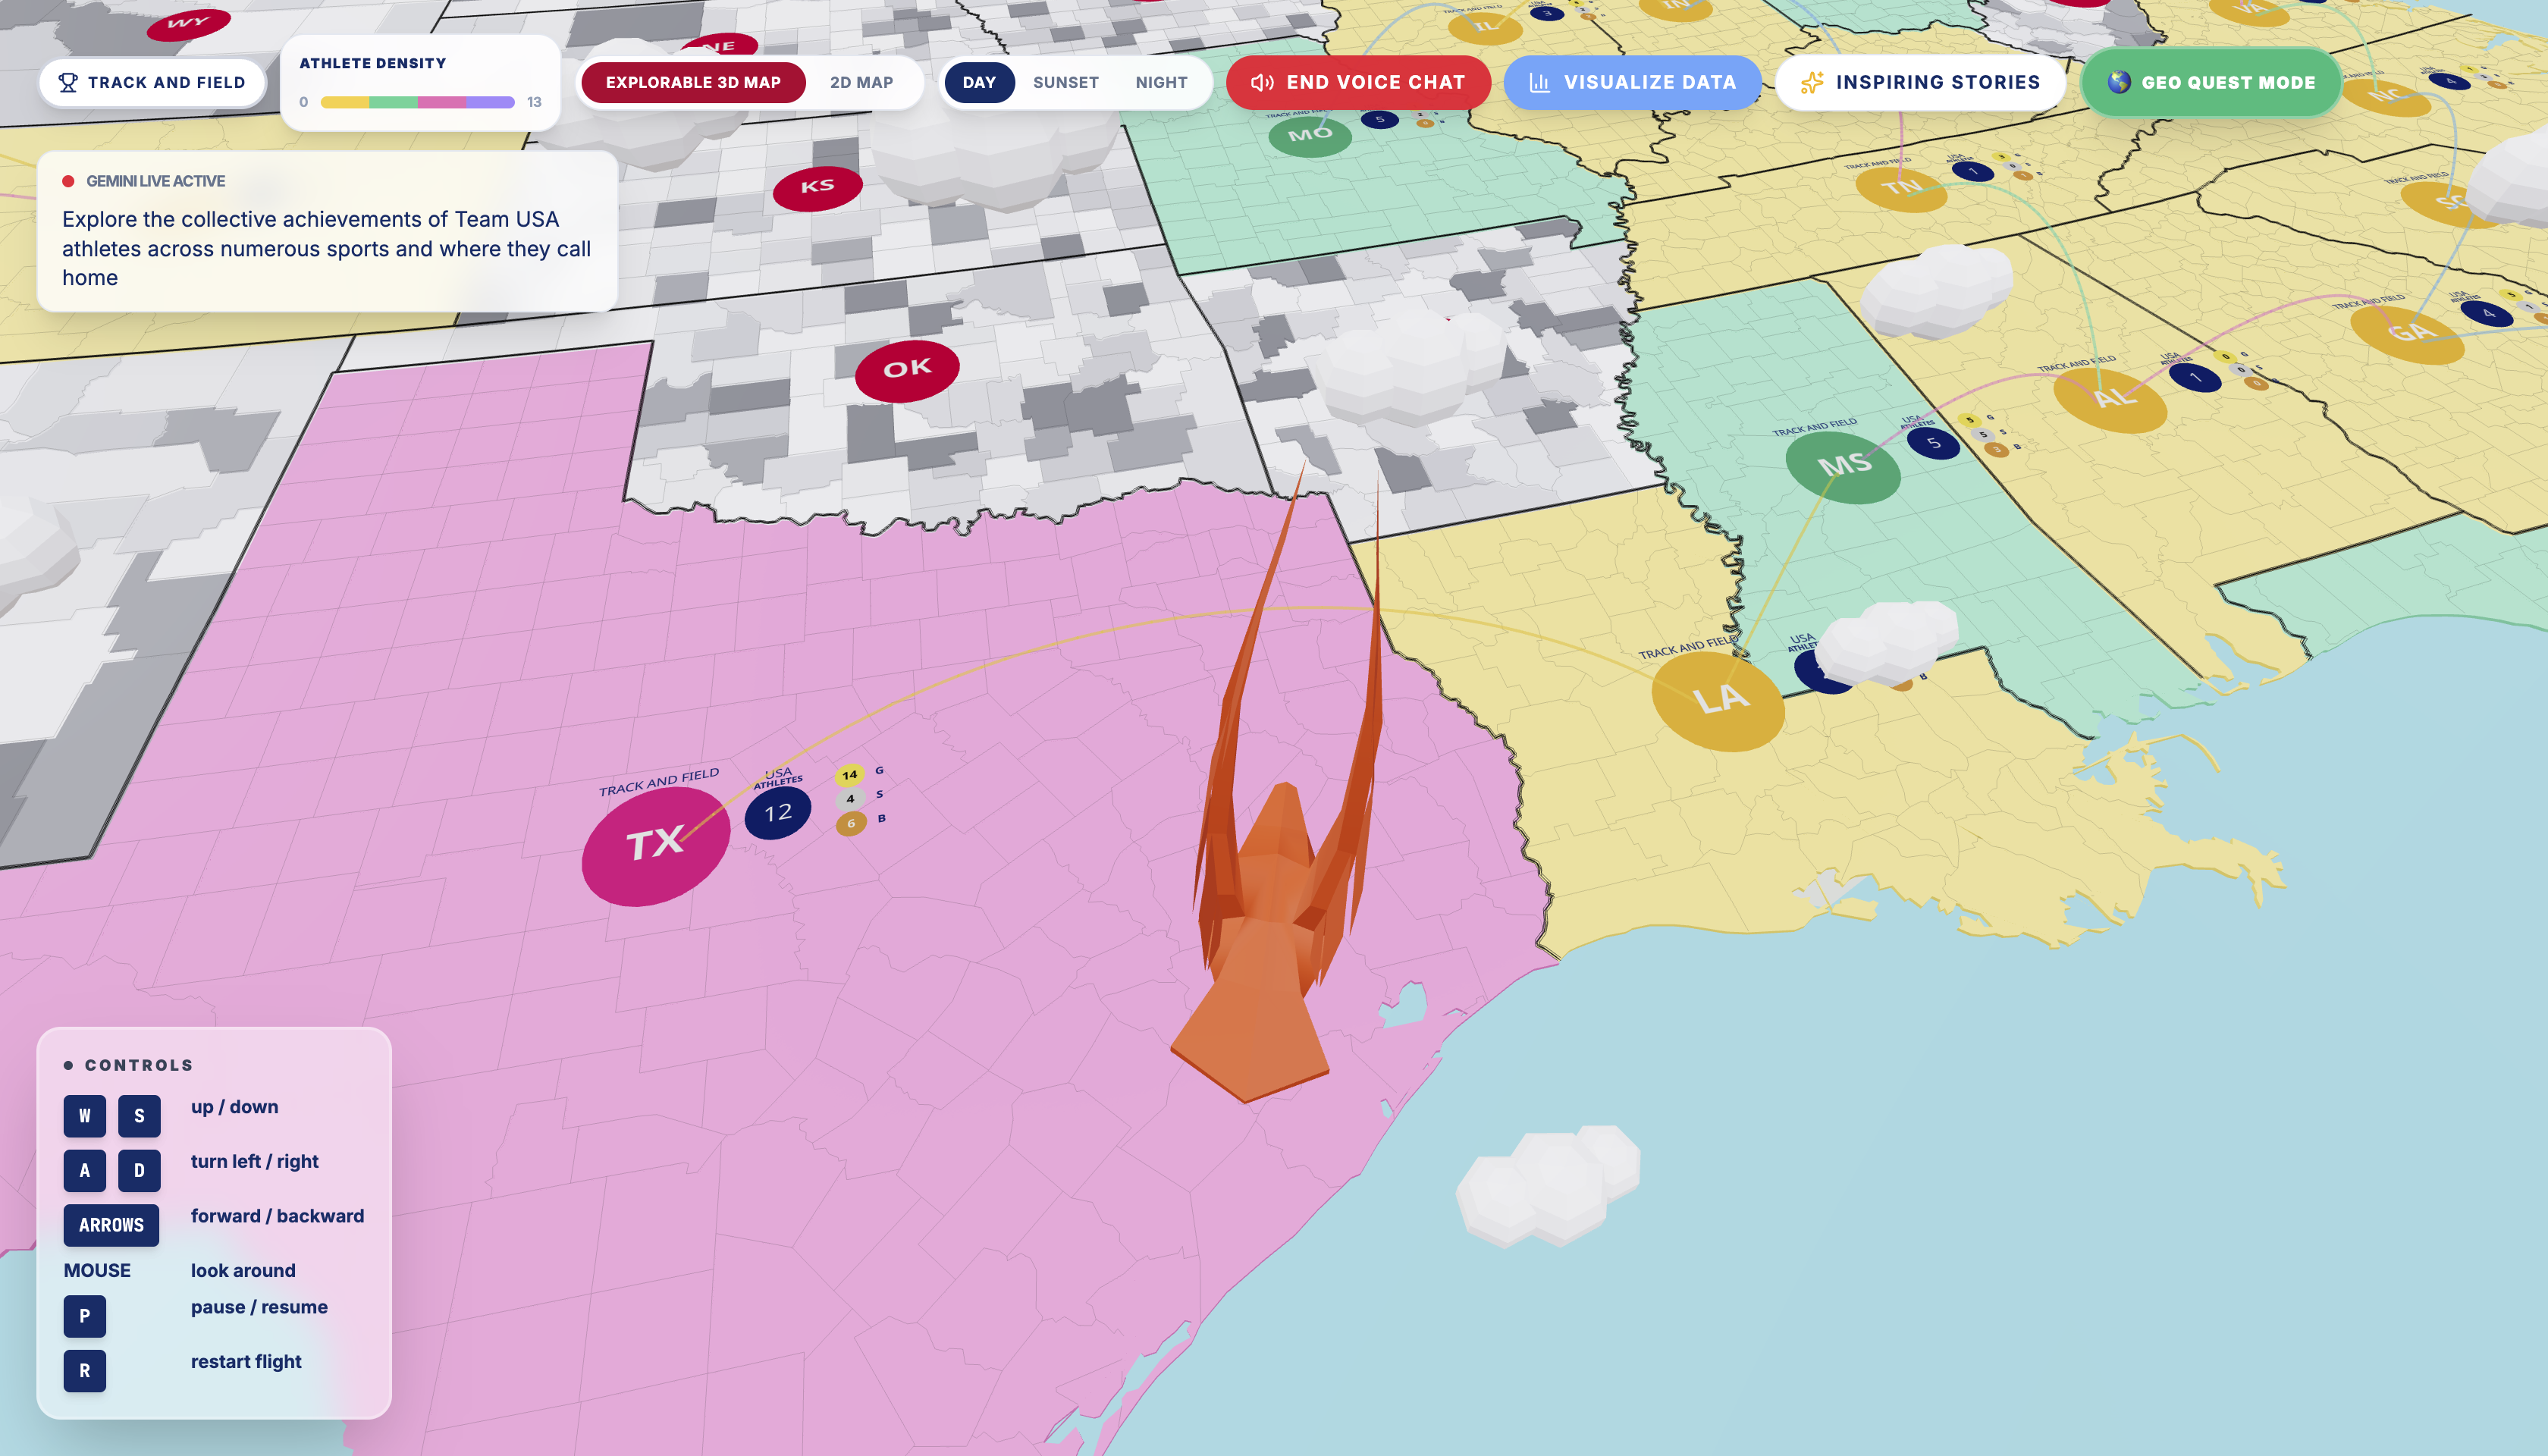
The app is inherently multimodal, combining voice interaction + 3D immersion so that the data is not just read – it is experienced through conversation, visuals, and exploration. A core part of the experience is the Gemini Live Conversational Data Analyst Agent, where fans can naturally ask questions about 20+ sports, Team USA representation, and their own athletic interests (connect their own hometown identity). Gemini reasons over the data in real time and dynamically updates the 3D world – highlighting states, surfacing geographic insights, and generating visualizations directly on the map as the conversation unfolds.
Built with Gemini Live, the Google Gen AI SDK, Three.js, and deployed on Google Cloud Run, this platform combines multimodal AI, voice interaction, generative storytelling, and immersive 3D visualization to create a new kind of interactive fan exploration experience!
Dataset Construction & Map Intelligence
Our dataset was built entirely from publicly available Team USA data from the Official Team USA Website (www.teamusa.com), following the hackathon's public-only data policy. We structured data for 2,238 Team USA athletes across 54 sports, including 40 Olympic and 14 Paralympic sports, with a deliberate emphasis on strong Paralympic representation through sports such as Para Swimming, Para Track & Field, Wheelchair Basketball, Wheelchair Rugby, Sled Hockey, and Wheelchair Tennis. The dataset spans 1,188 hometown cities, 68 states and territories, and 127 years of Team USA representation from 1900–2026.
To transform large amounts of unstructured athlete-profile data into clean, analysis-ready formats, we used Gemini to process, normalize, validate, and structure the data into dynamic CSV pipelines optimized for our multi-agent architecture. We additionally integrated the Google Maps API alongside a custom-built USMap3D component with state-level granularity to power immersive geographic exploration and hometown-based interaction throughout the platform.
Importantly, the platform was intentionally designed to comply with all Team USA data usage guidelines: the application displays no individual athlete NIL (name, image, or likeness) and instead surfaces only collective, aggregated insights across sports, states, and communities. We also strictly avoided prohibited data such as finish times or detailed scoring results, relying only on permitted public information including medals, sport participation, and hometown representation.
Technical Overview
| Layer | Technologies / Models | Purpose |
|---|---|---|
| Frontend + UI | React, Vite, TypeScript, TailwindCSS, shadcn/ui, Lucide React, Motion | Core interface, responsive design, animated panels, and polished user interactions |
| 3D Map + Geographic Visualization | Three.js, React Three Fiber, Custom USMap3D, Google Maps API, D3-geo, TopoJSON | Interactive U.S. map with state-level granularity, camera controls, projections, and dynamic state highlighting |
| Data Processing | PapaParse, structured CSV datasets | Parses athlete, sport, medal, hometown, year, and regional data for live filtering and analysis |
| AI Agents + Multimodal Gemini Models | Gemini 3.1 Flash Live Preview API, Google Gen AI SDK, gemini-flash-latest, gemini-2.5-flash-image, custom tool calling | Powers voice-based analysis, multilingual queries, storytelling, structured data retrieval, and AI-generated visual narratives |
| Cloud Deployment + App Development | Docker, Node 22 Alpine, Nginx Alpine, Google Cloud Run, Cloud Build, Google AI Studio | Supports scalable deployment, static serving, continuous builds, debugging, and rapid iteration |
Core Features + How They Work
1. Gemini Live Conversational Data Analyst Agent
We designed this agent to make Team USA data feel conversational instead of static.
Built using the Google Gemini 3.1 Flash Live Preview API, Google Gen AI SDK, and a custom tool-calling architecture, the agent supports real-time streaming voice interaction, multilingual querying, and live data retrieval across our Team USA Olympic & Paralympic sports datasets.
How it works:
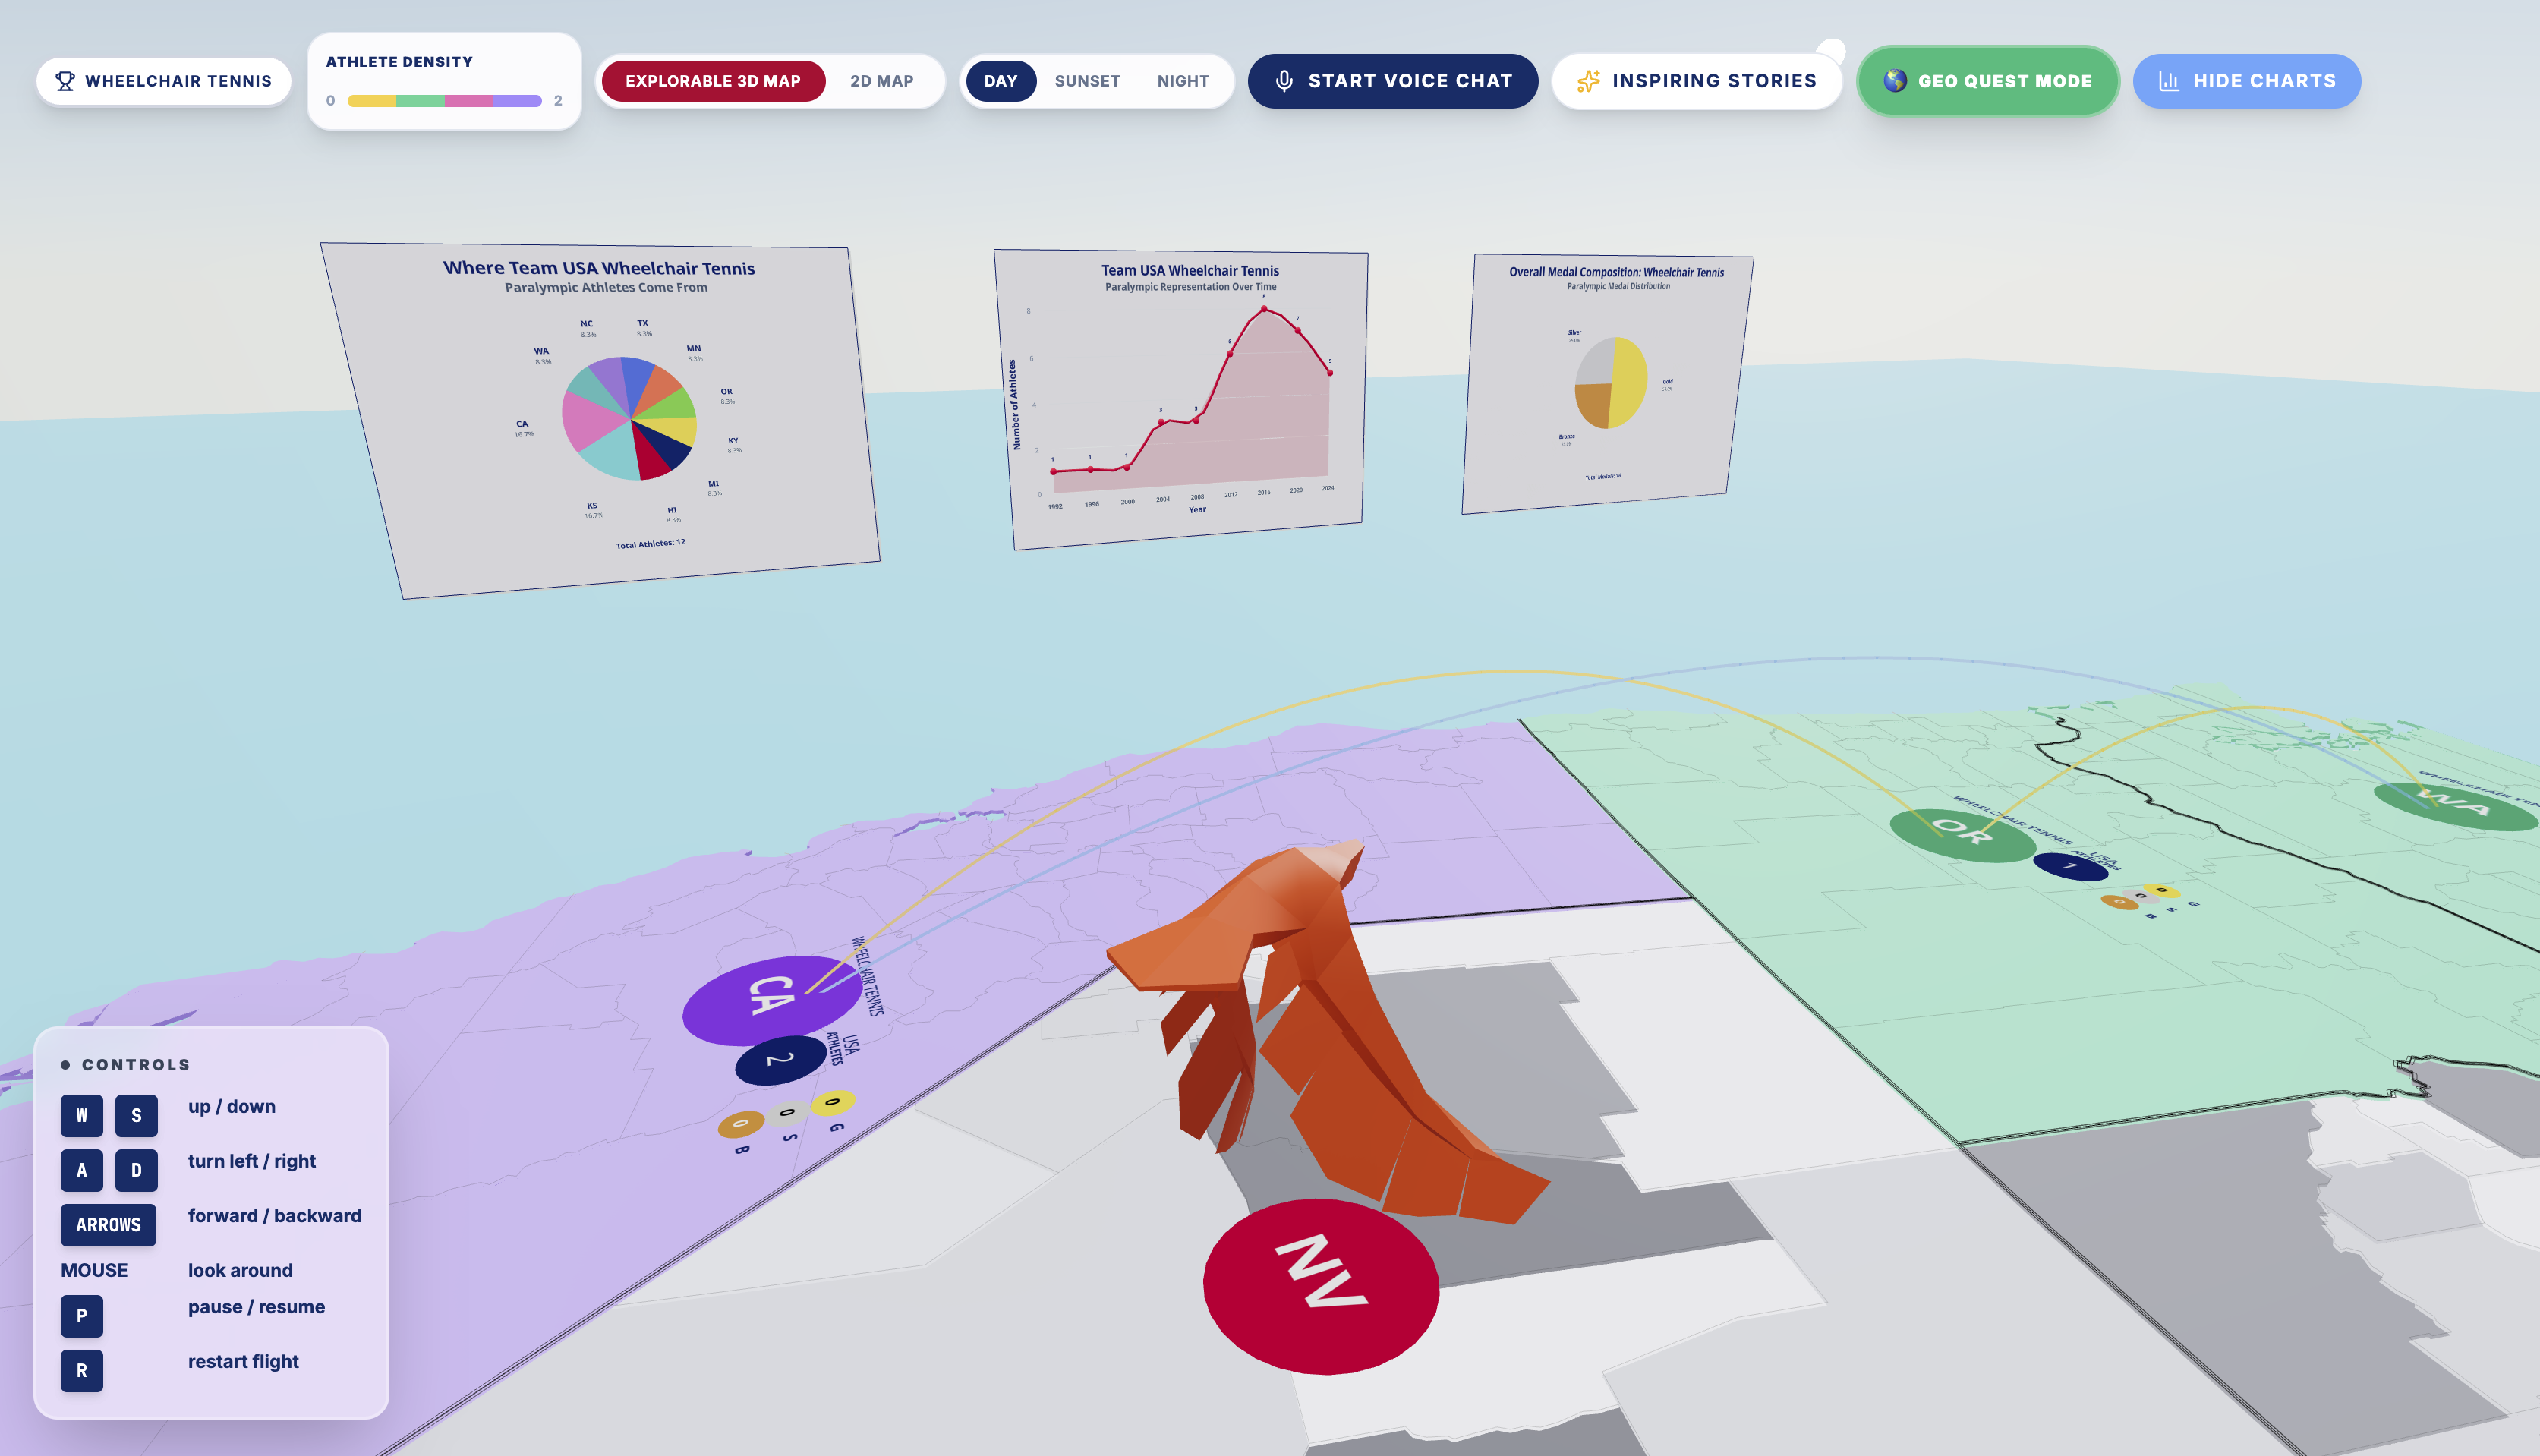
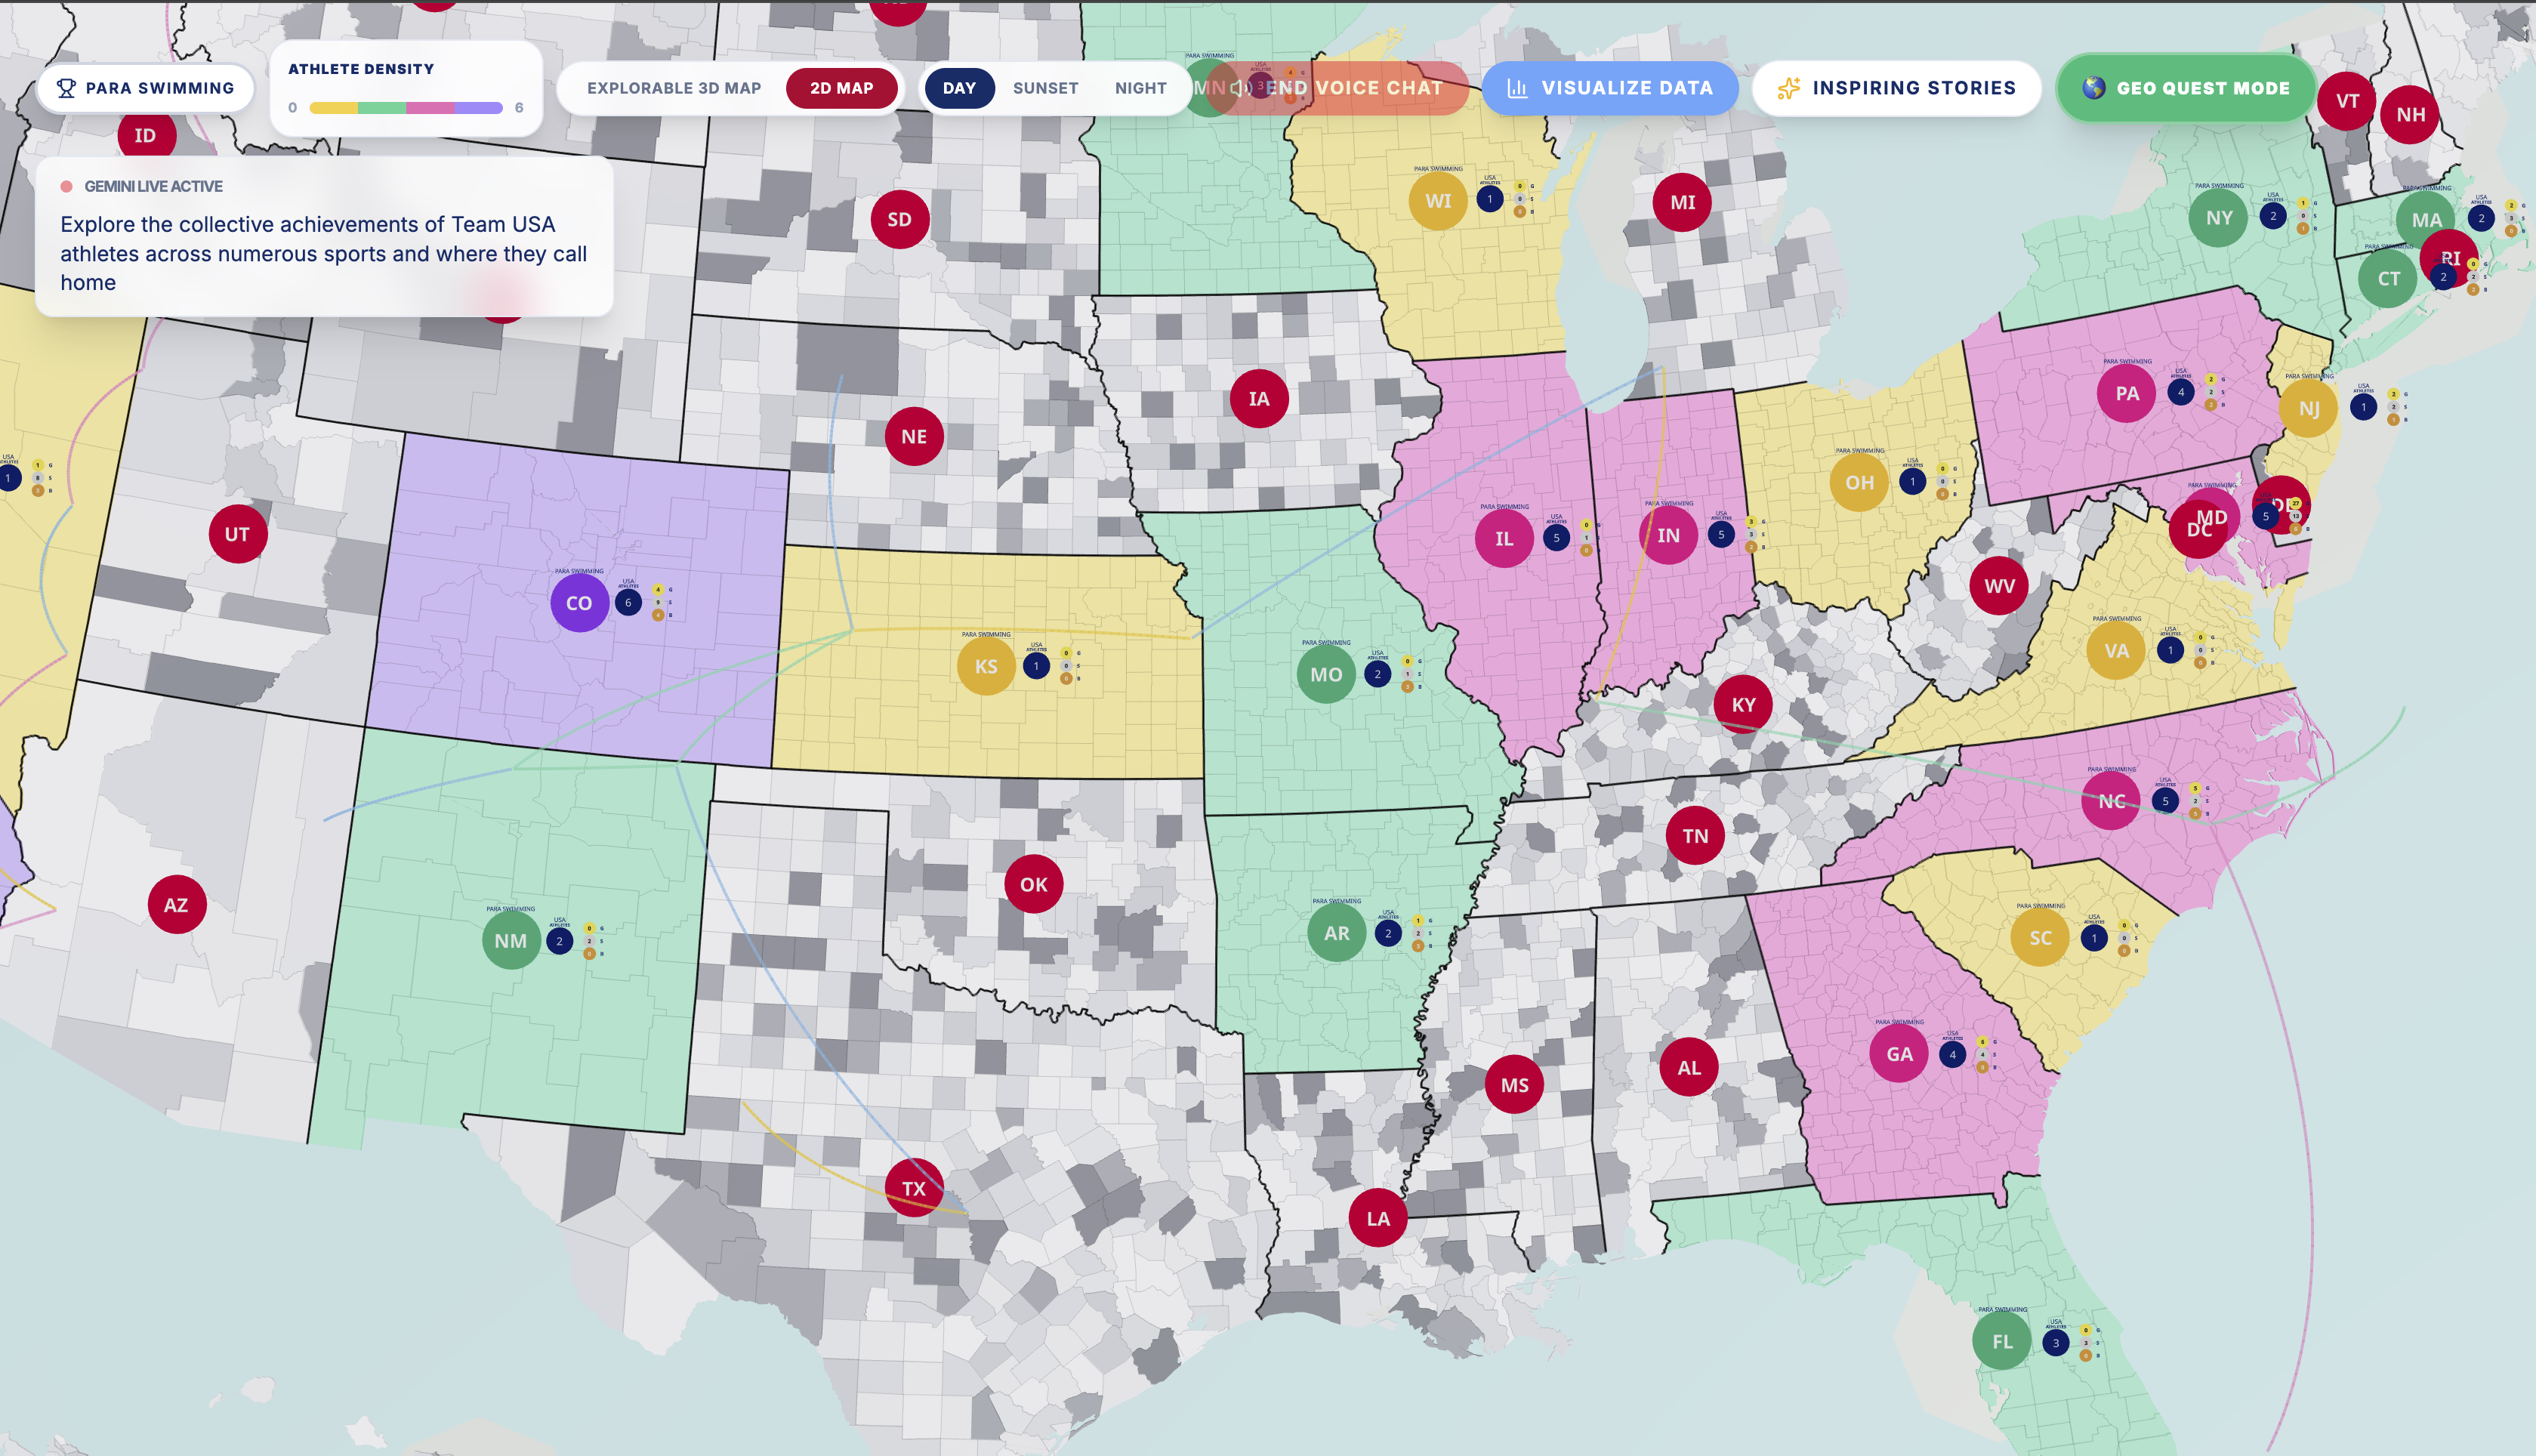
get_sport_data: retrieves structured CSV data for a selected sport, including athlete counts, hometown/state distribution, and medal totalshighlight_states: sends geographic results to the custom USMap3D component, where each highlighted state displays athlete count and medal breakdowns across gold, silver, and bronze- Outputs are streamed back to the frontend and synchronized with the Three.js environment, dynamically triggering state highlighting and dynamic 3D visualizations. Users can generate three live chart panels: representation over time, hometown/state representation, and medal composition percentage.

*Figure 1. Dynamic Data Visualizations
2. Generative Storytelling Agent
We created this agent to make the experience feel human, emotional, and inspiring — not just analytical.
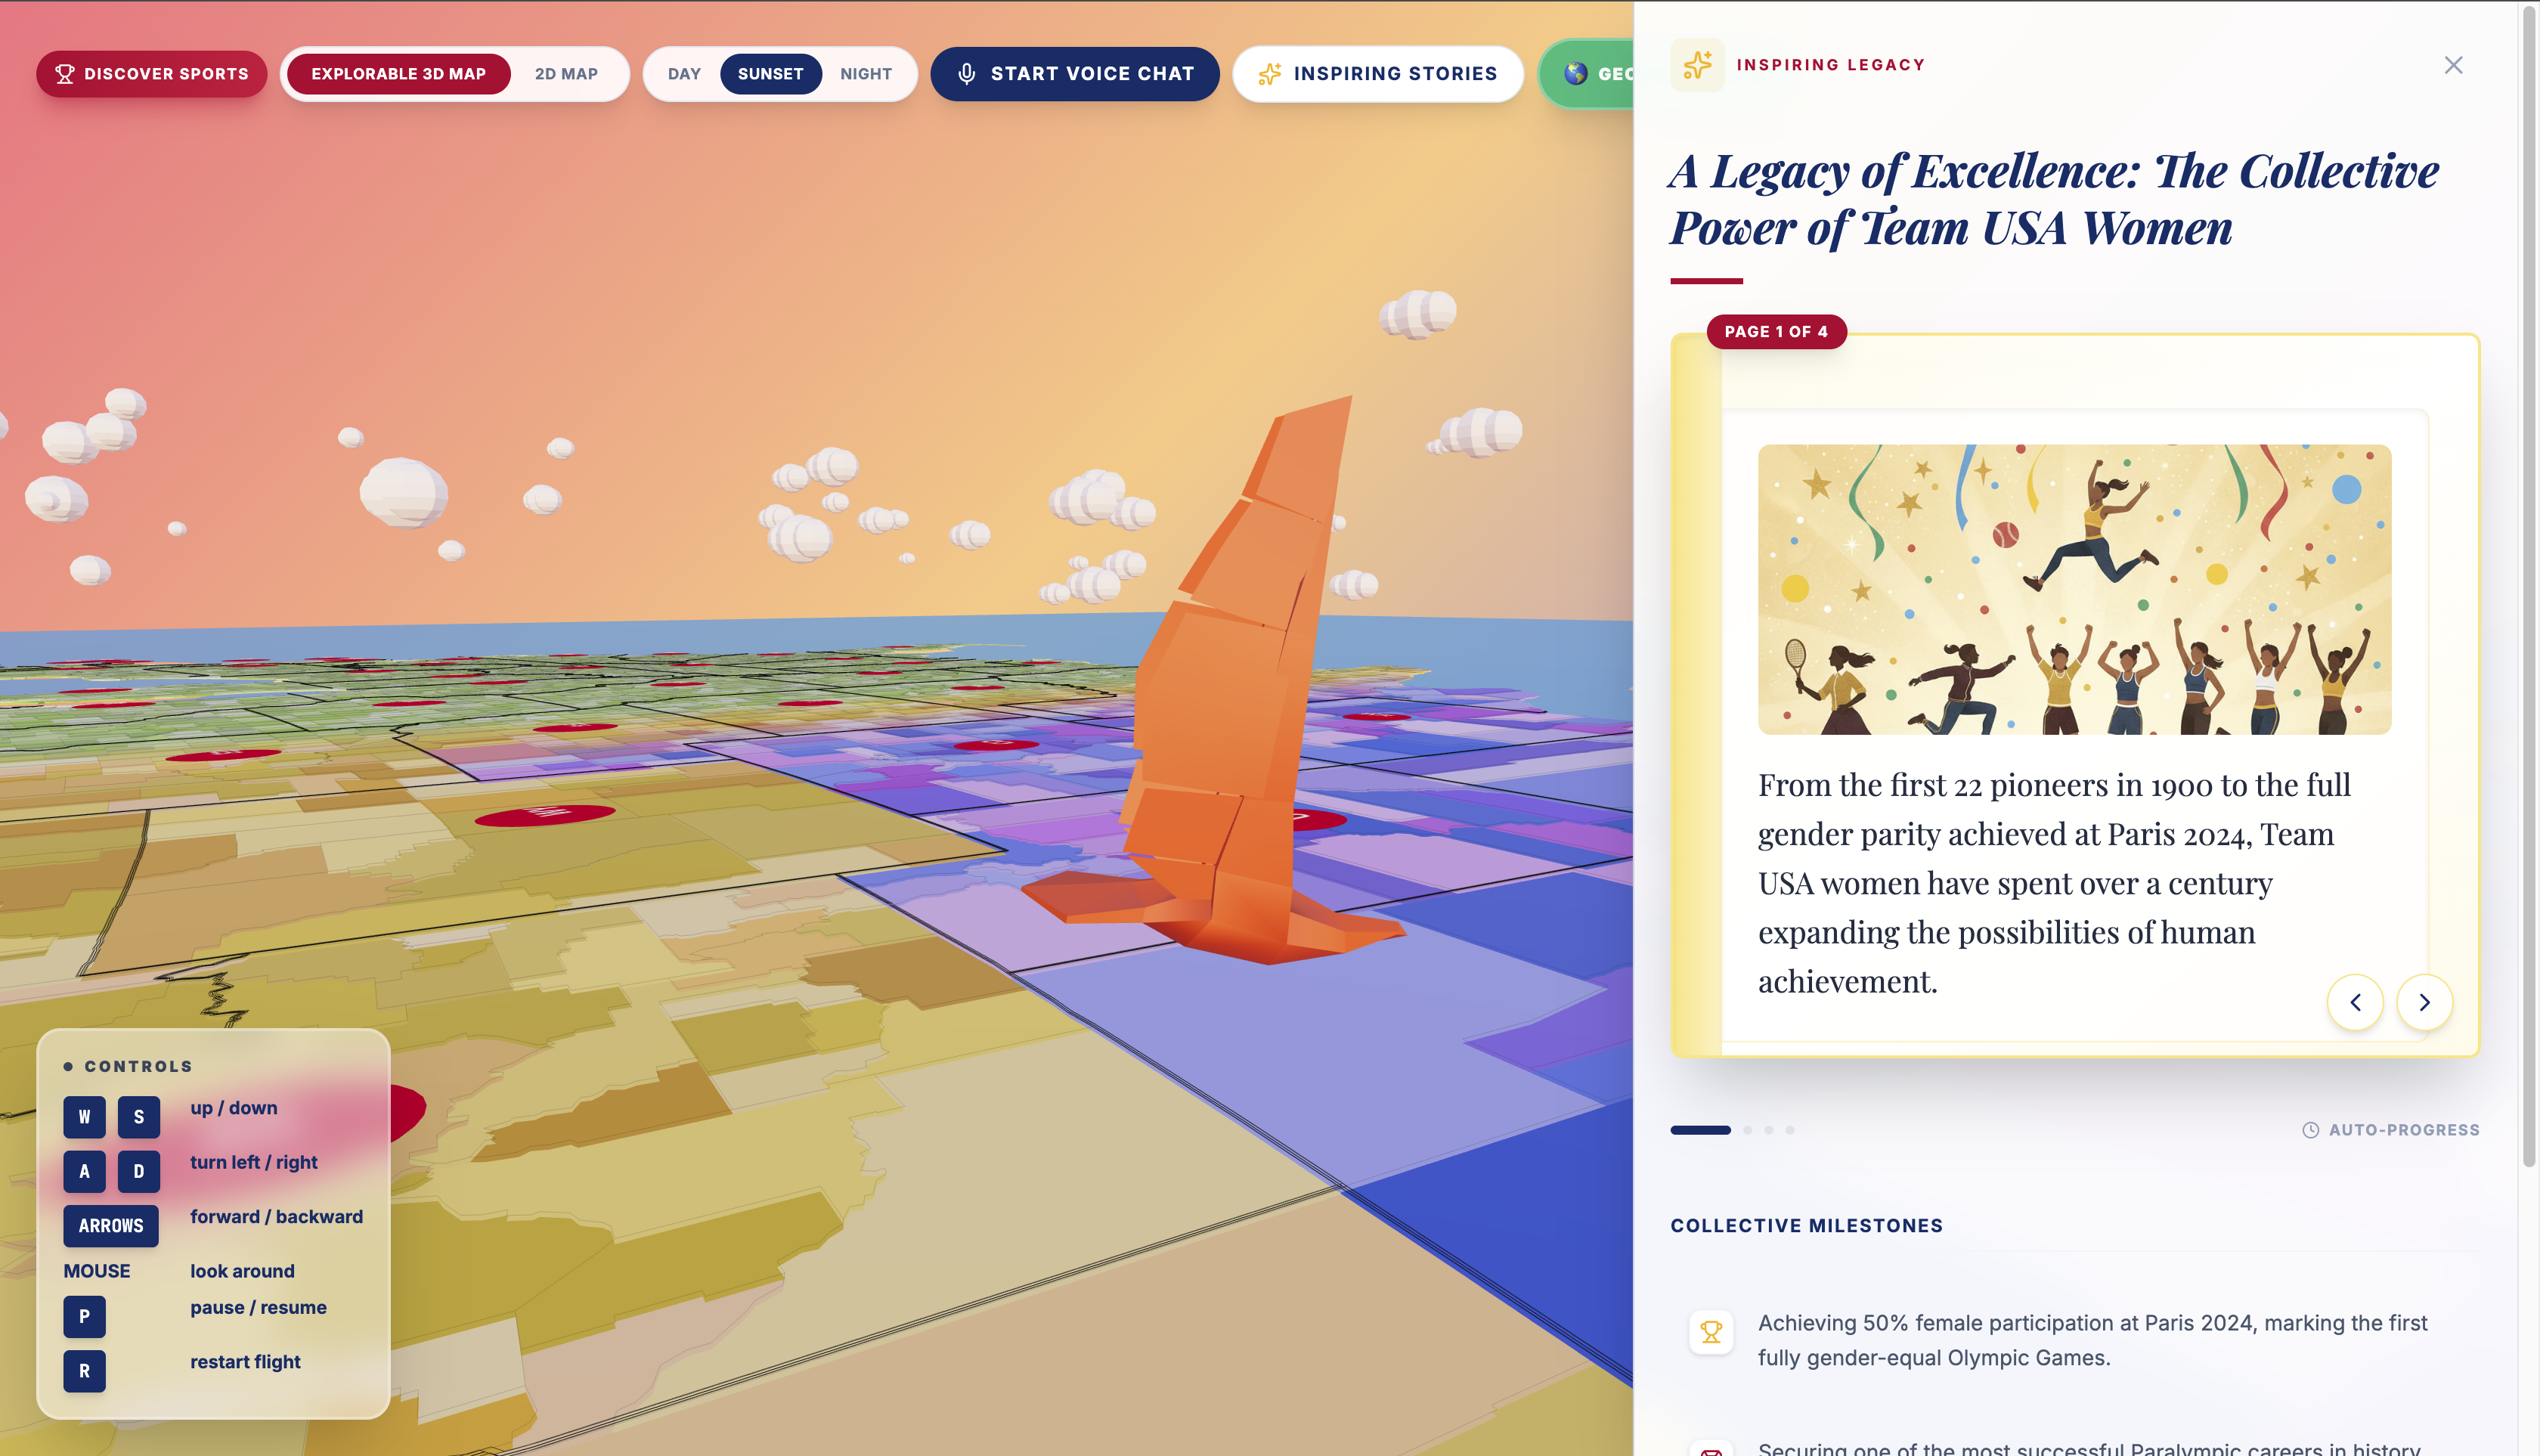
Built using Gemini Flash for text generation and Gemini 2.5 Flash Image (Nano Banana) for AI-generated illustrations, the agent turns publicly available, real Team USA story data into structured visual narratives.
How it works:
- Uses real public Team USA stories highlighting themes such as AAPI, Hispanic, LGBTQ, Military, and Women athletes
- Uses the Google Gen AI SDK’s
generateContent()method to transform article content into a 4-slide narrative with milestones, state highlights, and story beats - Uses Gemini Flash to generate detailed illustration prompts, then passes them to Gemini 2.5 Flash Image to create colorful animated visuals
- Avoids Olympic branding and individual athlete NIL by using synthetic, collective-level scenes instead of real athlete images

Figure 2. AI-Generated Team USA Storytelling Experience
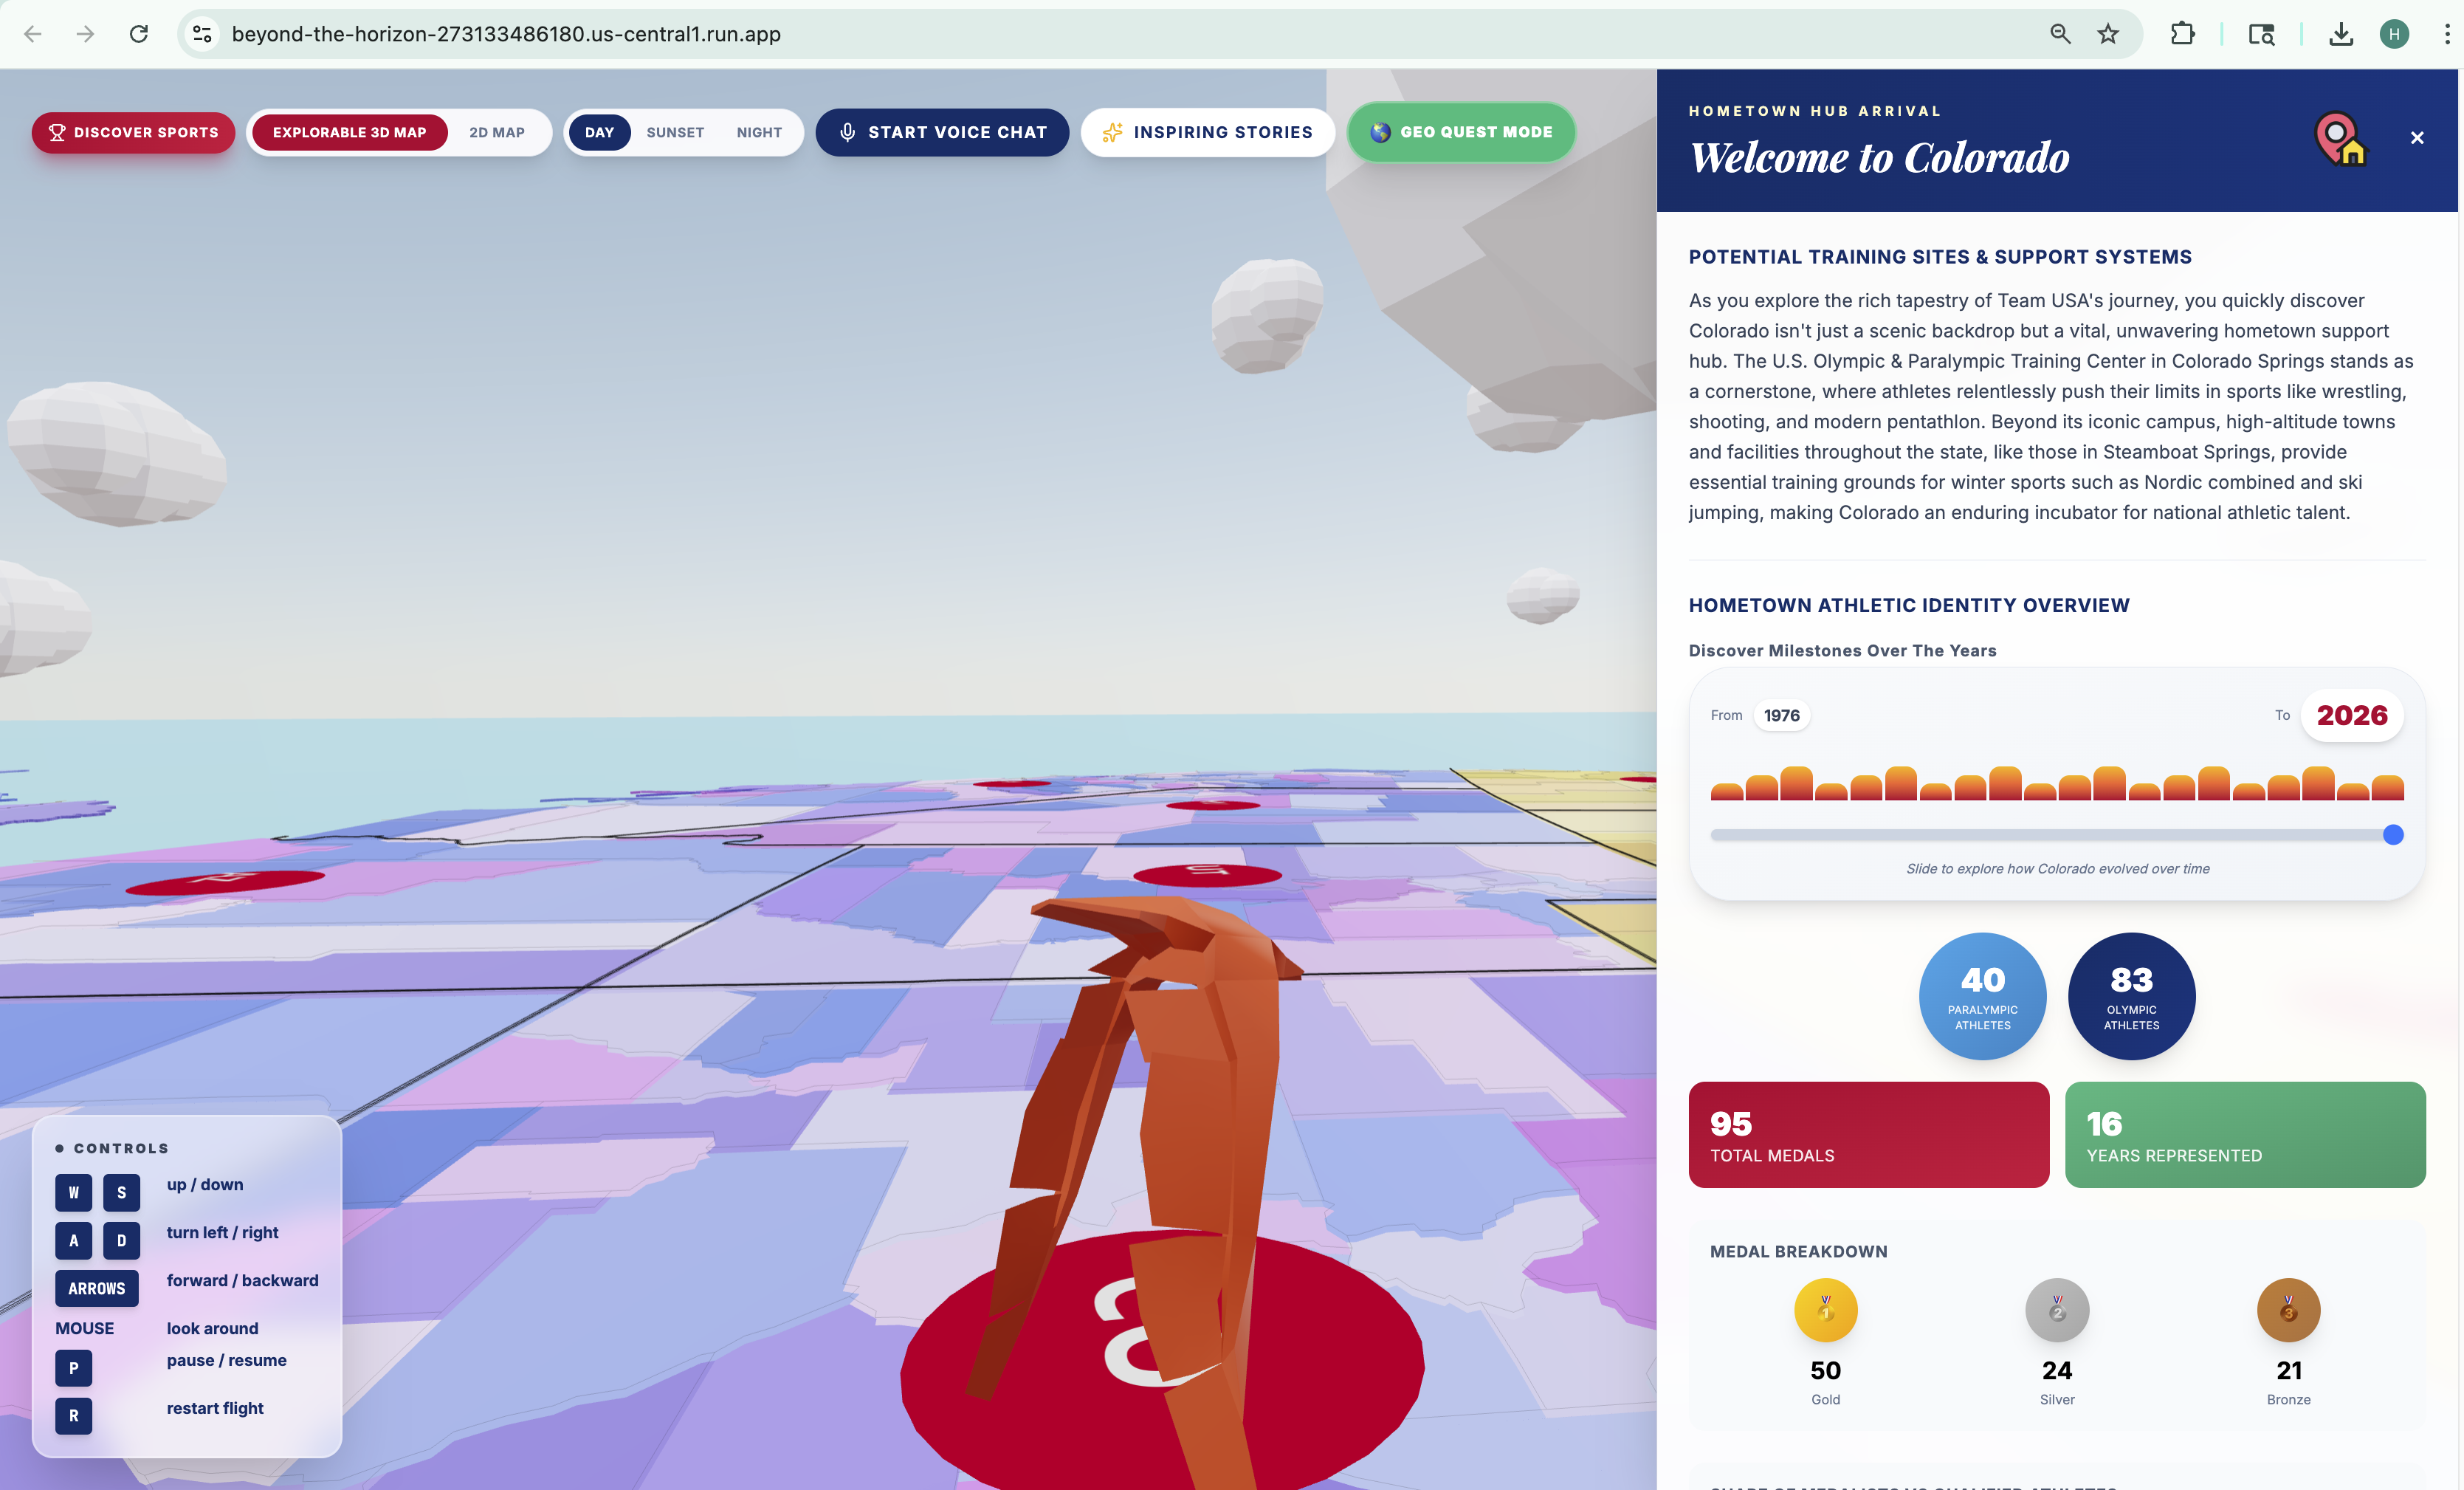
3. Hometown Intelligence Agent + Hometown Hub Athlete Identity Overview
This agent powers the state-level intelligence and exploration layer of the platform.
- Uses the Google Search tool to retrieve context on potential hometown training sites, pathways, regional sport infrastructure, and programs that may help foster Team USA excellence, including Paralympic training hubs.
- Processes 54 structured CSV datasets with PapaParse, aggregating athlete hometown data across sports, medal counts, years represented, education, and regional metadata.
- Uses
getStateSportStatistics()to compute state-specific Olympic and Paralympic representation, per-sport athlete counts, gold/silver/bronze medal totals, medalist vs. qualified athlete breakdowns, and timeline coverage from 1900–2026. - Generates a dynamic Athlete Identity Overview panel for each state, showing collective representation patterns, regional sport hubs, participation trends, and historical evolution with timeline slider.

Figure 3. Hometown Intelligence + Athlete Identity Overview
4. GeoQuest — GeoGuessr-Inspired Exploration
Inspired by the gamified engagement of GeoGuessr, GeoQuest turns hometown data discovery into a playable exploration experience.
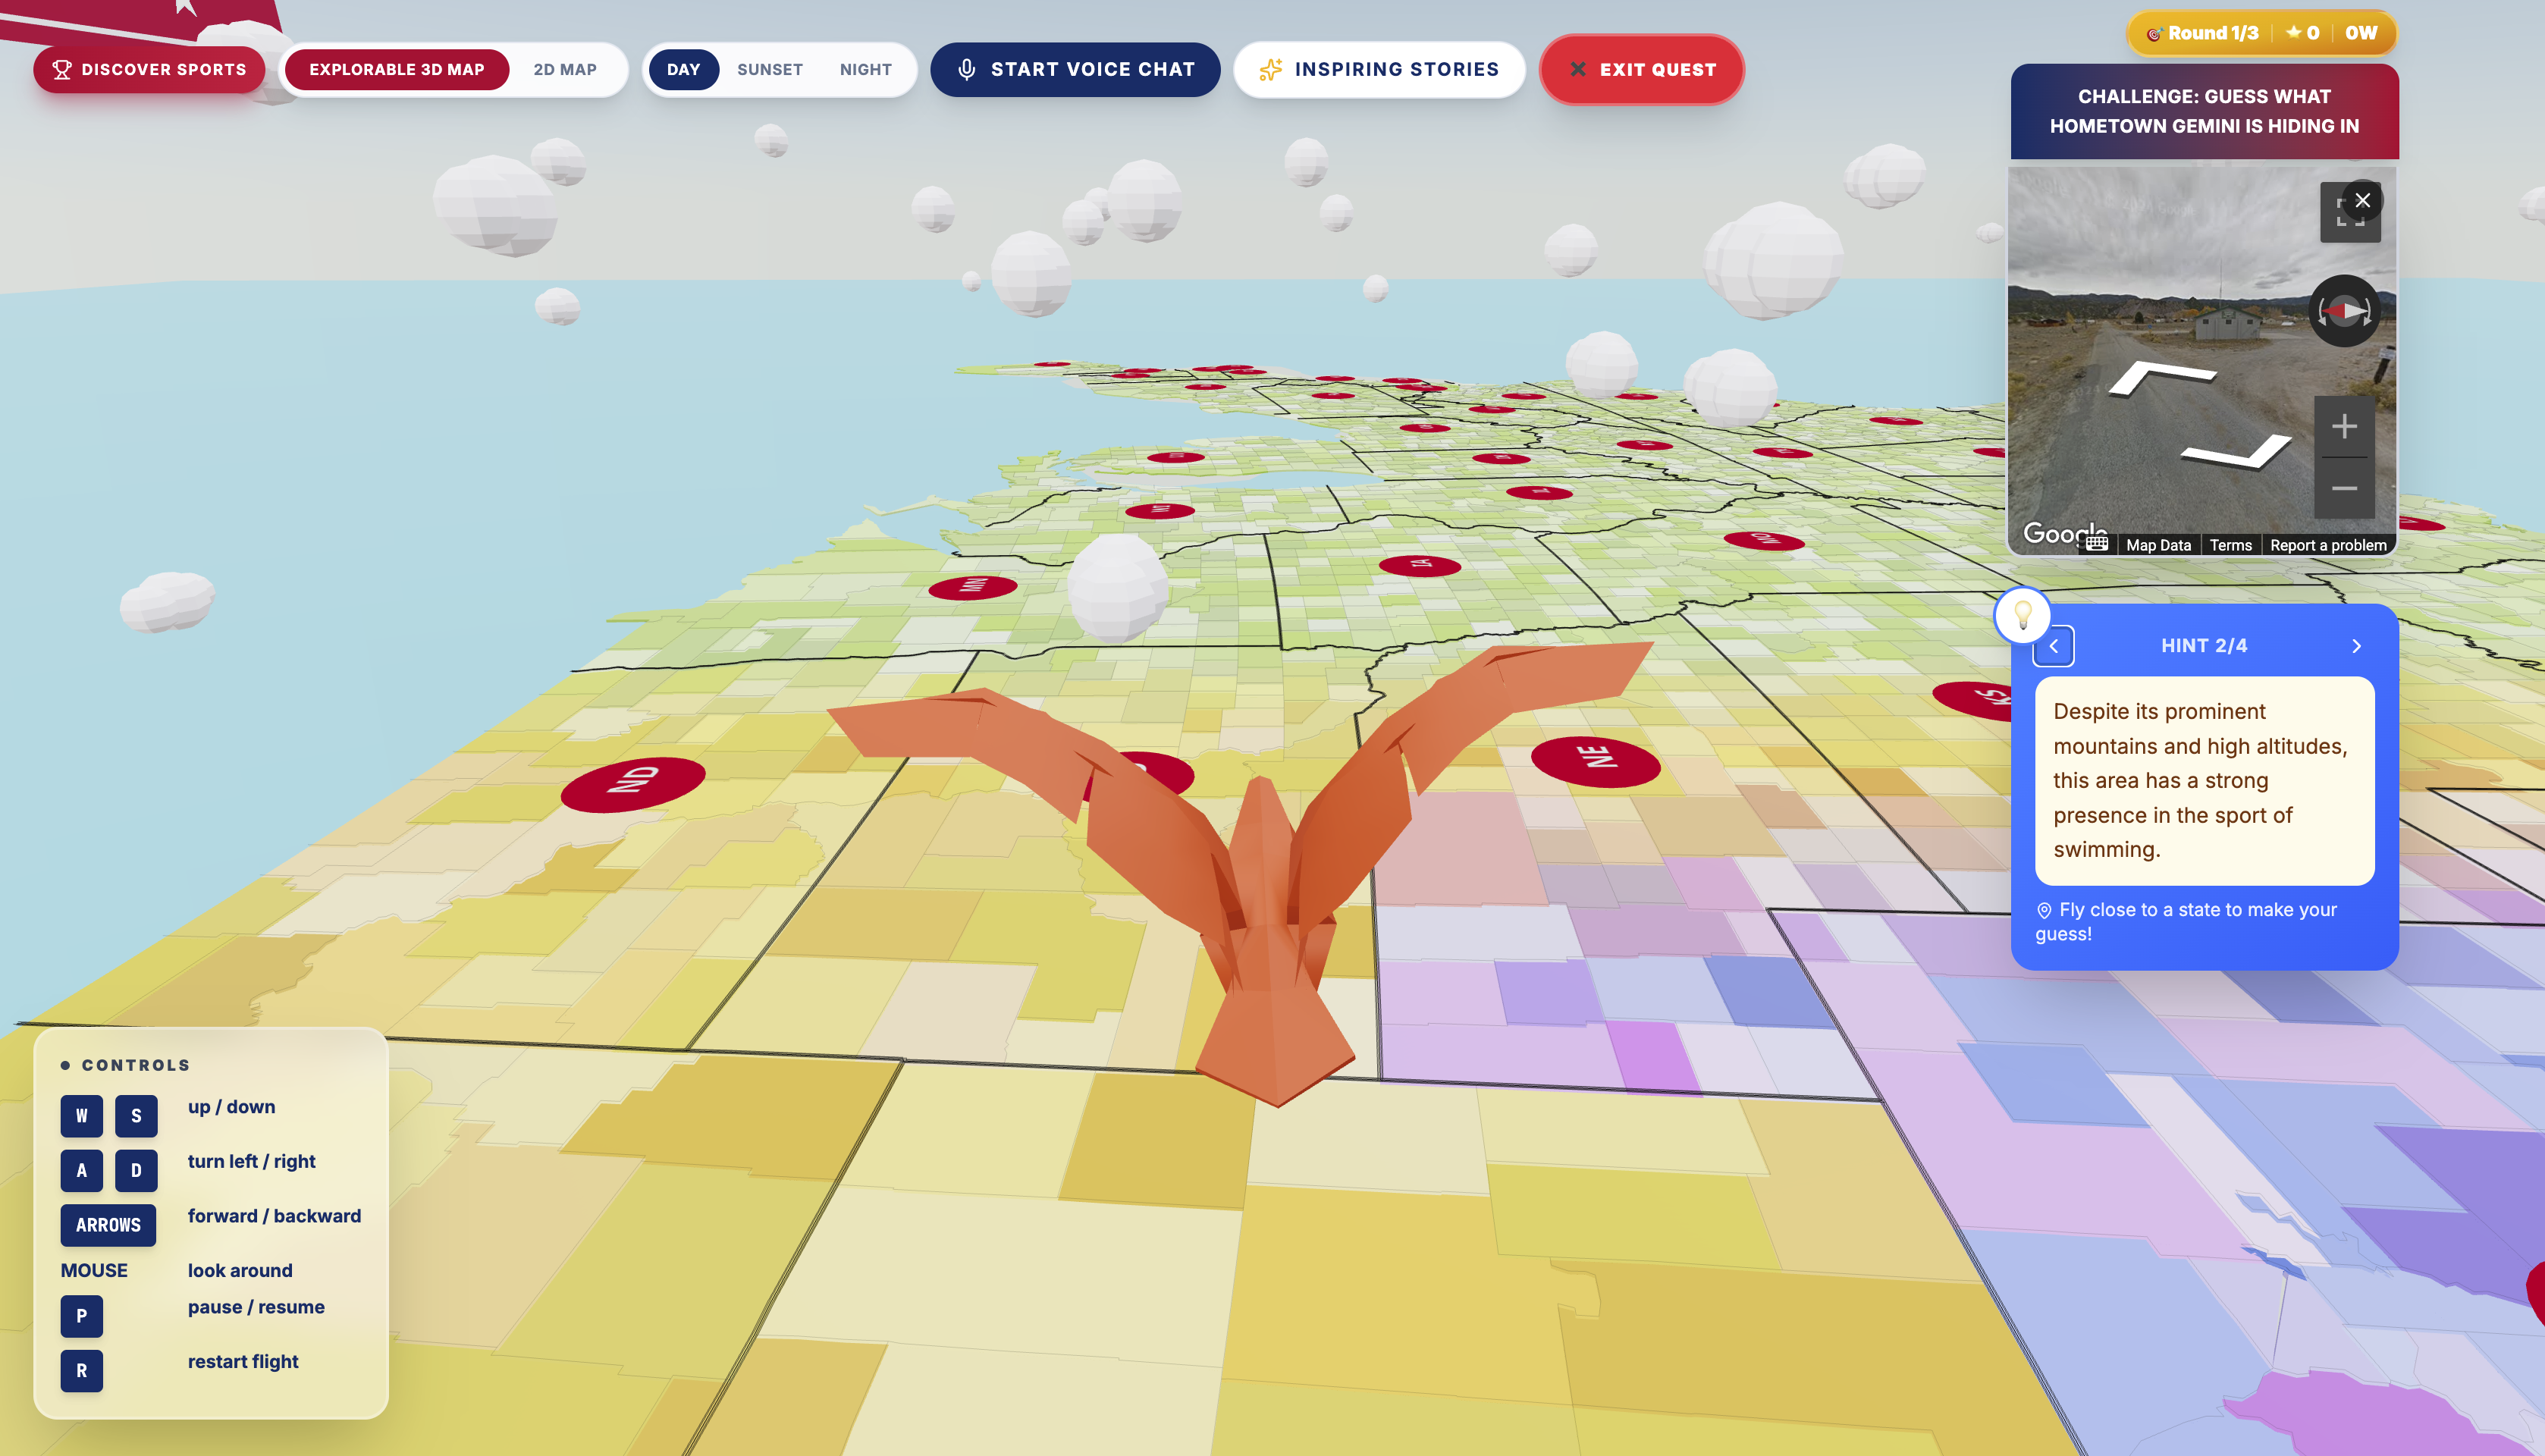
- Built using the Google Maps Street View API, allowing users to navigate real-world hometown environments tied to Team USA athlete regions, while Gemini dynamically generates clues from athlete representation data
- Combines geographic exploration + AI-generated reasoning into a repeatable gameplay loop designed to increase fan engagement & discovery.

Figure 4. GeoQuest GeoGuessr-Inspired Fan Exploration
Based on our Team USA dataset spanning 54 sports, 1,188 hometown cities, and 127 years of representation, some of our key hometown intelligence and athlete pipeline findings are shown below.

Future Possibilities
We believe an interesting future feature would be adding a social exploration layer to the 3D world. Fans could mark their hometowns, see where other fans are exploring from, and discover shared connections across sports, states, and Team USA history. This could make the experience feel more community-driven and help fans connect their own hometown identity to the larger Team USA story.
We also want to explore more multimodal interaction methods using computer vision, including gesture-based interaction and live camera input, as people continue to look for more engaging ways to interact with tabular data!
Built With
- cloud-build
- custom-tool-calling
- custom-usmap3d
- d3-geo
- docker
- gemini-2.5-flash-image
- gemini-flash-latest
- google-cloud-run
- google-gemini-3.1-flash-live-preview-api
- google-gen-ai-sdk
- google-maps
- googleaistudio
- lucide-react
- motion
- nginx-alpine
- node-22-alpine
- papaparse
- react
- react-three-fiber
- shadcn/ui
- structured-csv-datasets
- tailwindcss
- three.js
- topojson
- typescript
- vite


Log in or sign up for Devpost to join the conversation.