-
-
Dashboard (1)
-
Dashboard (2)
-
Dashboard (3)


Inspiration
The 2008 financial crisis didn't just crash the housing market. It fundamentally rewired how America lends and borrows. But HMDA data can't tell you why the crisis happened. What it can tell you is how the entire lending landscape transformed in response. We set out to visualize that transformation as a three-act story: the collapse, the structural shift, and the uneven recovery.
What it does
An interactive HMDA Recovery Dashboard built in Plotly Dash, covering 2007 to 2017 across six visualization panels organized around a clear narrative:
Act 1 — The Collapse
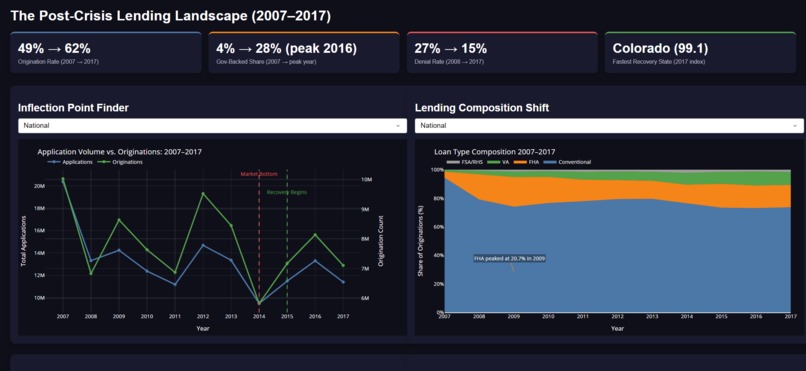
- Inflection Point Finder — Dual-axis line chart of application volume vs. originations, with data-driven annotations marking the 2014 market bottom and 2015 recovery inflection point
Act 2 — The Structural Shift
- Lending Composition Shift — 100% stacked area chart showing FHA loans surging to 20.7% in 2009 as conventional lending collapsed
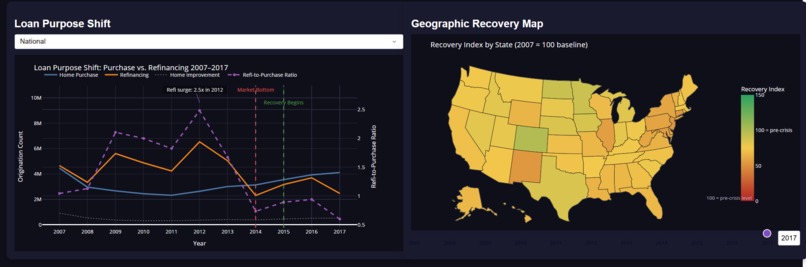
- Loan Purpose Shift — Purchase vs. refinancing vs. home improvement over time, capturing the 2.5x refi surge in 2012 as rates bottomed
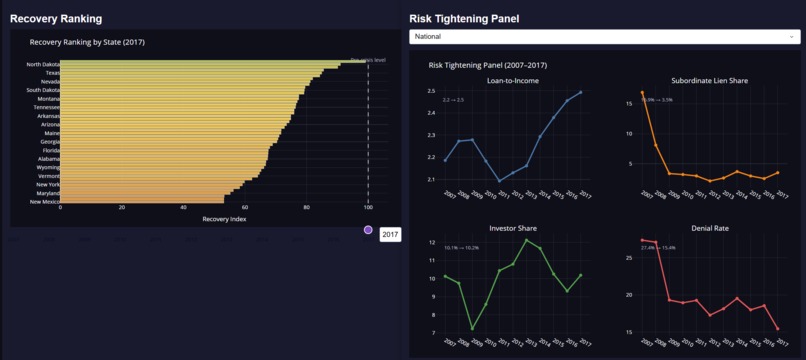
- Risk Tightening Panel — Four sparklines (Loan-to-Income, Subordinate Lien Share, Investor Share, Denial Rate) showing how underwriting standards tightened post-crisis
Act 3 — The Recovery
- Geographic Recovery Map — Choropleth of all 50 states with a time slider (2007 to 2017), colored by a Recovery Index (2007 = 100 baseline)
- Recovery Ranking — Horizontal bar chart ranking states by recovery speed; Colorado led at 99.1 by 2017, New Mexico lagged
Executive KPI Strip — Four top-level callouts: Origination Rate (49% to 62%), Gov-Backed Share (4% to 28% peak), Denial Rate (27% to 15%), Fastest Recovery State
How we built it
Python, Plotly Dash, and Pandas. The raw HMDA dataset spans 11 annual files at around 10 to 15 GB each, so we built a chunk-reading pipeline that extracted only the 15 columns we needed and aggregated everything into pre-computed summary tables by state and year before the dashboard ever touched the data.
We computed 10 derived metrics including loan-to-income ratio, origination rate, denial rate, gov-backed share, subordinate lien share, and a composite Recovery Index normalized to 2007 as the baseline. Rather than hardcoding 2008 as the crash bottom, we wrote an algorithm to detect the actual lowest origination year and first year of recovery per state. That is how we found 2014. We let the data decide.
Challenges we ran into
The scale was the first problem. Processing across 150 GB of raw data required a careful pipeline before any visualization could happen. Column names also drifted across yearly files, so we had to build a validation and rename mapping step before bulk processing. Building a meaningful recovery index across states with vastly different baseline volumes required careful handling of small-state noise too.
The bigger challenge was interpretive. HMDA has no loan performance data at all. No defaults, no credit scores, no foreclosures. Every insight had to be framed carefully around what changed inbehavior, not what caused what. Staying honest with the data while still telling a compelling story was the hardest thing to get right.
Accomplishments that we're proud of
Honestly, the 2014 finding. Walking in with one assumption and having the data completely overturn it in the first hour of analysis is not something you plan for. Building a pipeline clean enough to handle that volume and then turning it into something visually coherent in 24 hours is something we are proud of too.
What we learned
Letting the data define the narrative beats assumptions every time. Our algorithmic crash detection revealed that the national bottom wasn't 2008 or 2009. It was 2014, years after the crisis headlines faded. We also learned that the most interesting stories in a dataset are almost never in the columns you expected. The subordinate lien collapse, the investor share drop, the loan-to-income creep back upward while denial rates fell. None of those were the headline metrics. All of them told a better story than the headline metrics did.
What's next for Beyond 2008: The Untold Recovery
You know the Big Short. The crash, the greed, the collapse. But nobody ever made the sequel. What actually happened to American lending in the decade after? Did it recover? Did it transform? Did it just quietly become something nobody recognized anymore?
We thought we knew going in. Recovery kicks off around 2009, market heals by 2012, back to normal by 2015. That's the story everyone tells. The data told us something else entirely.
The market didn't bottom in 2008. It kept falling, quietly, without headlines, all the way to 2014. Six years after Lehman Brothers. The system was still bleeding out while the world had moved on.
And while it bled, the whole structure of lending changed underneath. Lenders stopped trusting themselves. Government-backed loans went from 4% to 28% of the entire market. FHA, which barely existed before the crisis, was suddenly carrying one in five American mortgages. The federal government became the backbone of American lending almost overnight.
Borrowers changed too. They stopped buying homes and started refinancing just to survive. 2.5x surge by 2012. Second mortgages, which were everywhere before 2008, collapsed from 16% of the market to 3.5% and never came back. By 2017, one in six Americans applying for a mortgage was still being denied. A full decade later.
Then recovery came. But not for everyone. Colorado was almost fully back. Half the country wasn't close. Same policies, same interest rates, and completely different realities depending on where you lived.
What we found isn't a recovery story. 2008 didn't just crash the market; it rebuilt it into something else entirely. And we mapped exactly what that looks like.

Log in or sign up for Devpost to join the conversation.