-
-
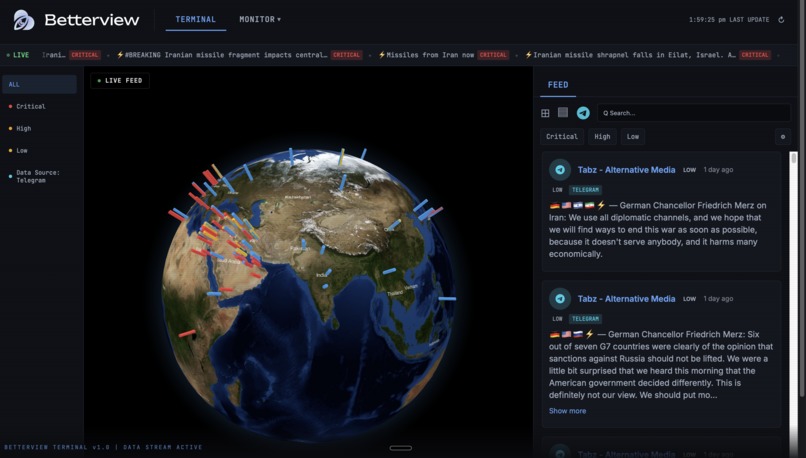
Terminal Section
-
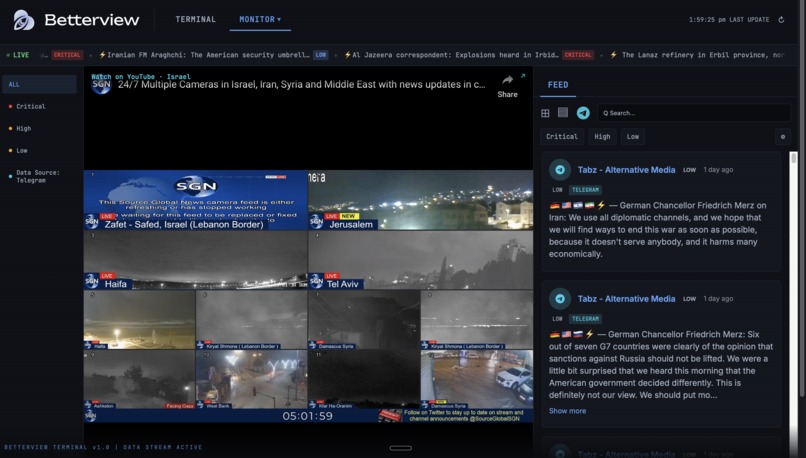
Monitor/Surveillance Section


Inspiration
I wanted to turn misconstruded, real-time conflict and crisis reporting into one place you can see and act on. News moves fast on Telegram and social media, but it’s hard to see where things are happening and how urgent they are. We were inspired by live maps and news tickers to build a single dashboard that shows what’s happening, where, and how severe.
What it does
The platform maps Telegram signals on a 3D globe using geolocated coordinates. Points are color coded by severity levels of critical high or low. A live sliding bar displays headlines that link to source posts, as well as a feed section in the terminal that displays telegram messages about intricate details happening around in global events. There is monitor tab provides embedded YouTube streams from Ukraine Israel and Iran to show surveillance on what is going on in those specific countries (due to rising global tension as of now). A sidebar feed maintains synchronisation with the globe using Supabase.
How we built it
The Python pipeline uses Telethon for scraping and spaCy for named entity recognition. Geopy converts place names into coordinates. The backend uses Supabase for storage and real time updates. The frontend is built with React and TypeScript using react globe gl for the 3D visualisation.
Challenges we ran into
Messages frequently mention several countries at once. I implemented logic to select one primary location based on proximity to keywords so stories do not appear as duplicates. I had to disable default library labels to prevent UI clutter. Designing the scrolling live bar to pause when hovered while receiving real time updates required balancing CSS animations with data state.
Accomplishments that we're proud of
The system functions as a unified data architecture where one scrape updates all UI components simultaneously. I successfully removed duplicate event markers across the globe. The fully automated pipeline processes raw Telegram data into a live intelligence dashboard without manual input.
What we learned
I learned the methods to geolocate and deduplicate news through named entity recognition and geocoding. The project taught me how to integrate Telethon with Supabase Realtime for low latency frontend updates. Also with refined UI details like the sliding bar speed and hover states to ensure the dashboard remains usable during high volume events.
What's next for Betterview
Integrating X and RSS feeds to minimise platform bias and also providing whether information is valid and reuptable. A donation/relief section will provide vetted links for humanitarian donations in affected regions. Future updates include regional heat maps and 2D map views to improve data accessibility.
Built With
- css
- geopy
- html
- javascript
- python
- react
- spacy
- supabase
- telethon
- three.js
- typescript
- vite
- youtube


Log in or sign up for Devpost to join the conversation.