Inspiration
Small businesses run on a handful of raw inputs, and when those prices move they're the last to know. A café sets menu prices for the season, then watches coffee and dairy climb. A shop quotes a job weeks out and eats the difference by the time it buys the material.
Big companies have procurement teams for this. Smaller ones have an invoice and a gut feeling. The information exists — it's just scattered across sources written for traders, not for someone running a business with twelve employees. We wanted to build the version that's for them.
The data backs it up harder than we expected. In a July 2026 survey of 456 US manufacturing facilities, raw material price volatility was the #1 driver of rising costs at 26%, ahead of labour at 21%. A Q2 2026 survey found 83.1% of manufacturers naming raw material costs their top business challenge, up from 57.5% the quarter before. And the segment worst hit was metal formers — exactly the shops we built this for.
The mechanism that hurts isn't the price increase. It's the lag: shops can usually pass costs through, but it takes weeks of negotiation, and that delay is where the margin goes. We shorten the delay.
What it does
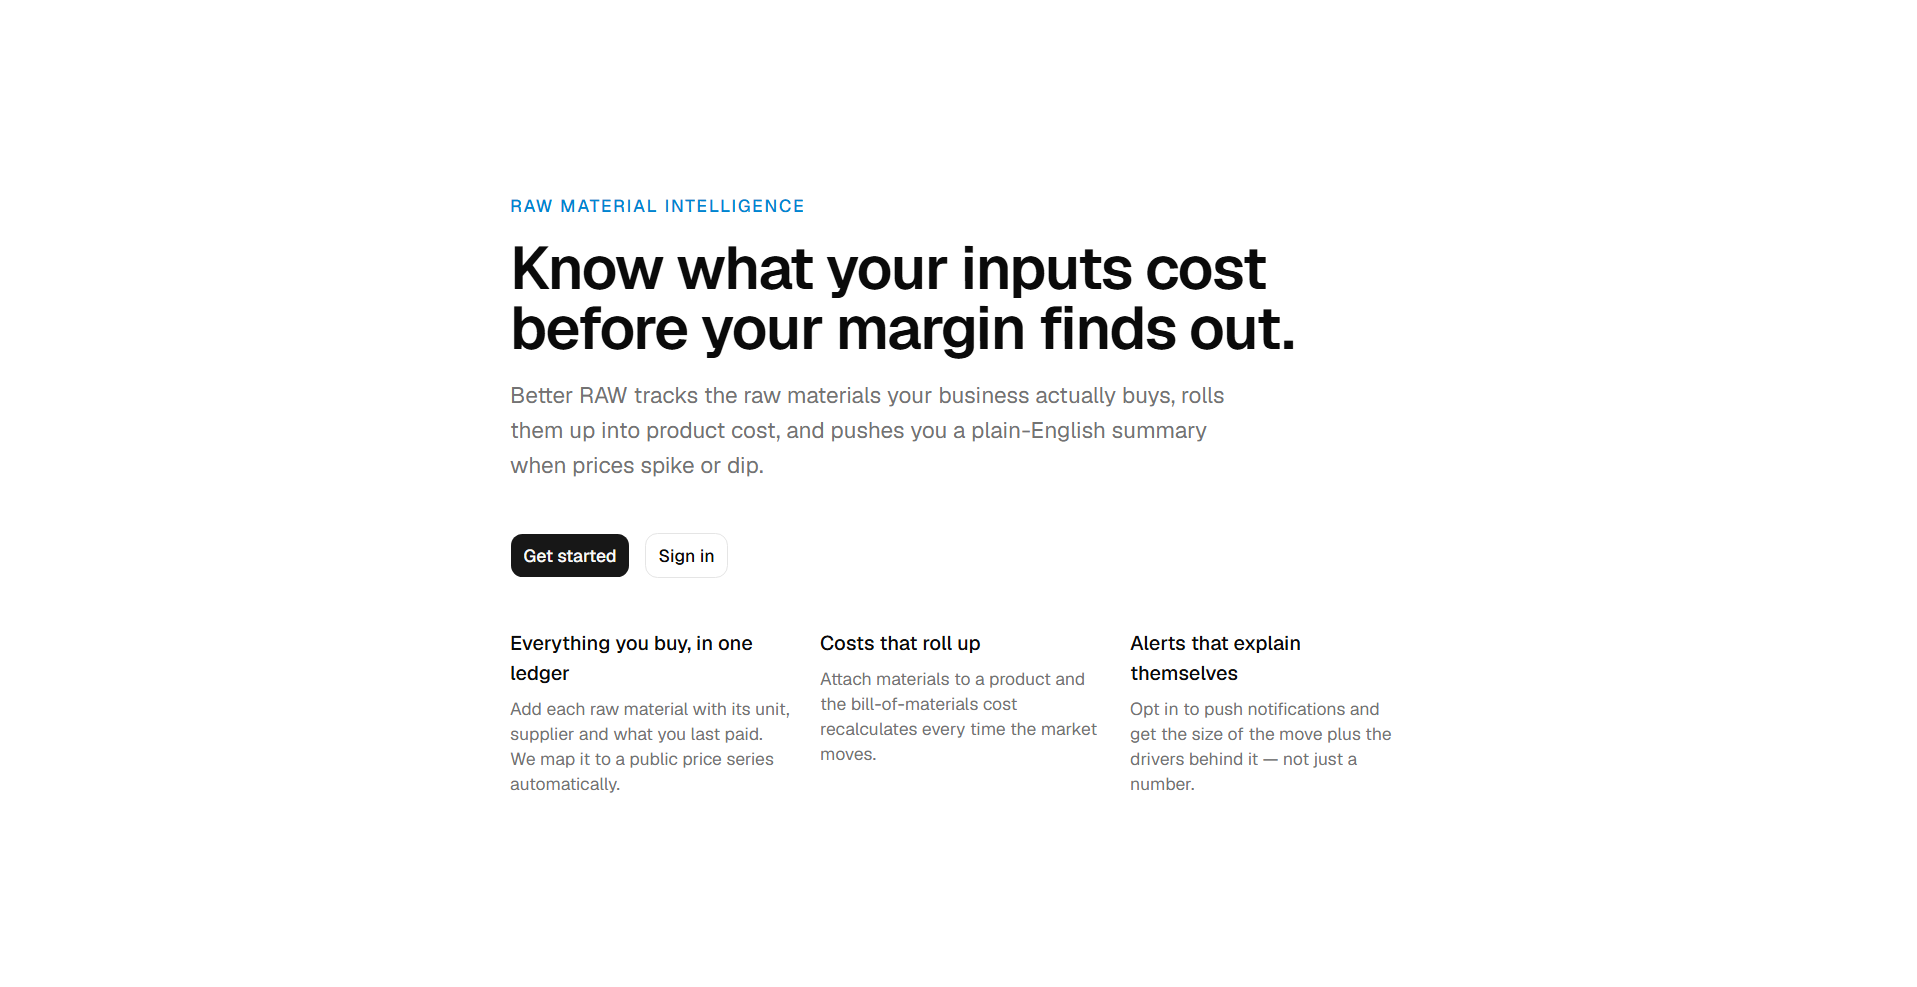
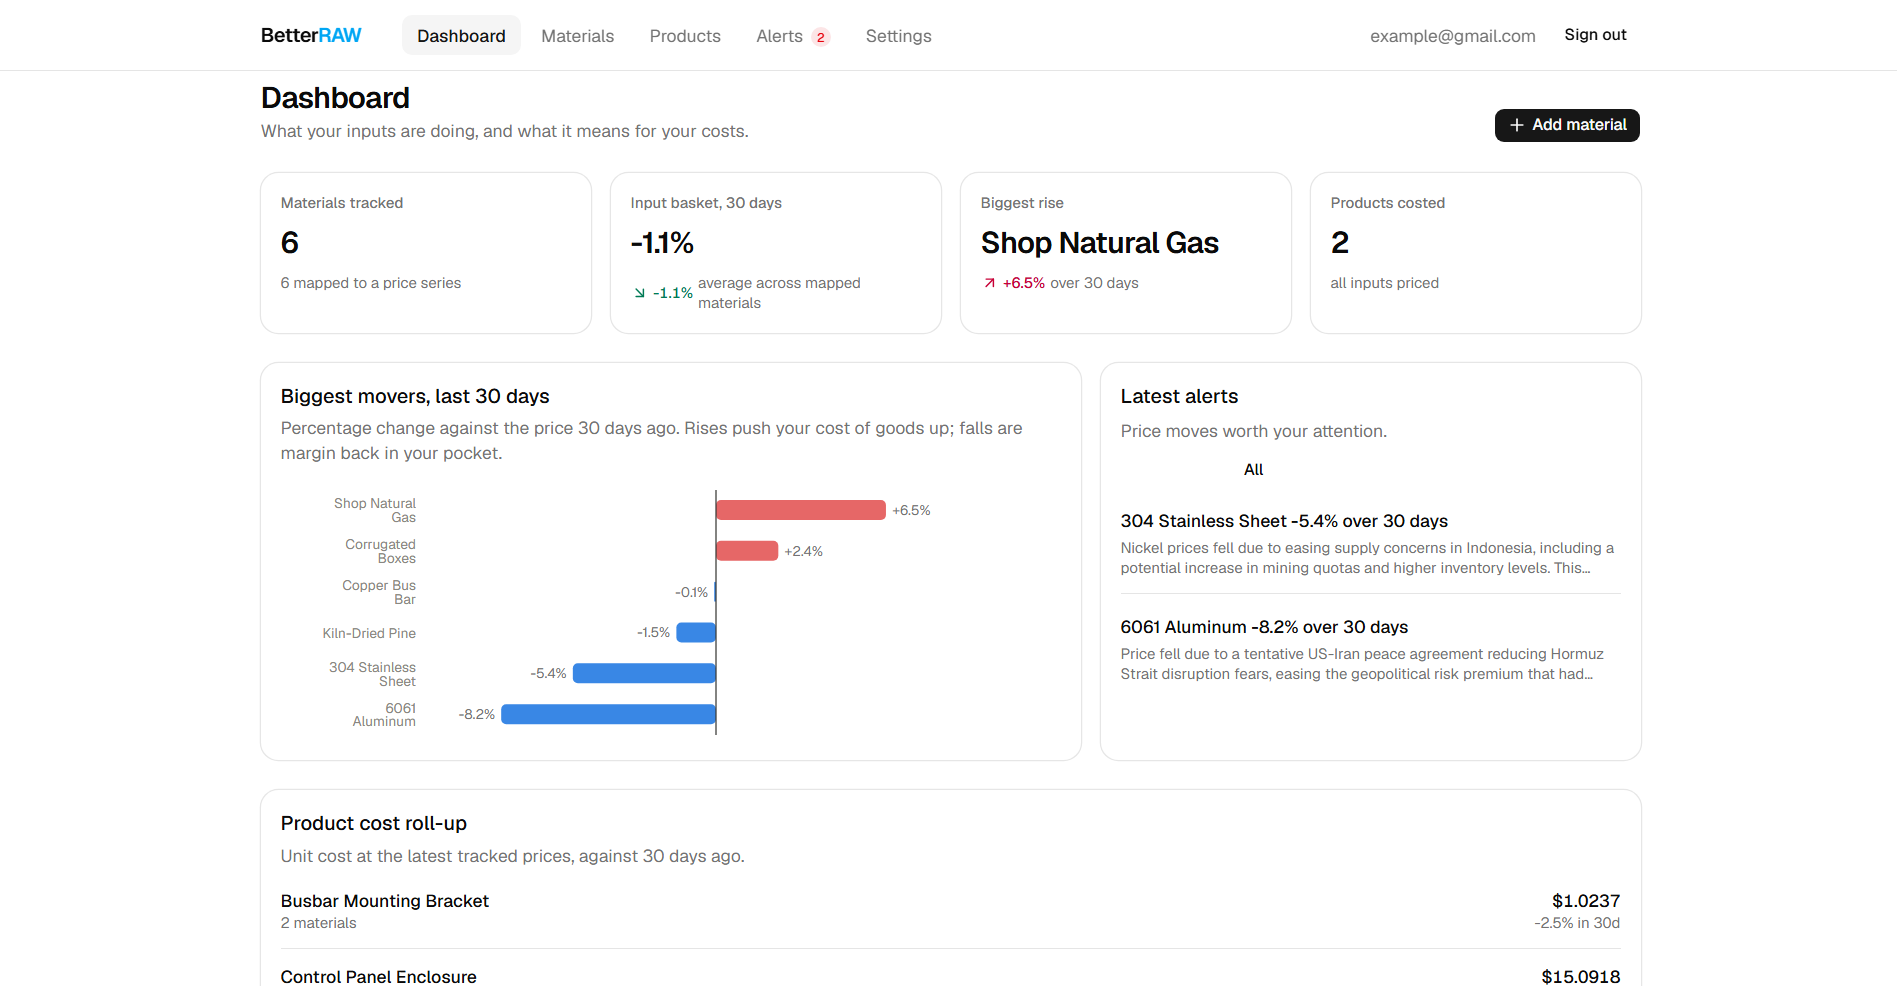
Better RAW is an installable dashboard that tracks what your raw materials cost and pushes a plain-English alert when prices move.
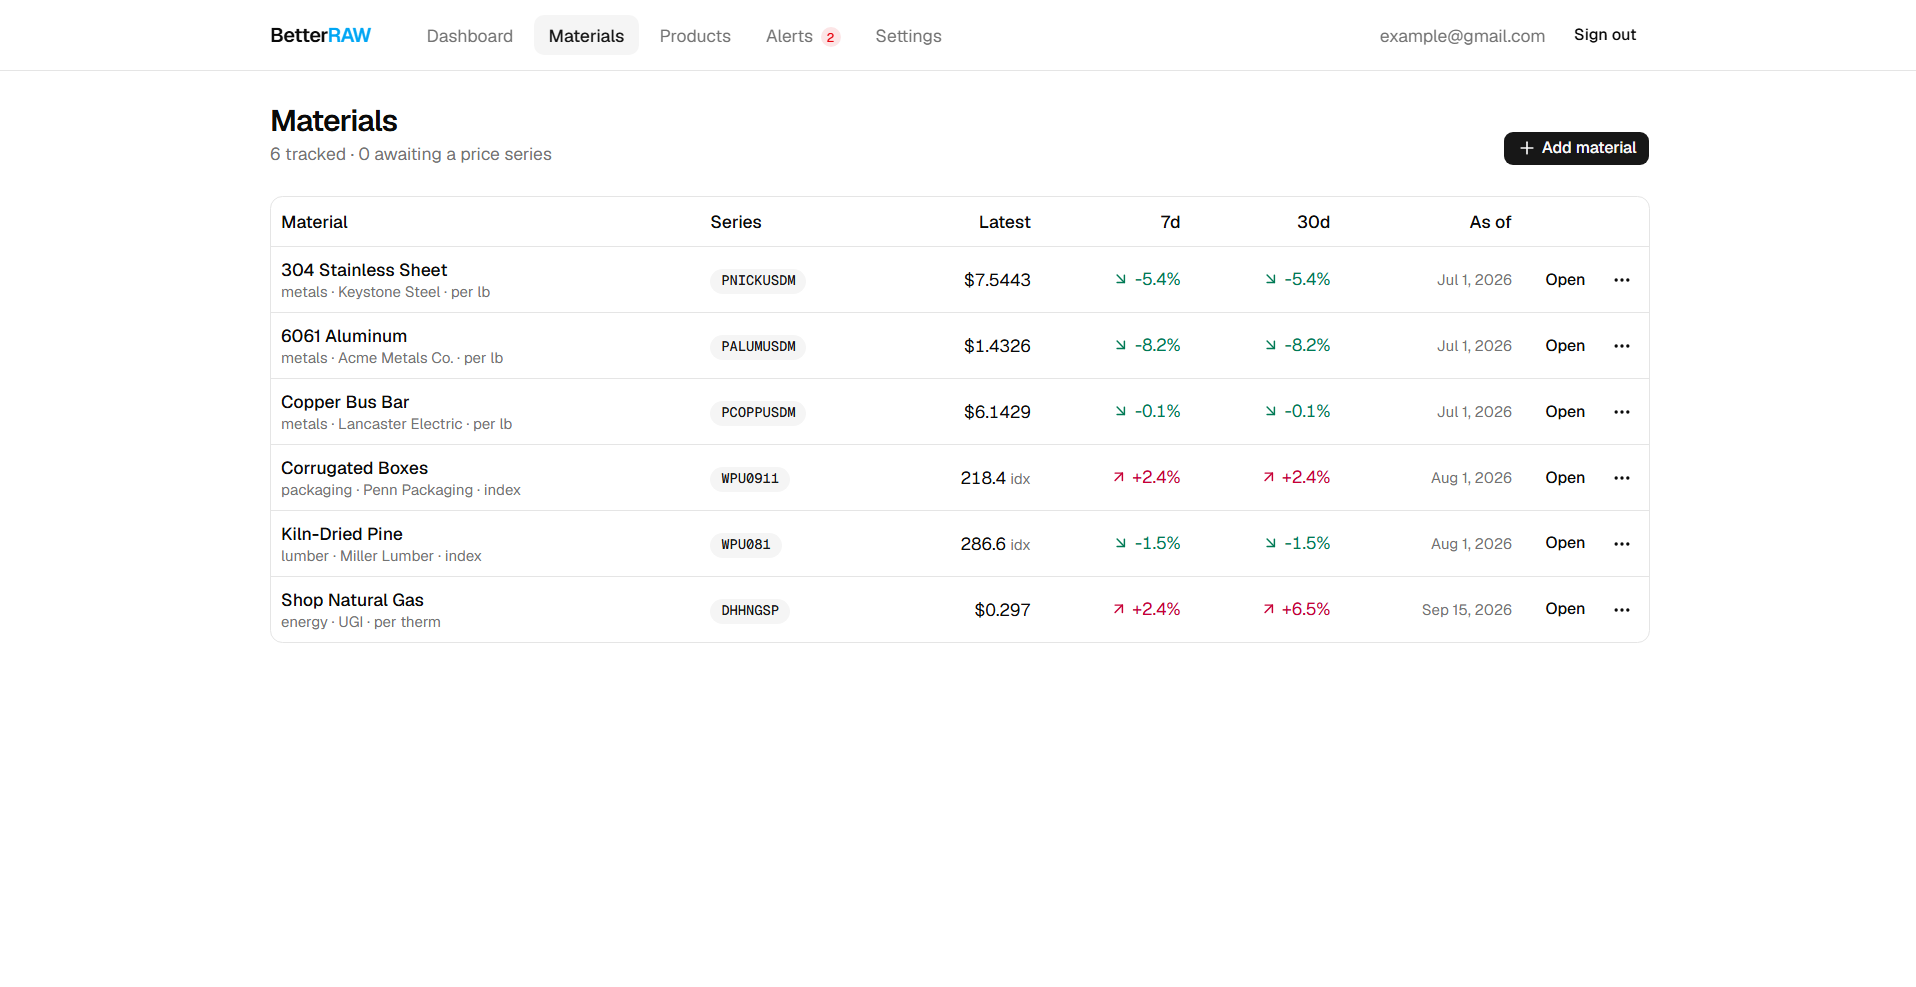
- Add your materials with your unit, supplier and what you currently pay
- We map each one onto a public FRED price series and backfill six years of history — converted into your purchasing unit, not FRED's
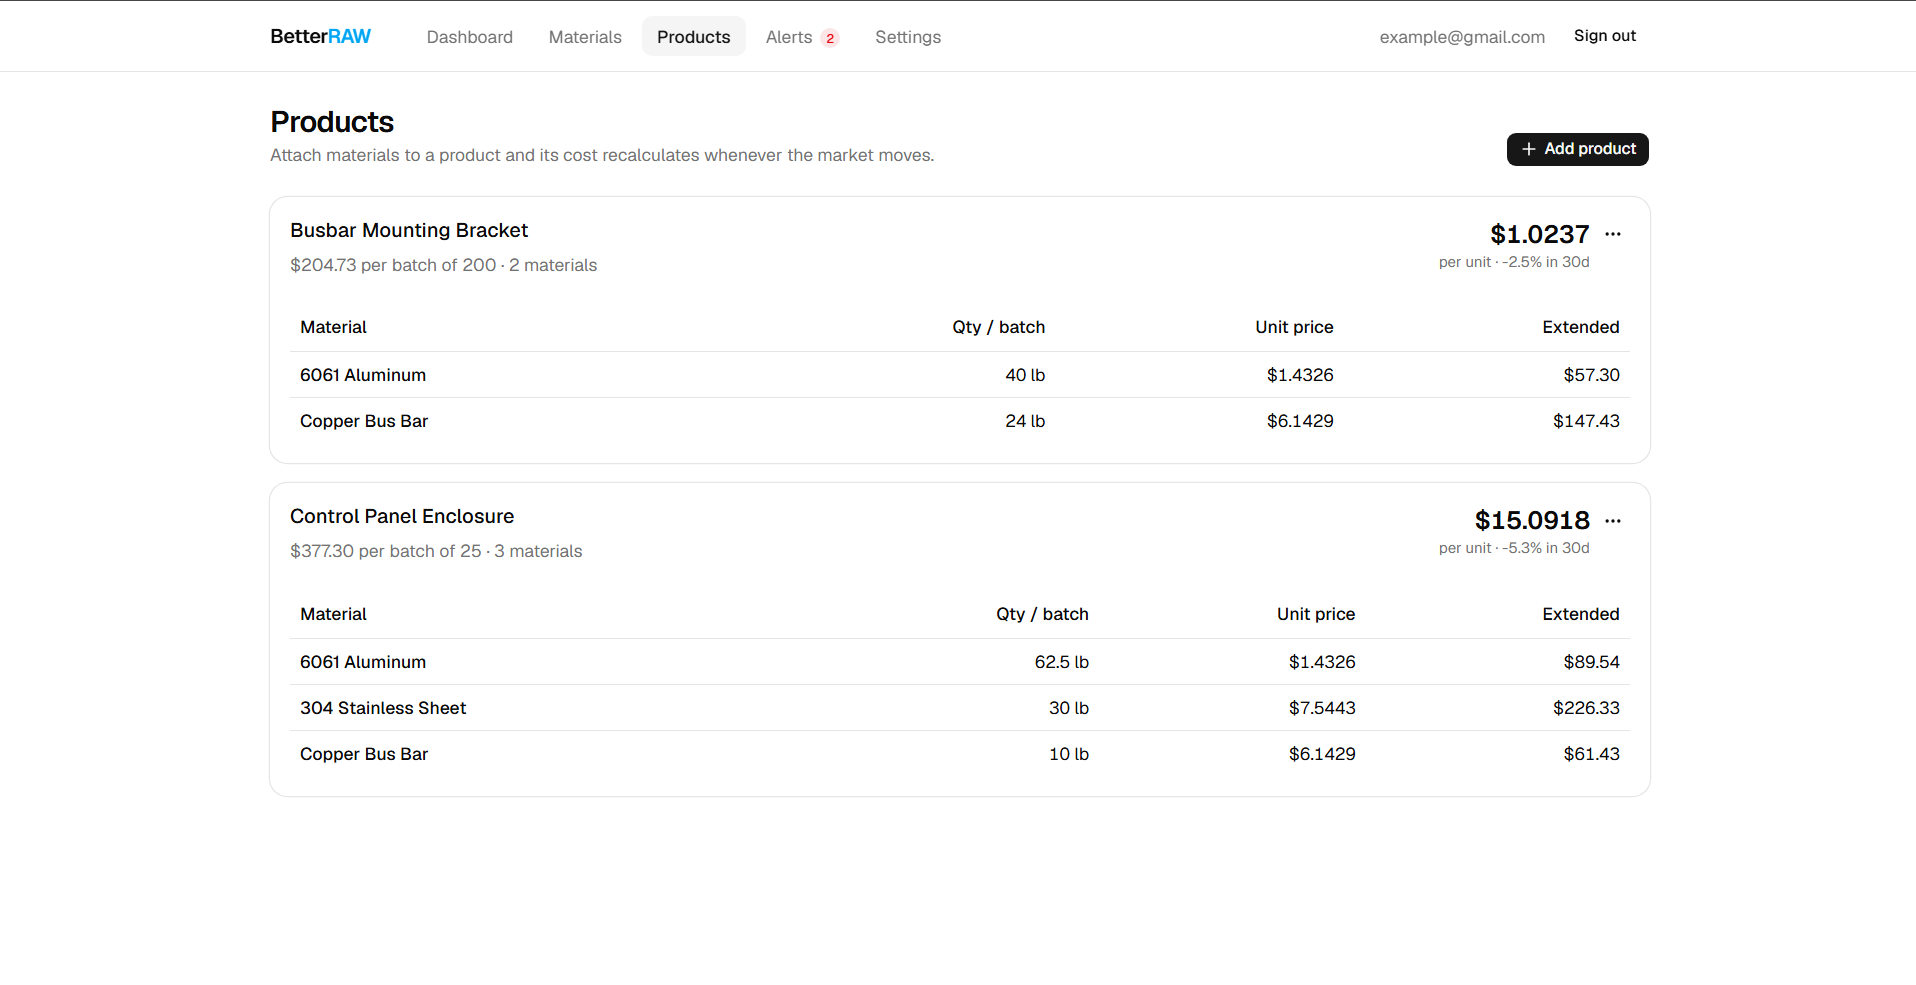
- Attach materials to a product and its unit cost recalculates automatically
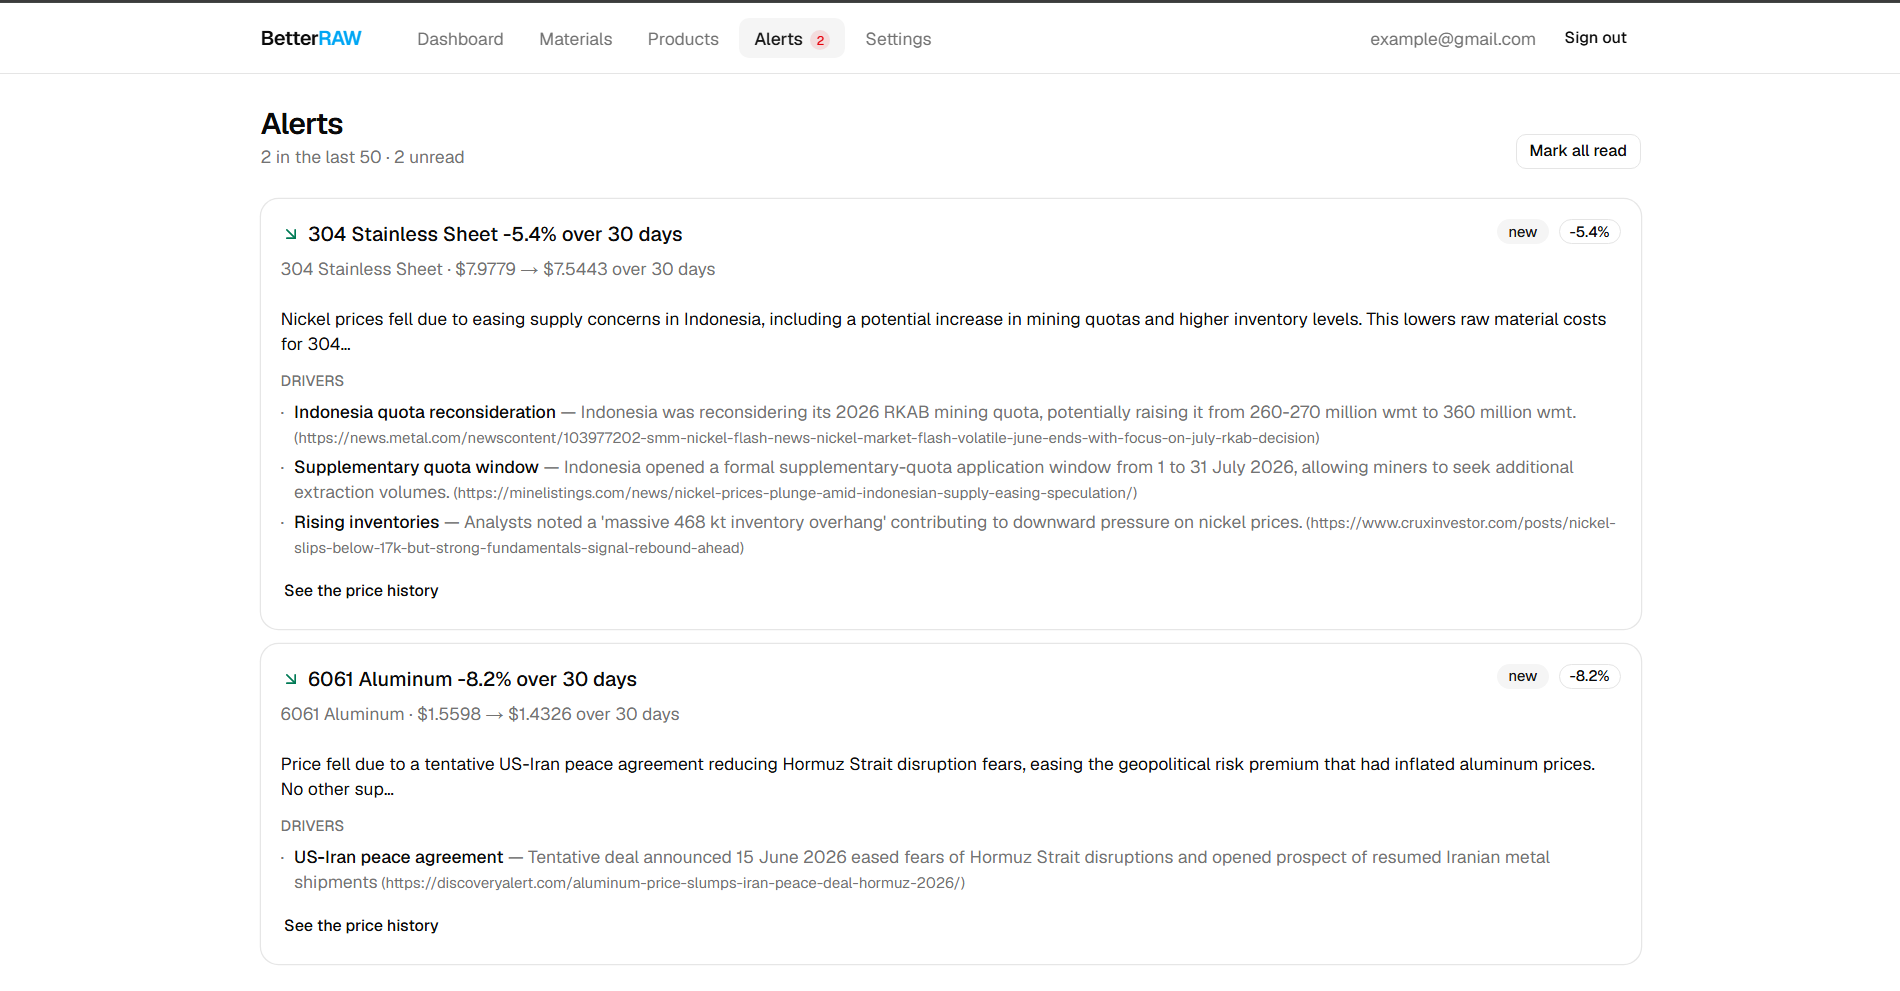
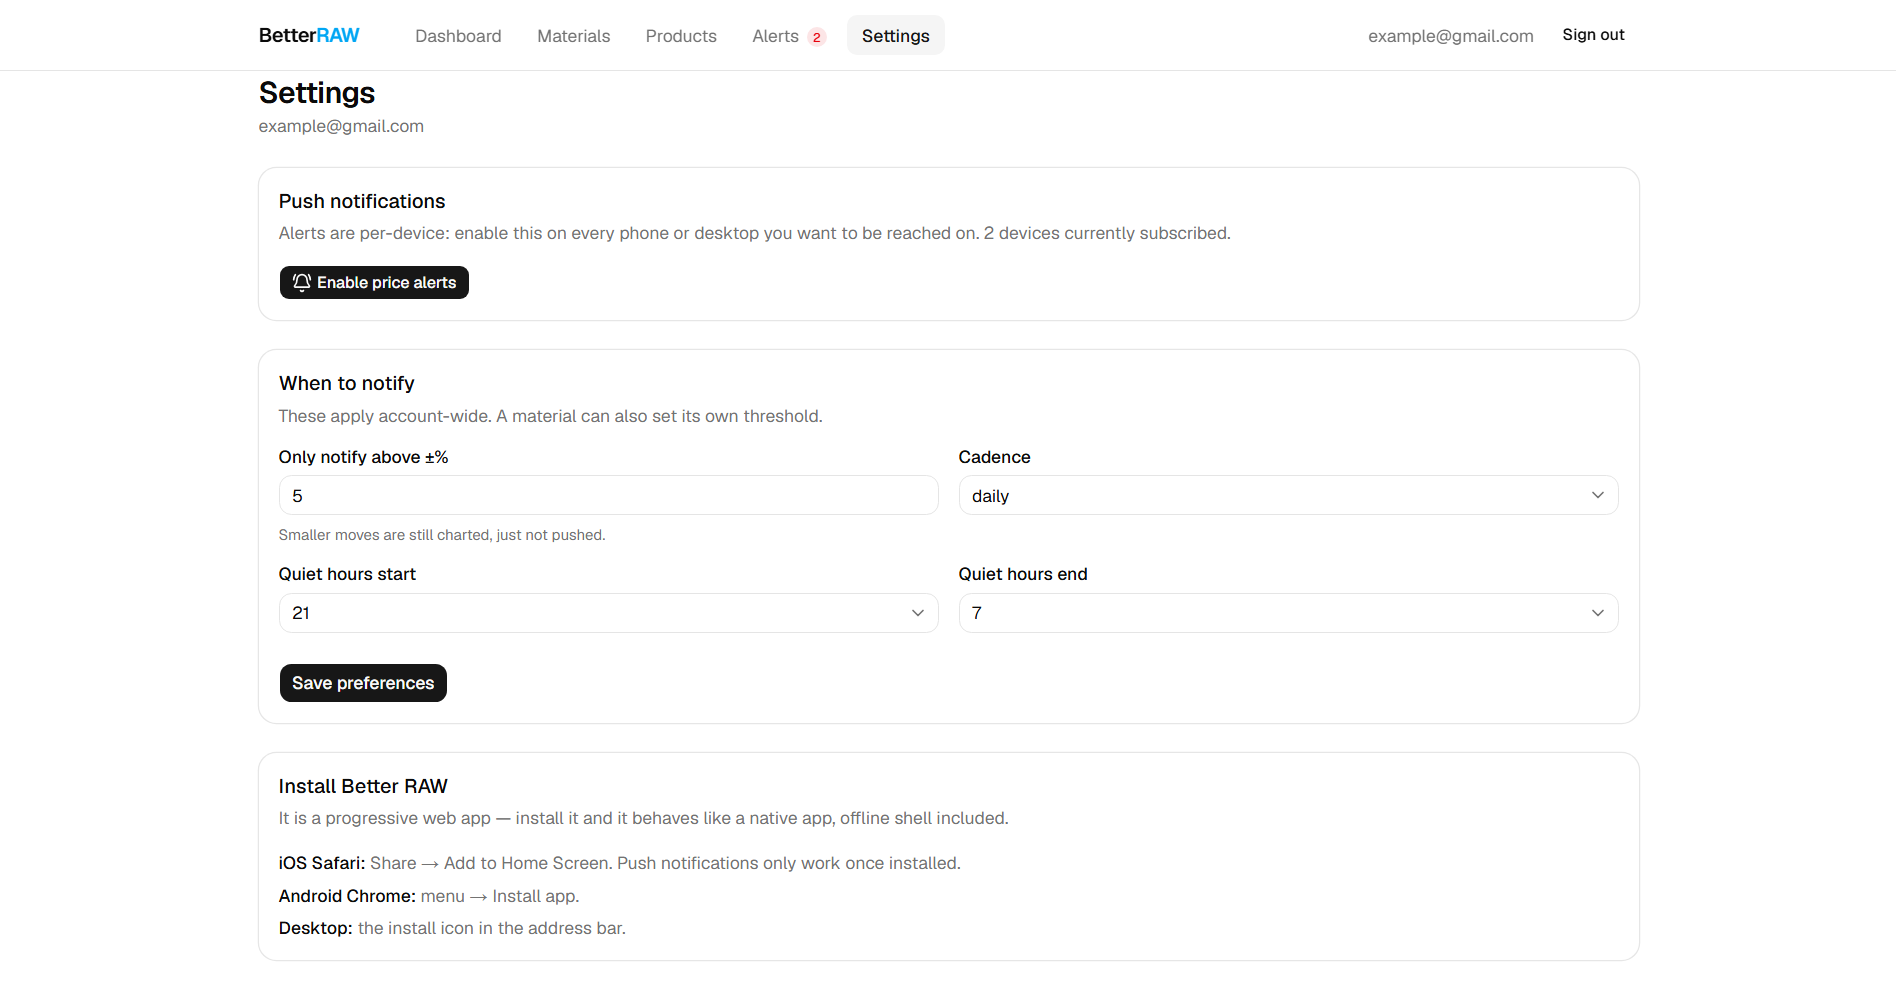
- When a price breaches your threshold you get a push notification with the size of the move and what caused it, each driver linked to a source
*A real alert from our live database: *304 Stainless Sheet −5.4% over 30 days — $7.9779 → $7.5443 Nickel prices fell due to easing supply concerns in Indonesia, including a potential increase in mining quotas and higher inventory levels. *Indonesia quota reconsideration — reconsidering its 2026 RKAB mining quota, potentially raising it from 260–270 million wmt to 360 million wmt. [source] *Rising inventories — analysts noted a 468 kt inventory overhang pressuring nickel prices. [source] Those source links go to real articles. That's not incidental — see below.
How we built it
Next.js 16 and Tailwind on the front, Supabase (Postgres, auth, row-level security) for data, and a Python worker on a scheduled GitHub Action doing ingestion. Prices come from FRED. Alerts go out over web push with VAPID. Cost roll-up is a SQL view rather than application code.
The AI layer is NVIDIA Nemotron 3 Super through NVIDIA's OpenAI-compatible endpoint, doing three jobs:
- Classification with a gate — mapping messy names like "6061 aluminium extrusion" onto the right FRED series, with a calibrated confidence score
- Research — a tool-calling loop over web search to find what actually moved the market, then a schema-constrained pass writing the notification
- Query synthesis — answering free-text questions from the alerts and price history already in Postgres
The whole pipeline runs unattended on a cron schedule: map, sync, alerts, dispatch.
Challenges we ran into
Units. FRED quotes aluminum in dollars per metric ton; our users buy it by the pound. That's a ~2,200× error and it's invisible — it shows up as a plausible-looking wrong number in the cost roll-up. 50 lb of aluminum would read $157,900 instead of $71.63.
Every price is now normalized at sync time using hard-coded conversion factors. We deliberately did not let the model generate them, because a quietly wrong conversion corrupts every downstream figure with no symptom. Free correctness check: percentage change is invariant under a linear factor, so after converting, the aluminum alert still read −8.2% — same as before.
Some materials have no price at all. Lumber, corrugated, steel plate and five other common inputs only have a Producer Price Index on FRED — a relative level with no dollars attached. 9 of our 29 catalogue series are like this. An index tells you a material moved 8%; it gives you no figure to multiply by a quantity. So we flag those materials, display them as index points rather than dollars, and count them as unpriced in cost roll-ups instead of inventing a number.
No hosted search tool. Our first version leaned on a provider's built-in web search. Porting to Nemotron meant building it ourselves: a tool-calling loop over DuckDuckGo, with a round-trip cap so a chatty model can't spin forever, and the tool dropped on the final turn so it has to write up.
Accomplishments that we're proud of
The alerts explain themselves, and the explanations are checkable. Anyone can compute a percentage change. The hard part is naming the smelter outage behind it — and then proving you didn't make it up.
We were disciplined about being wrong. If the model isn't confident enough about a mapping, we leave the material unmapped rather than track the wrong index. If the research doesn't explain a move, the notification says the cause is unclear rather than inventing a macro story — we have one of those in the database and it's our favourite row. Showing nothing beats showing something wrong when someone's making purchasing decisions off it.
The app admits its own limits. 304 stainless has no series of its own, so it's tracked against nickel — one of its inputs. That's a proxy, and nickel moves roughly ten times as far as the sheet does. The mapping came back at 0.70 confidence versus 0.95 for aluminum, and the material page says so in the buyer's own terms: "Global price of Nickel measures an input to 304 Stainless Sheet rather than the material itself, so it moves further and faster than your invoice will."
What we learned
Know which parts of your system should be smart and which should be dumb. The judgement calls — what series matches this material, what caused this move — are exactly what an LLM is for. Unit conversion is not; it needs to be boring and deterministic. Most of our real bugs came from blurring that line.
Gate on the number, not the explanation. Nemotron mapped 6061 Aluminum correctly twice, and both times invented the reason: "its description includes the 6061 alloy qualifier." It doesn't — the series is titled "Global price of Aluminum." Right answer, fabricated justification, 0.98 confidence. So the pipeline gates on the confidence score and treats the prose as commentary. A bogus rationale can't corrupt the data.
Retrieval fixes what a model knows, not how it reasons. In one research pass it correctly quoted falling LME inventories and then called them bearish. Falling inventories are conventionally bullish — tighter supply. Real fact, correct citation, backwards conclusion.
A confident description of a safeguard is not the safeguard. Most of this was built with AI assistance. At one point the citation verification above was designed, reviewed and documented — and the file was never saved to disk. What shipped was three places in the codebase confidently describing a safeguard that didn't exist, including a system prompt telling the answering model that a source meant one had been verified. An independent review caught it by grepping for the function name and finding nothing. That's the same failure as the fabricated mapping rationale, one layer up.
Swapping model providers is never just swapping a client. Structured output, reasoning controls and tool availability all differ, and that's where the work is.
What's next for Better RAW
- Real market research. Talking to potential consumers to get a better handle on real world viability and demand.
- Supplier invoice import, so you can see the spread between the market price and what you're actually paying
- A usable cost basis for index-only materials: anchor the buyer's own baseline price and let the index move it, turning a relative series into something you can multiply
- Forward-looking alerts — flagging the risk before the move, not after
- More price sources beyond FRED, especially for materials with no good public series
- Purchase-timing suggestions: given your usage rate and the trend, buy now or wait
Built With
- duckduckgo
- github-actions
- nemotron
- next.js
- nvidia
- postgresql
- pwa
- python
- recharts
- shadcn
- supabase
- tailwind
- typescript
- vapid
- vercel

Log in or sign up for Devpost to join the conversation.