-
-
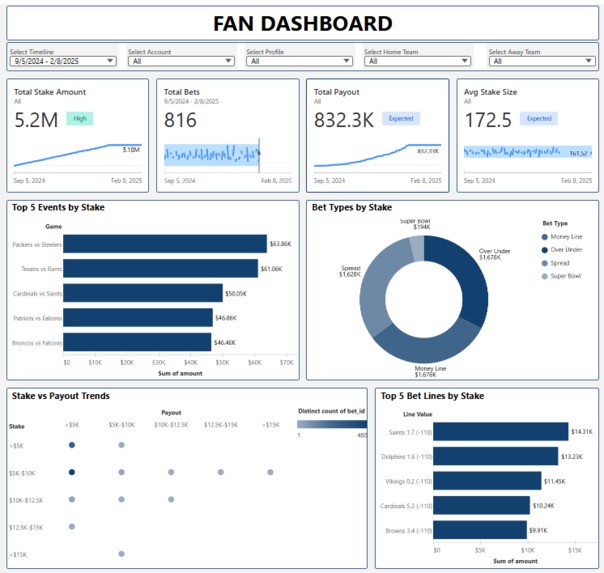
Fan View
-

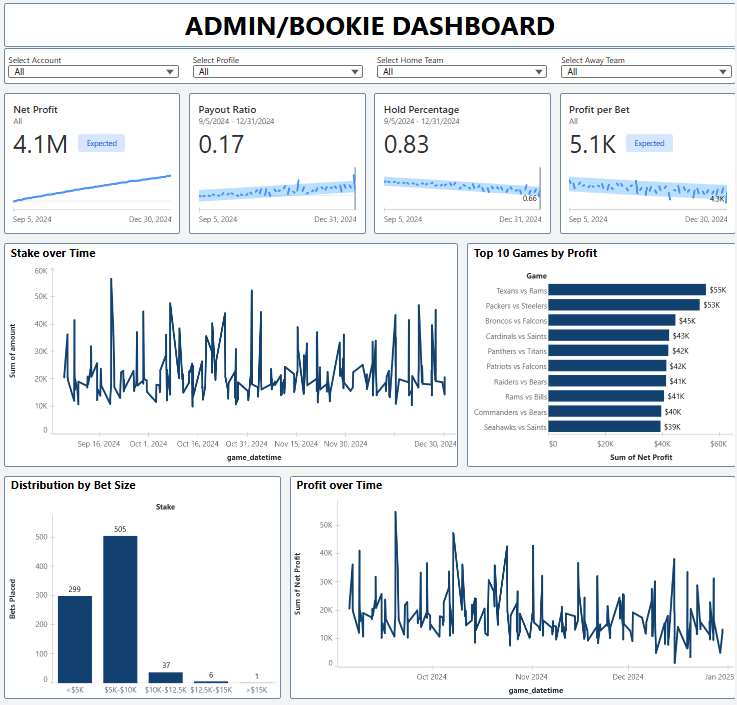
Admin View
-

Thumbnail


Project Story: BetSense
Inspiration
As sports fans ourselves, we’ve often looked at betting platforms and wondered:
- Where are most people putting their money?
- Which outcomes actually pay out more often?
- How can I make a smarter choice before placing a bet?
At the same time, we realized bookies need the exact opposite perspective; they worry about payouts, profitability, and exposure.
That’s when the idea clicked: why not build a dual-view dashboard that serves both sides of the story?
BetSense was born to empower fans like us with insights to bet smarter, while also giving bookies a clear view of their risk and revenue.
What We Learned
- Betting data can look messy, but with the right semantic model, it becomes a powerful story.
- Even with the same dataset, fans and bookies ask very different questions: designing for both taught us a lot about user-centered thinking.
- KPIs like Net Profit, Exposure, Stake Distribution, and Payout Ratio are not just numbers, they represent confidence and decision-making power for the people using them.
How We Built It
- Semantic Model: Defined core entities. Events, Bets, Outcomes, and Transactions — to capture how bets flow from fans to payouts.
- Fan View Dashboard:
- KPIs: Total Stake, Number of Bets, Avg Stake, Total Payouts
- Charts: Top Events by Stake, Stake Distribution by Outcome, Historical Payouts, Bet Volume by Time
- Goal: Help a fan see trends and decide which event and outcome might be worth betting on.
- KPIs: Total Stake, Number of Bets, Avg Stake, Total Payouts
- Admin (Bookie) View Dashboard:
- KPIs: Net Profit, Payout Ratio, Avg Profit per Bet, Highest Exposure
- Charts: Stake Over Time, Bets by Weekday, Bet Size Distribution, Exposure by Outcome
- Goal: Help bookies understand where they make money, where they risk losses, and how betting behavior changes over time.
- KPIs: Net Profit, Payout Ratio, Avg Profit per Bet, Highest Exposure
Challenges
- Making odds human-friendly: Decoding line values (like -110, +108) and spreads (like -3.5) was harder than expected, but critical for telling the betting story.
- Too many ideas, too little space: We had to cut down to the most impactful KPIs and charts that could fit cleanly into one dashboard each.
- Design balance: We constantly had to ask ourselves, Does this insight help a fan? Or is it only useful for a bookie? That balance was tricky but rewarding.
Headline
BetSense: Smarter Insights for Fans, Sharper Decisions for Bookies
Future Work
- Add real-time odds updates so fans see the freshest data.
- Use predictive models to forecast likely outcomes and payouts.
- Personalize dashboards: fans could see recommendations based on their betting style, while bookies could flag risky outcomes faster.
Built With
- chatgpt
- crm
- datacloud
- excel
- llm
- python
- salesforce
- sql
- theoddsapi


Log in or sign up for Devpost to join the conversation.