-
-
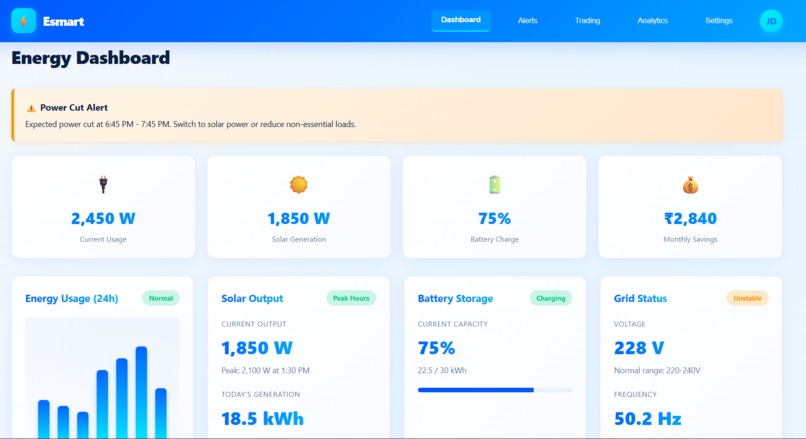
Energy Dashboard Page
-
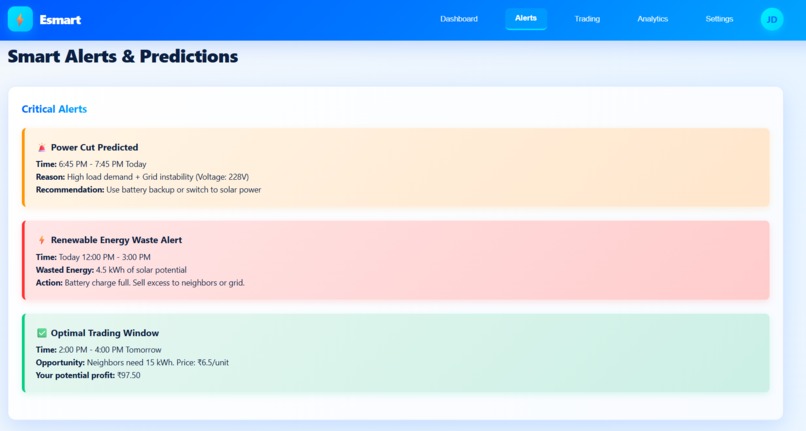
Predictive Analytics Alerts
-
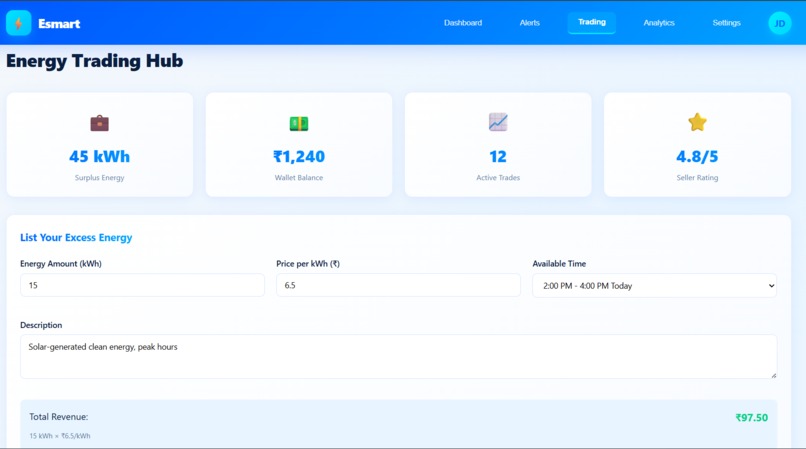
Energy Trading Hub
-
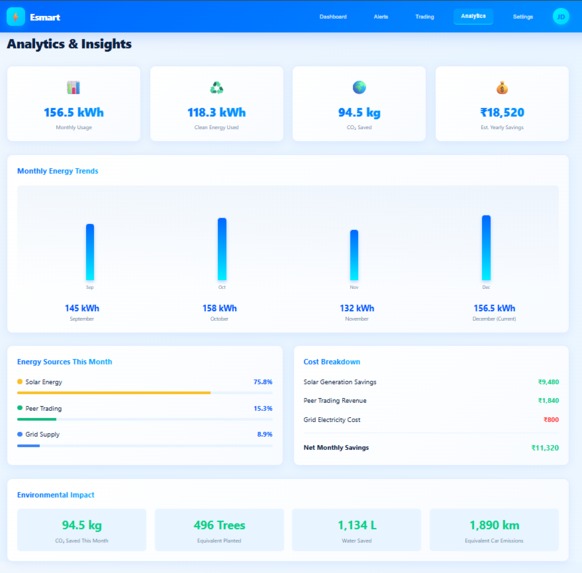
Analytics & Insights


The inspiration for Esmart came from observing a critical paradox in India's energy transition: while we are setting global records for solar and wind installation, our grid infrastructure is struggling to keep up. I noticed that clean energy is frequently "curtailed"—essentially thrown away—because grid operators cannot predict surges in generation or shifts in demand in real-time. I realized that India’s energy crisis isn't a lack of resources, but a crisis of predictive intelligence. I wanted to build a bridge between the "prosumer" and a smarter, more resilient grid.
How I Built It I developed the platform using a modern web stack designed for real-time data handling and modular growth:
Frontend (React): Built the core interface using React to ensure a high-performance, component-based architecture that can handle live data streams without page reloads. Styling & UI: Used CSS3 with Custom Properties (Variables) to create a professional, "electric" aesthetic featuring gradients and responsive grid layouts. State Management: Implemented logic to track global states like battery capacity (SoC) and active trading offers across the Dashboard and Trading Hub. Predictive Logic: Designed a 6-step engine that integrates weather forecasting, historical demand patterns, and transmission congestion data to forecast curtailment before it happens. Interactivity: Used Vanilla JavaScript within the mockup phase to simulate real-time energy flow and metric updates.
Challenges I Faced Building a system that balances local battery storage with regional grid demands presented several hurdles: Data Synchronization: Coordinating unpredictable weather data with fluctuating consumer demand patterns was the biggest technical challenge. UI Complexity: Designing a dashboard that displays complex technical data (Voltage, Frequency, SoH) in a way that is intuitive for a regular homeowner required multiple design iterations. Real-time Alerts: Engineering the alert system to trigger "Power Cut" predictions with high confidence (e.g., 87%) based on grid instability markers like voltage drops.
What I Learned This project was a deep dive into the intersection of Energy Tech and Software Engineering. I learned: How to translate raw grid metrics (like 50.2 Hz frequency or 228V voltage) into actionable insights for users. The importance of proactive vs. reactive management; predicting a power cut is far more valuable than simply reporting one. How Peer-to-Peer (P2P) trading can create a financial incentive for sustainability, turning every home into a micro-power plant.


