-
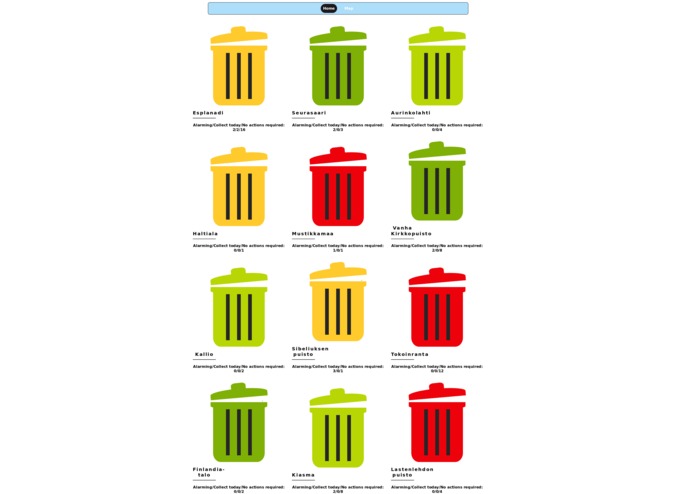
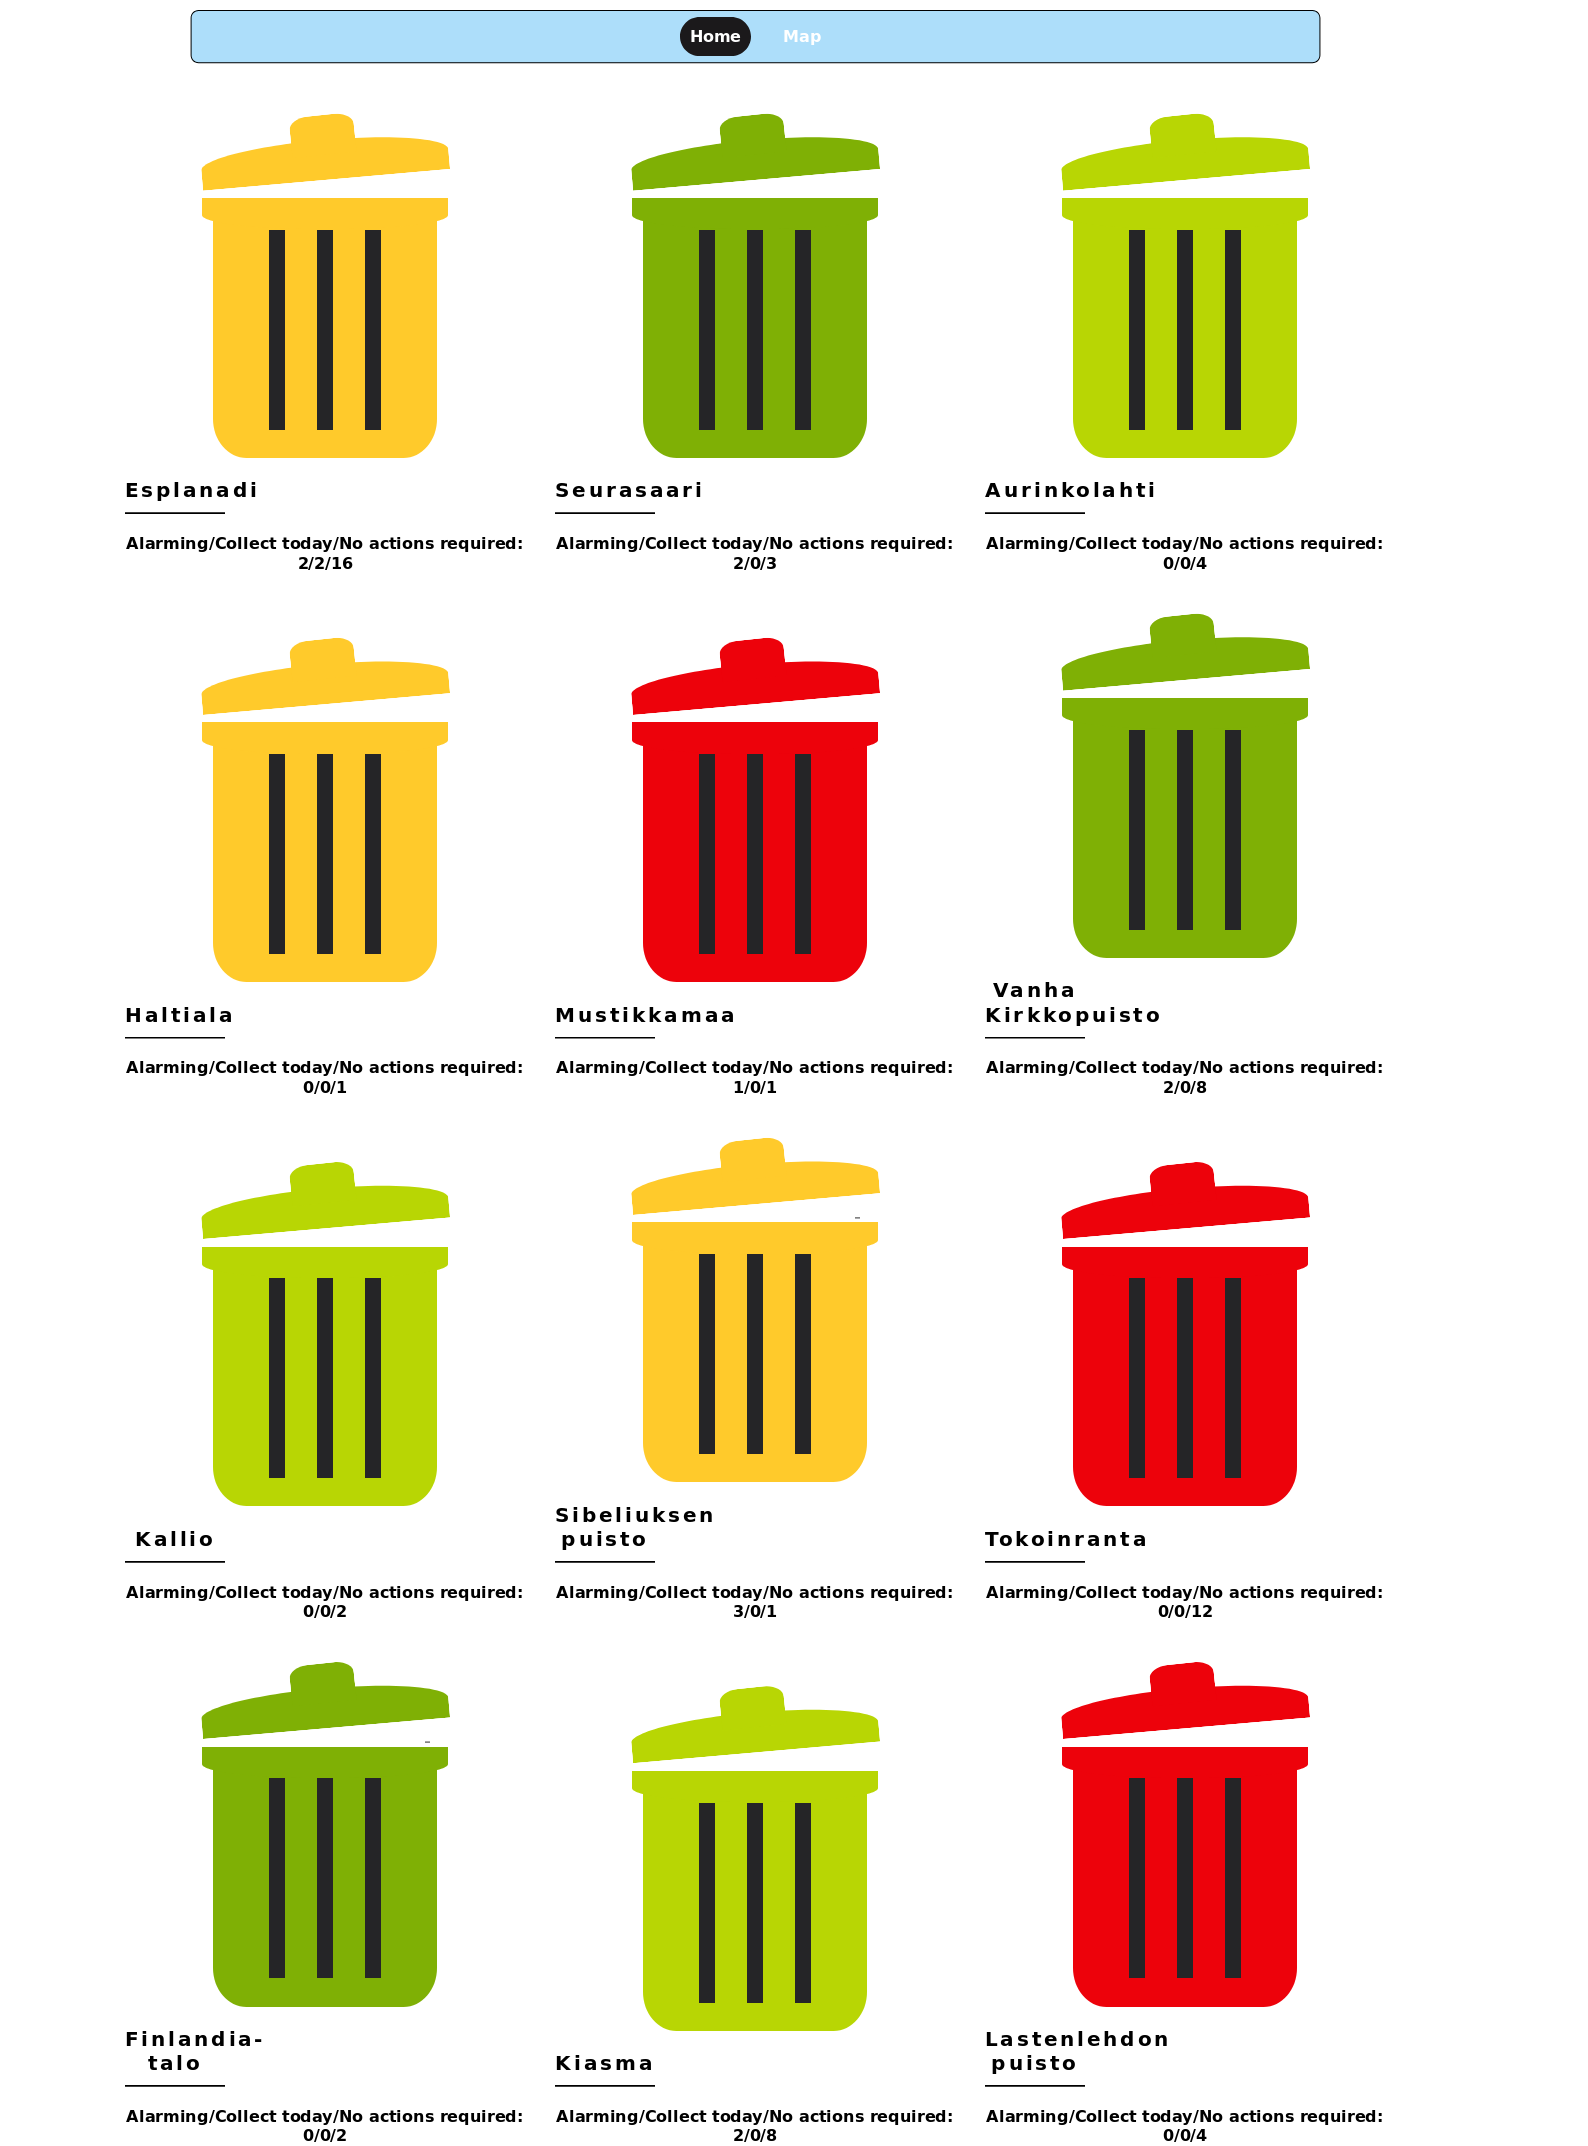
Main page
-
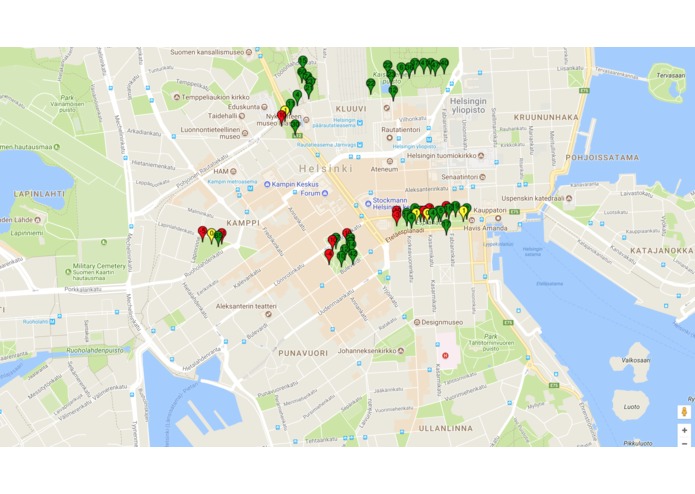
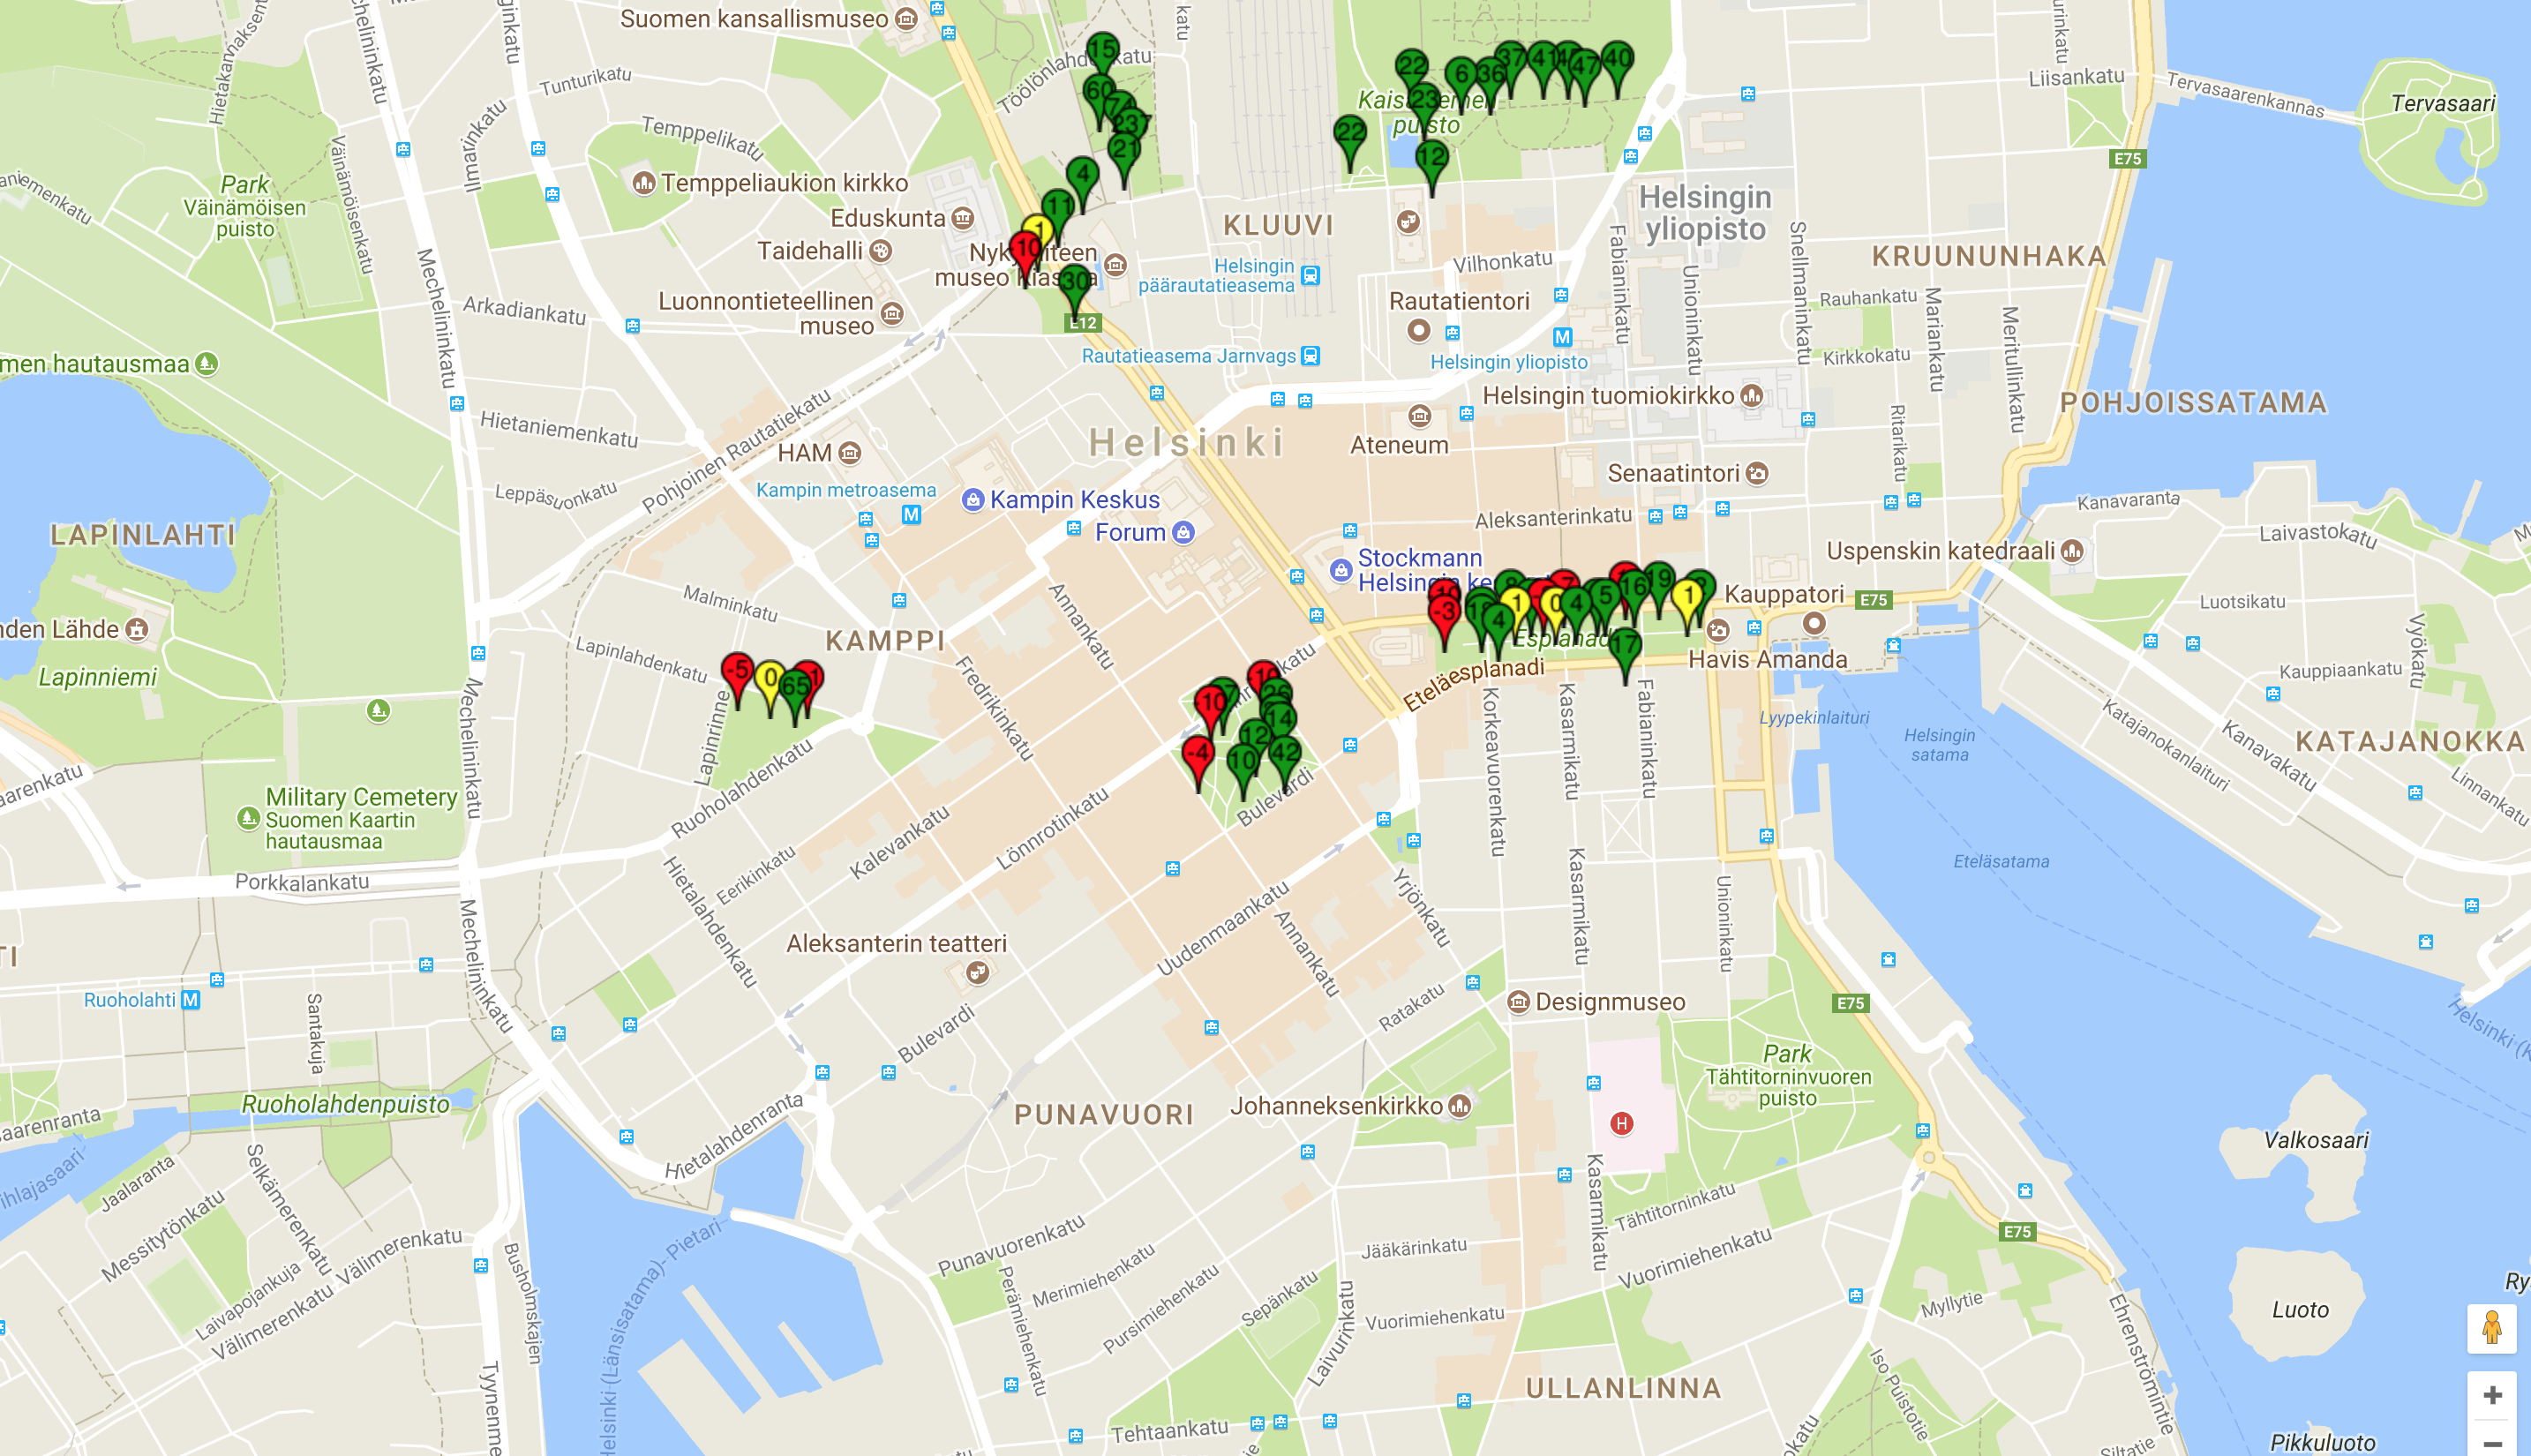
Map
Inspiration
It is waste of time to collect too empty Bellies, but on the other hand those can't be too full. Balance is somewhere between and there analytics is needed.
What it does
Maintenance dashboard shows status per each area. Based on that, maintenance department can see we it needs to act and where not. Fullness speed is predicted and that can be used to plan routes.
How we built it
Data from Smart Bellies were fetched using API. Data were analyzed and predictions were calculated. Output can be seen via tangible dashboard.
Challenges we ran into
Streetreboot 2
Accomplishments that we're proud of
Utilizing data insigths in order to improve city maintenance.
What we learned
Data can be utilized even if public field and potential is huge.
What's next for Belly Forecast
We want to iterate next features and put those in place: better UX and more accurate predictions
Built With
- css
- html
- ibm-spss-modeler
- javascript
- python
- r

Log in or sign up for Devpost to join the conversation.