-
-
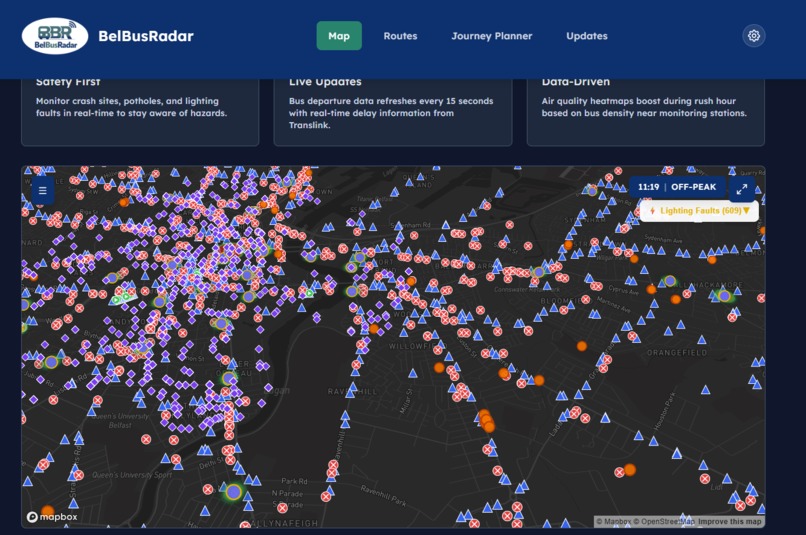
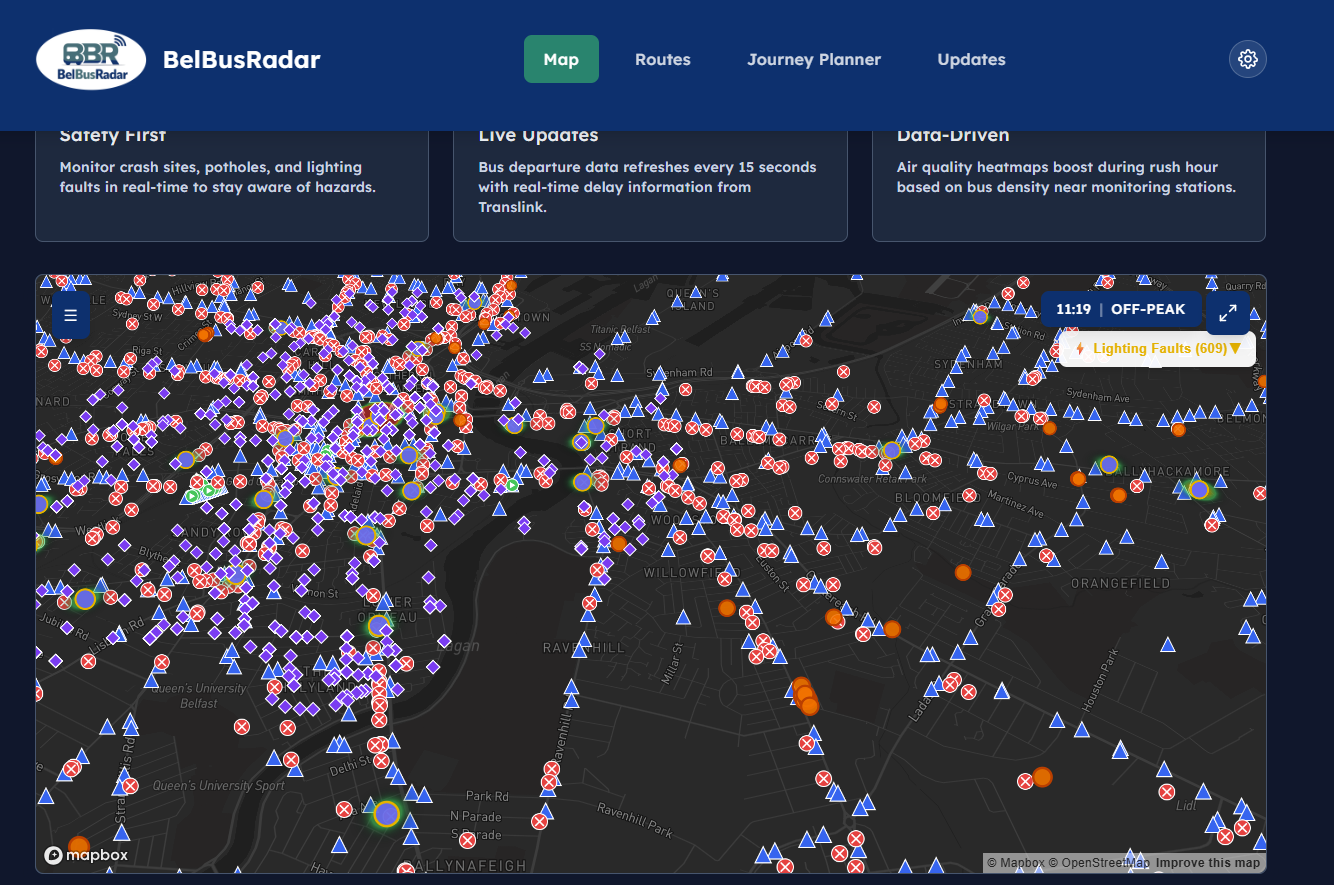
Map View
-
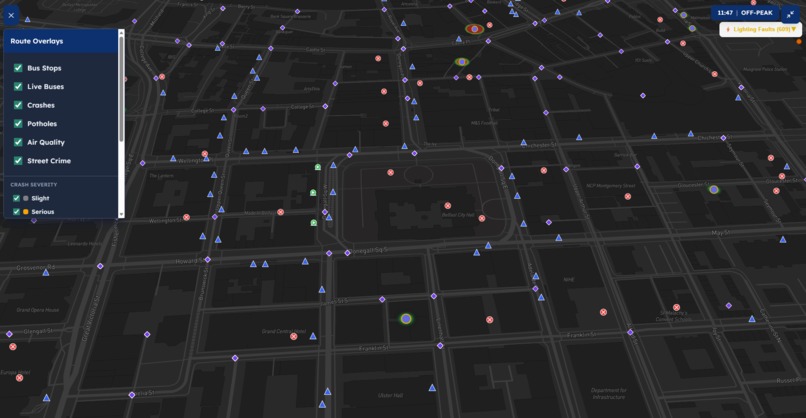
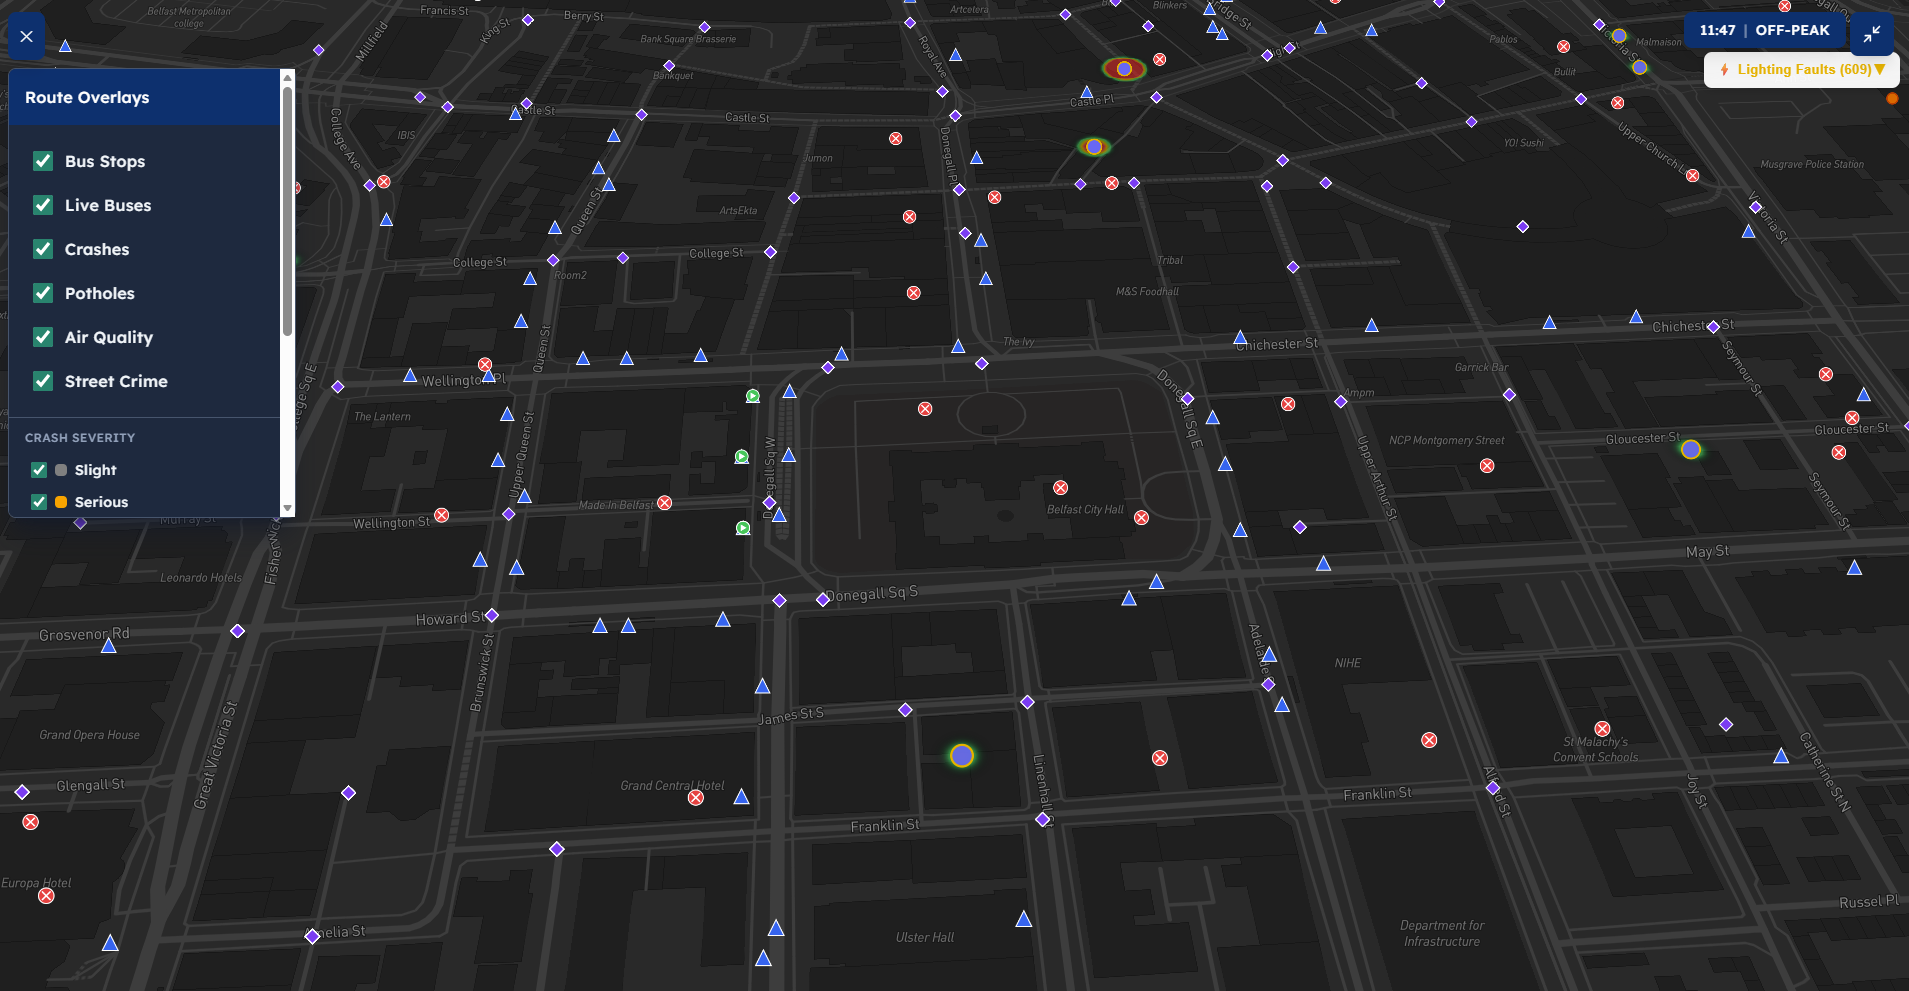
Full Screen Map View
-
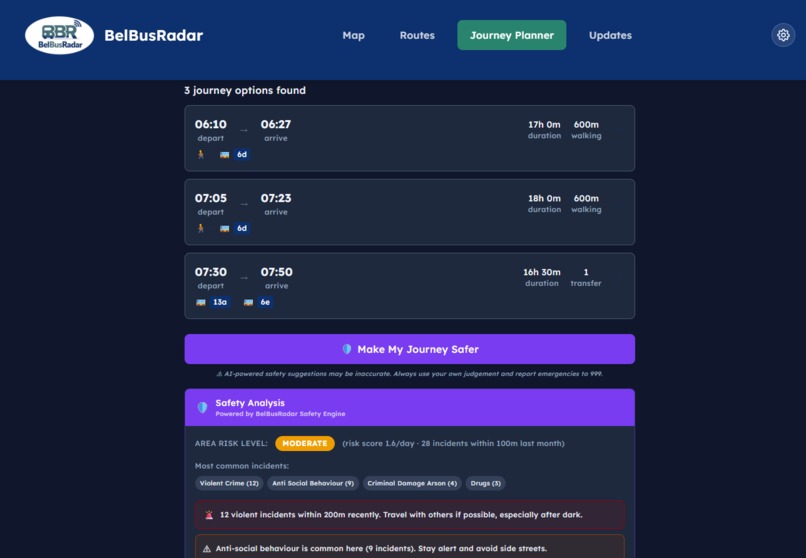
Smart Journey Planner
-
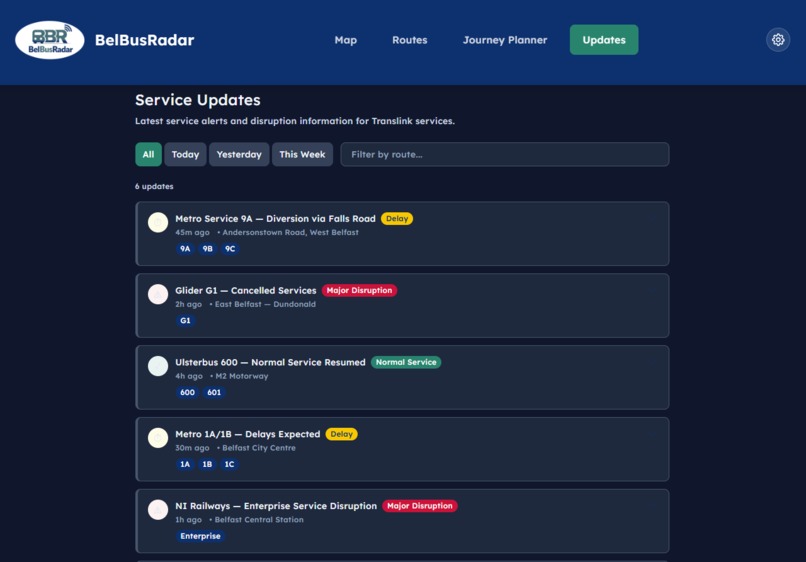
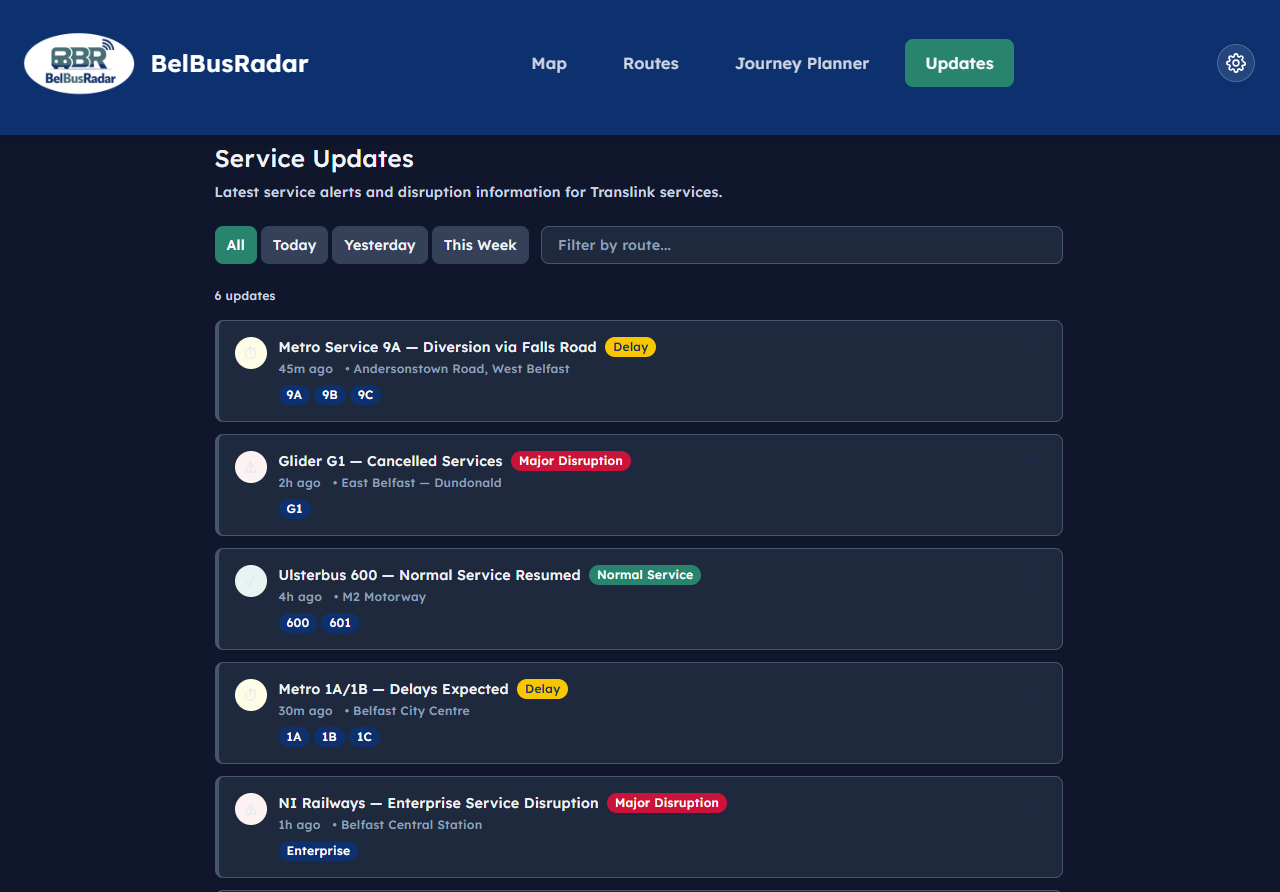
Journey Updates

Inspiration
As Belfast commuters ourselves, we were frustrated by needing 3+ separate apps just to plan a bus journey, check if it's on time, and buy a ticket. None of them show you safety information — crime hotspots, crash history, broken streetlights — things that actually matter when you're walking to a bus stop at night. We wanted to build the app we wished existed.
What it does
BelBusRadar is a real-time interactive map dashboard that combines live bus tracking, journey planning, route exploration, service updates, and AI-powered safety intelligence into one unified platform. It overlays 6 live data sources onto an interactive Mapbox map — bus stops, live moving buses, traffic crashes, potholes, street crime, and air quality. The "Make My Journey Safer" feature analyses real PSNI crime data within 100m of your route using weighted severity scoring to generate contextual safety tips.
How we built it
- Frontend: React 19 + Vite + Tailwind CSS with Mapbox GL JS for the interactive map
- Backend: Express.js server acting as an API proxy for the Translink EFA API (protecting the API key server-side) and the PSNI Crime API
- Data integration: 6 live data sources — Translink departures/routes/journey planning, UK Police street crime, PSNI collision data, pothole reports, air quality stations, and lighting faults
- Safety engine: Haversine distance filtering (100m radius), transit-relevant crime filtering, weighted severity scoring (robbery 4x vs anti-social behaviour 0.3x), time-of-day context
- Design: Figma AI for initial UI wireframes, exported and integrated into the codebase. Custom canvas-drawn map icons since Mapbox doesn't support emoji in symbol layers
- AI-assisted development: Claude Opus for agent-driven development, spec-driven methodology
Challenges we faced
- Translink API documentation was a 185-page PDF — we had to extract it programmatically and reverse-engineer the EFA endpoint structure
- Mapbox GL JS doesn't render emoji in symbol layers — we pivoted to canvas-drawn custom icons (triangles, X marks, diamonds)
- The LineList endpoint returns 2MB of XML for 2,600+ routes — we added server-side caching and client-side pagination to keep it performant
- Crime data volume — the PSNI Crime API returns 1,400+ crimes per month for Belfast city centre. We had to implement haversine distance filtering and weighted scoring to make the safety analysis meaningful rather than just scary
- No live vehicle GPS — Translink's API is a journey planner, not a vehicle tracker. We interpolated bus positions between stops based on departure times using maths
What we learned
- How to work with the EFA (Electronic Fahrplan Auskunft) journey planner API standard used across European transit systems
- That combining multiple open data sources creates far more value than any single source alone
- The importance of contextualising data — raw crime counts are meaningless without radius filtering, category weighting, and per-day normalisation
- Canvas API for generating custom Mapbox marker images at runtime
Built With
- canvas-api
- claude-opus
- css3
- express.js
- fast-xml-parser
- figma-ai
- html5
- javascript
- mapbox-gl-js
- node.js
- papaparse
- proj4
- react
- react-map-gl
- react-router
- tailwind-css
- translink-efa-api
- uk-police-api
- vite


Log in or sign up for Devpost to join the conversation.