-
-
CTA: Encourages people to share the data and help shift how we talk about mental health.
-
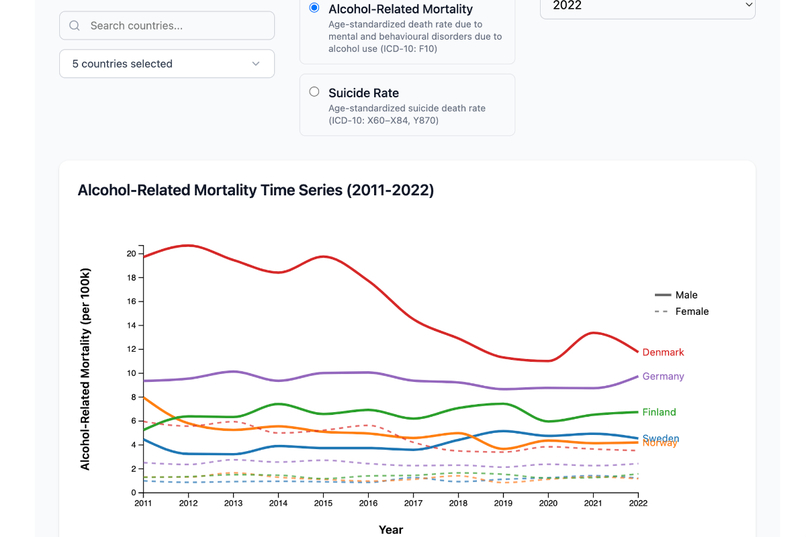
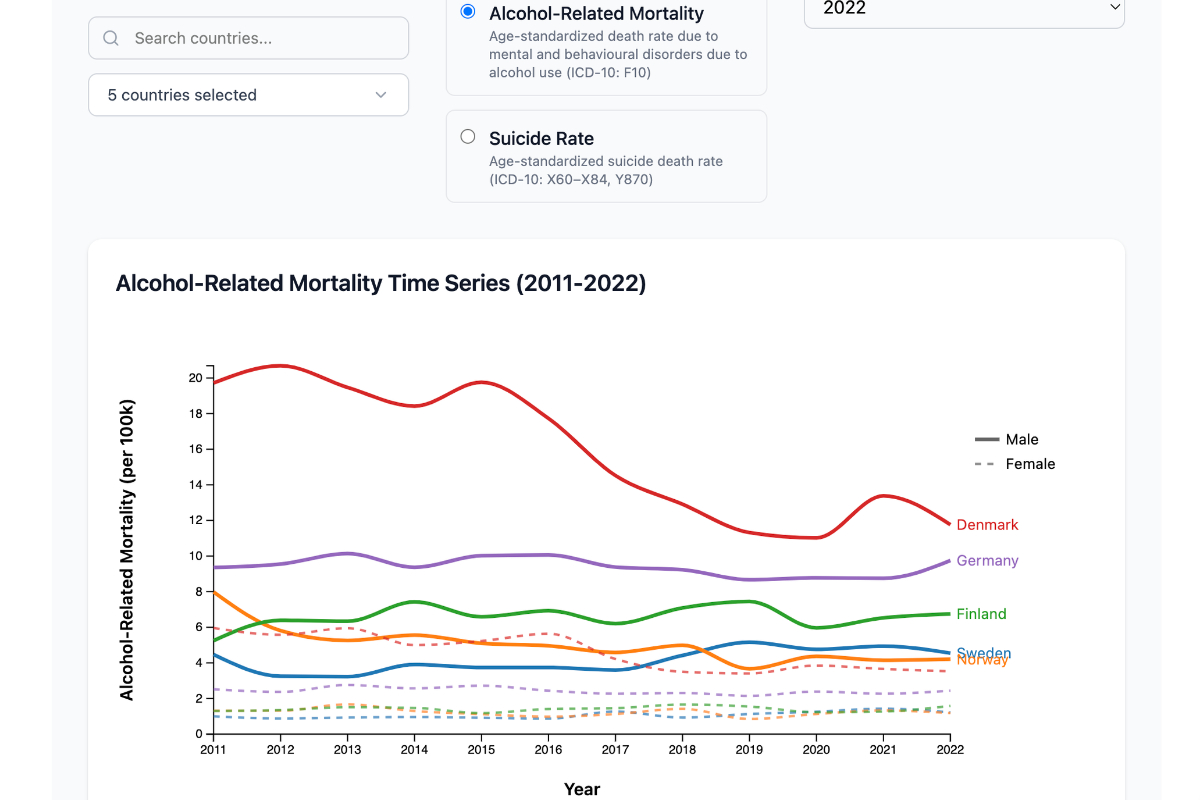
Charts: See how alcohol-related deaths and suicide have changed over time in different countries.
-
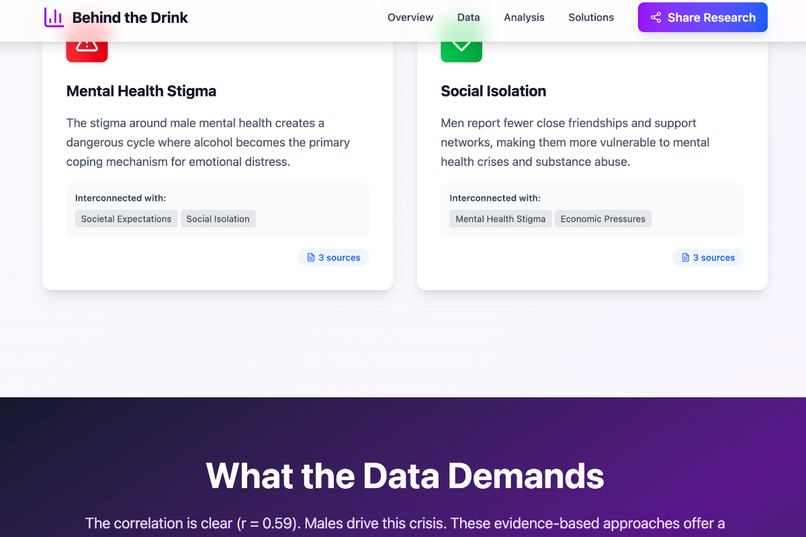
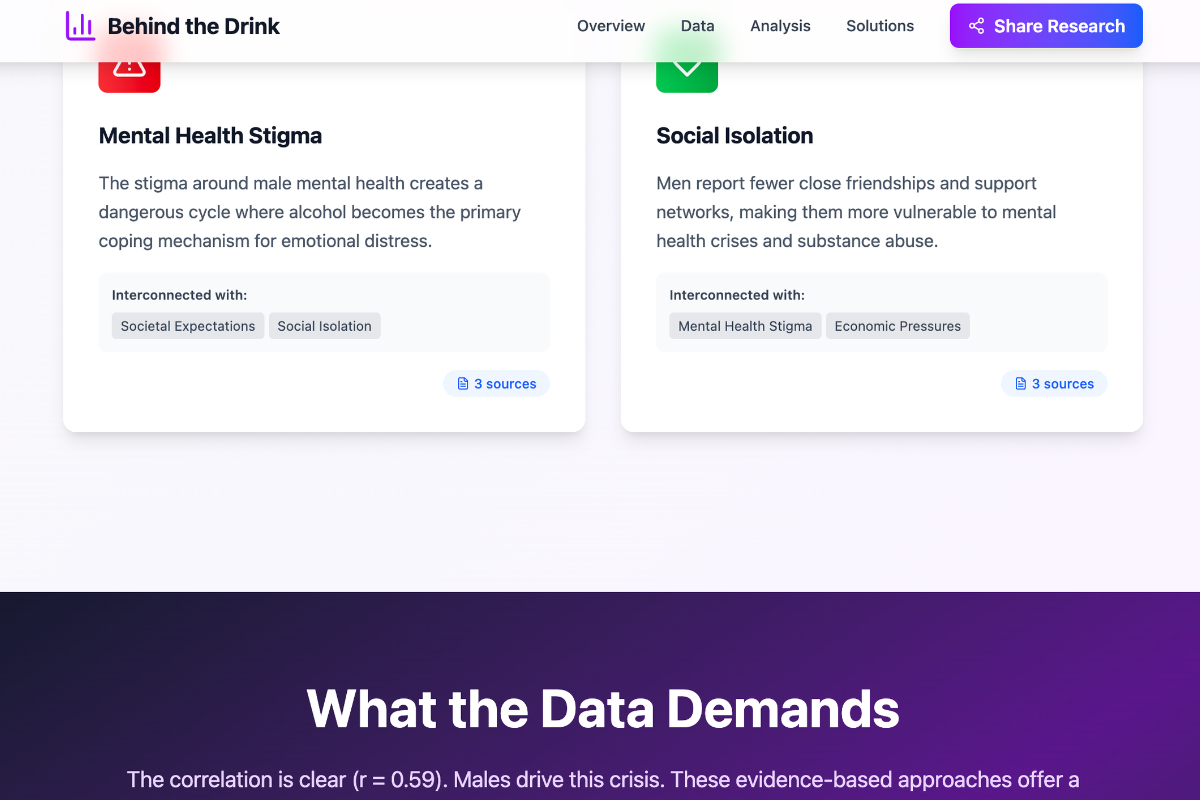
Insights: Breaks down what might be driving the trends – like stigma and social isolation.
-
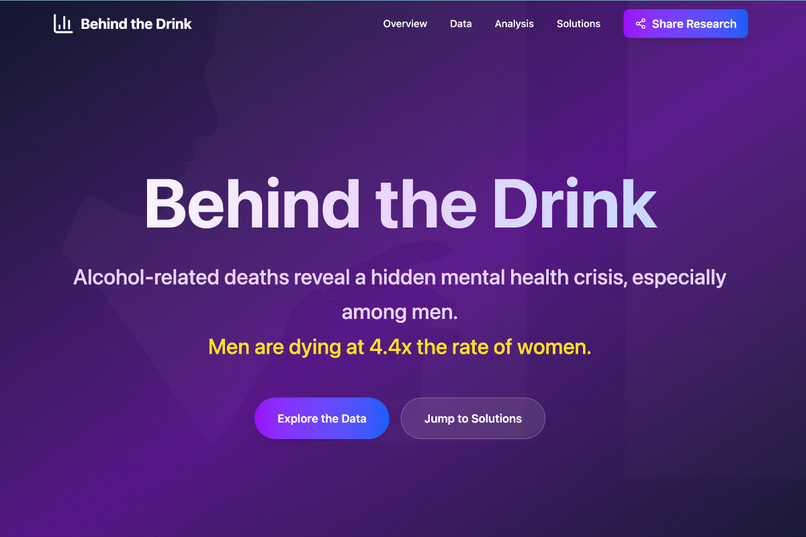
Hero: “Behind the Drink” starts with a clear message about how alcohol deaths hit men harder.

💡 Inspiration
The project was inspired by a simple but powerful observation: men across Europe are dying from alcohol-related causes at 4.4× the rate of women. Could this be more than substance abuse? Could it reflect deeper mental health struggles – hidden behind social norms and stigma?
That question led to a full analytical journey: collecting public health data, uncovering hidden patterns, and building a gender-focused narrative that connects alcohol mortality to mental well-being.
🧠 What it does
Behind the Drink is a visual, data-driven storytelling site that:
- Analyzes alcohol-related deaths, suicide rates, and accident deaths across Europe (2011–2022)
- Examines gender differences and correlations between metrics
- Provides an interactive way to explore trends by country, sex, and year
- Presents a clear narrative showing how alcohol misuse mirrors underlying mental health challenges
🛠️ How it was built
- Data Sourcing: Collected from data.europa.eu — four Eurostat datasets
- Data Cleaning + Analysis: Performed using SQL in Google BigQuery
- Correlation Analysis: Used Pearson correlation to analyze alcohol-suicide relationships by gender (r = 0.59)
- Design + Storytelling: Built in Bolt.new, using responsive storytelling blocks, interactive components, and embedded visuals
🧗 Challenges along the way
- Messy Time Ranges: Datasets didn’t always cover the same years or countries — we had to carefully align everything
- Incomplete Coverage: Some countries were missing data or had outdated records
- Correlation ≠ Causation: We had to tread carefully to avoid making causal claims
- Finding the Right Tone: Striking a balance between emotional impact and statistical honesty was harder than expected
🏆 Key accomplishments:
- Built a fully responsive, interactive data site – mostly with no-code tools
- Created a clean, professional narrative out of complex, comprehensive data
- Discovered a clear, significant statistical signal (r = 0.59) linking alcohol deaths and suicide, especially in men
- Launched behind-the-drink.xyz as a public data story
- Deployed a live public API at api.behind-the-drink.xyz for programmatic data access
📚 Lessons learned
- Public health data can be tricky to work with, but of high quality and very powerful
- Gender-based analysis adds critical nuance to mental health research
- Storytelling is as important as stats – especially in projects that deal with life-and-death topics
- Tools like Bolt.new enable solo creators to tell complex stories quickly and beautifully
🚀 What's next for Behind the Drink
- Publish full dataset + methodology to Kaggle and GitHub
- Expand the public API with additional filtering and aggregation endpoints
- Build a timeline of policy interventions across countries
- Add filters for age groups, accident deaths, or economic indicators
- Collect qualitative stories from people affected by substance and mental health issues
- Develop a short video explainer or workshop to bring the topic into classrooms or public health orgs
Built With
- bolt.new
- elevenlabs
- eurostat-datasets
- figma
- github
- google-bigquery
- google-sheets
- javascript
- netlify
- openai
- react
- sql
- tailwind-css
- vercel
- vite

Log in or sign up for Devpost to join the conversation.