Inspiration
I was inspired to make a project about data visualization. I figured that making a map about the traffic data around here would be a good starting point.
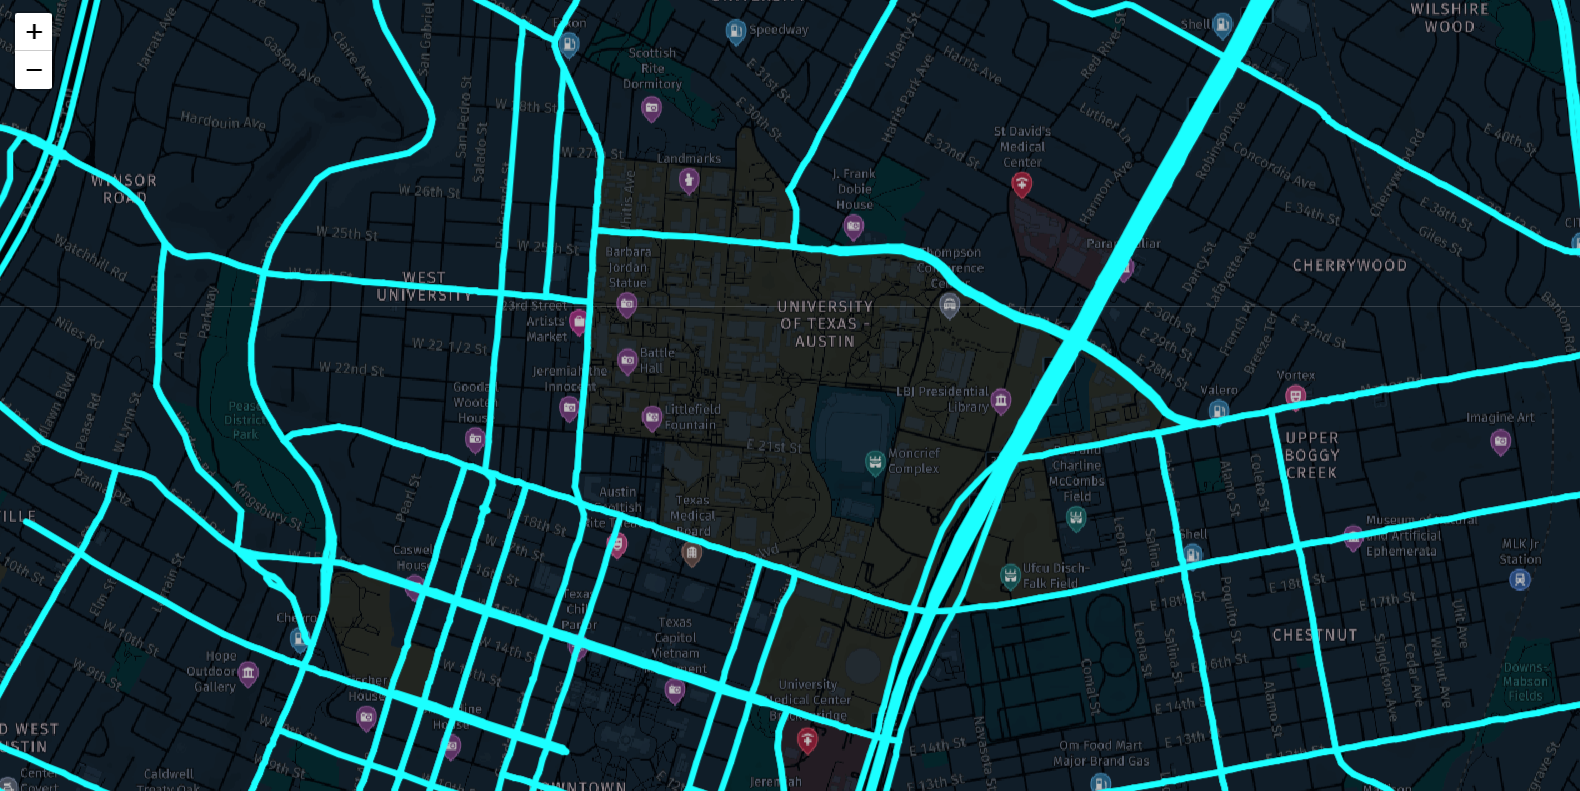
What it does
It displays the live traffic data around UT Austin campus.
How we built it
I used JavaScript, HTML, CSS, leaflet.js, and the HERE Maps API.
Challenges we ran into
I ran into some issues with getting the traffic data to render correctly and without crashing the site.
Accomplishments that we're proud of
I'm proud that I at least achieved my baseline goal of visualizing the traffic data correctly.
What we learned
I learned how to better use APIs and a lot about hosting websies.
What's next for Beep Beep Bevo
I aim to render the map in a pixel art style and add the ability to create location pins.
Built With
- css
- here-map-image
- here-maps-api
- html
- javascript
- leaflet.js

Log in or sign up for Devpost to join the conversation.