B.E.F. — Biometric Enhancement Framework:
Streaming multi-user health data for easy querying in natural language, continuous monitoring of cardiac events, and alert based ECG reconstruction with accelerated edge compute
Intended Use
B.E.F. streamlines multi-user wearable data—such as workout sessions, daily activities, and sleep logs—into a single, queryable dashboard. Its primary users include leaders in high-stakes environments, like military officers or coaches, who need insights on team fitness and risk without being medical experts. By integrating Terra’s HIPAA-compliant APIs, the framework continuously pulls health metrics, then leverages an LLM for natural-language querying. This allows a colonel or coach to ask, for example, “Who’s most fit and who’s at highest injury risk?” and receive an immediate, actionable summary without parsing raw data.
Beyond readiness assessments, B.E.F. provides real-time cardiac monitoring: when our 1D CNN flags potential arrhythmias, a BiLSTM model reconstructs a single-lead ECG, offering medical professionals a more familiar signal for follow-up. The entire pipeline—from data ingestion to alert generation—runs securely on edge hardware, ensuring compliance, minimal latency, and fully localized control of sensitive health information.
Limitations Faced
While Terra offered a powerful aggregation tool, several challenges emerged:
- Real-Time vs. Post-Event Data: Terra provides near-real-time updates via its SDK and webhook notifications; however, many data points are only available after the completion of an activity or sleep session. This means that truly continuous, minute-by-minute data was not always available.
- Data Gaps and Syncing Issues: The system sometimes encountered incomplete data. If a device had not synced to its cloud service or if Terra experienced an outage with a particular source, there were noticeable gaps in the dataset.
- Limited User and Data Volume: For our prototype, we only had a limited number of test users and devices, which meant that the dataset was relatively small. This constrained the diversity and volume of data available for analysis.
Impact on the Project
Due to these limitations, the project pivoted from expecting a fully real-time data stream to using historical and periodic updates. We implemented scheduled data fetches (e.g., every few hours) rather than a continuous stream. This approach was sufficient for generating meaningful summaries and answering questions based on past data, but it also meant that some real-time use cases (like instant alerts on abnormal metrics) could not be fully realized.
EDGE-DEVICE Implementation
The Mistral AI 7B model is a 7.3-billion-parameter large language model that we chose as the core AI engine for the Health Command Center hosted on a singular GPU in Rayan's poor overworked GPU. This model was selected because it offers strong performance relative to its size, is open-source, and is designed for conversational, instruct-tuned tasks.
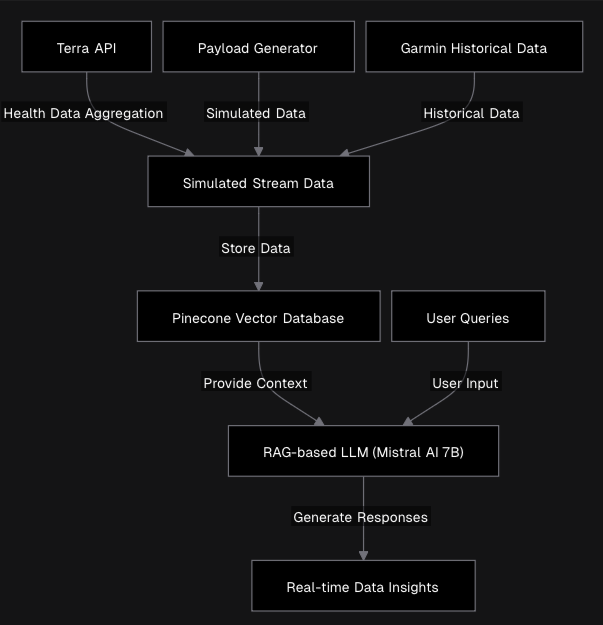
Integration and Pipeline
Our system aim to use a Retrieval-Augmented Generation (RAG) approach by integrating the Mistral 7B model with our Terra dataset stored in a Pinecone vector database. Here’s a breakdown of the process:
Data Indexing in Pinecone:
- We would convert collected health data (e.g., "Date: 2025-02-10 – Steps: 12,000; Avg. Heart Rate: 75 bpm; Sleep: 7.5 hours") into textual summaries.
- These summaries would be transformed into high-dimensional vectors (embeddings) using an embedding model.
- The resulting vectors are stored in the Pinecone vector database, creating an index of the user’s health data that supports fast similarity searches.
Query Embedding:
- When a user asks a question (e.g., "Did I meet my step goal this week?"), the query is embedded into the same high-dimensional space.
- This ensures that semantically similar queries and data entries have vector representations that are close together.
Retrieval from Pinecone:
- The query embedding is used to perform a similarity search within the Pinecone database.
- The top matching entries (typically the most relevant data points) are retrieved to serve as context for the model’s response.
Response Generation with Mistral 7B:
- The retrieved contextual data is combined with the original query and fed into the Mistral 7B model.
- Mistral 7B generates a response grounded in the specific health data. For instance, it might respond:
"Yes, you met your step goal on 5 out of 7 days this week, with an average of 11,000 steps per day, exceeding your goal of 10,000 steps." - This approach ensures that the AI’s answers are factual and based on the actual data rather than on generalized assumptions.
ECG Reconstruction and AFIB Classification Inference
Our system addresses two primary goals:
- Classify arrhythmic events directly from PPG data.
- Reconstruct a single-lead ECG signal from PPG, enabling physicians to interpret events more reliably.
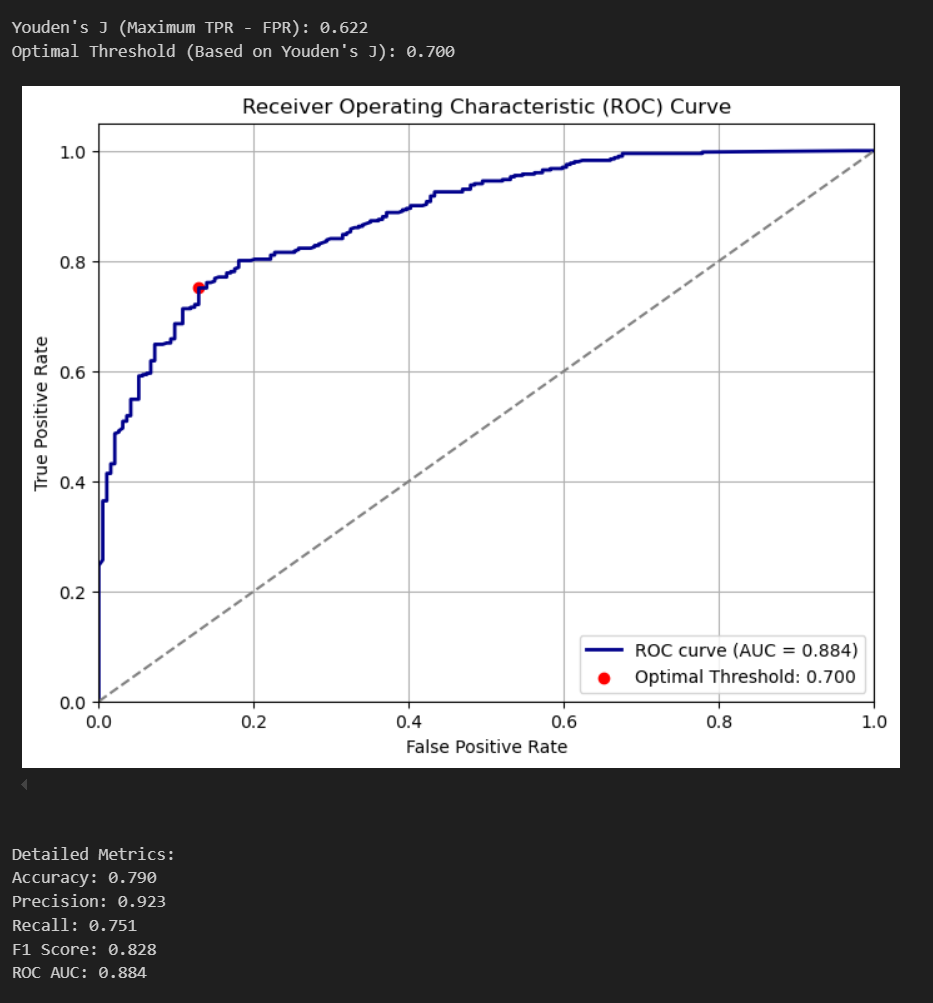
1. Arrhythmia Detection with a Lightweight 1D CNN
We trained a 1D CNN on a PPG dataset (70% split for training) to determine whether a given PPG segment indicates an abnormal event—such as frequent premature ventricular contractions (PVCs) or atrial fibrillation. Key highlights:
- Architecture: Two convolution layers (16 then 32 channels), global max pooling, and a final fully connected layer for a binary classification logit.
- Performance: Despite its simplicity, this CNN outperformed more complex models like LSTMs and classical machine-learning approaches (SVM, random forests). It also converged more reliably, making it ideal for on-edge inference.
- Training: We used a combination of SGD with momentum and
BCEWithLogitsLoss, leveraging mixed precision (torch.cuda.amp) for efficiency.
Once this model flags an abnormal segment, the system triggers the reconstruction step described below.
2. Single-Lead ECG Reconstruction via a BiLSTM
When the CNN identifies a suspicious arrhythmia, we reconstruct a single-lead ECG from the same time-aligned PPG segment, offering a more familiar signal for clinical review:
Workflow:
- During the user’s initial setup, they can record short bursts of simultaneous ECG (e.g., from an Apple Watch) and PPG data for personalized calibration.
- This paired data trains a small BiLSTM network to map from PPG signals to the corresponding ECG waveform.
- Once deployed, whenever the PPG classifier detects an arrhythmic event, the trained BiLSTM model reconstructs a single-lead ECG snippet.
- During the user’s initial setup, they can record short bursts of simultaneous ECG (e.g., from an Apple Watch) and PPG data for personalized calibration.
Architecture: A two-layer bidirectional LSTM (hidden size = 64) with a linear layer outputting a single channel at each time step.
Loss Function: Mean Squared Error (MSE) between the reconstructed ECG and the actual ECG ground truth.
Efficiency: Early stopping and Adam optimization keep training fast and prevent overfitting, making it practical to fine-tune per user on consumer-grade hardware. Note - paired-PPG-ECG database sourced from here
Significance
By combining arrhythmia detection (1D CNN) with on-the-fly ECG reconstruction (BiLSTM), our approach ensures:
- Timely Alerts for non-experts (e.g., coaches or team leaders) when something is amiss.
- Clinically Interpretable Data (ECG-like signals) for physicians to review remotely.
- Low Resource Requirements, making real-time monitoring feasible at the edge without specialized medical devices or extensive GPU infrastructure.
Workflow
When an anomalous event is detected in the health data from Terra—such as irregular heart rhythm patterns—the system immediately initiates an in-depth analysis by reconstructing the ECG signal. This process involves several critical steps:
Event Detection and Trigger
The system continuously monitors incoming wearable data for any irregularities or predefined warning signs. Once an event is detected, it triggers a signal that activates further analysis.Dedicated GPU-Powered Endpoint
An endpoint hosted on Rayan's desktop, equipped with an NVIDIA GPU, is designated to handle the computationally intensive tasks like Fortnite. This setup ensures that the ECG reconstruction and subsequent classification are performed quickly and efficiently.AFIB Classification Inference
Advanced machine learning algorithms (ground-up made deep neural networks optimized for time-series data) analyze the signal. These algorithms are specifically trained to identify patterns associated with atrial fibrillation (AFIB) as well as other cardiac anomalies. The outcome is a classification that indicates whether the detected patterns correspond to AFIB or another condition.ECG Reconstruction
Instead of relying solely on raw wearable sensor data—which may be incomplete—the system reconstructs a high-fidelity ECG signal when an alert is processed. This process integrates multiple data streams to generate a detailed view of the heart's electrical activity, providing a clearer understanding of potential abnormalities.Actionable Insights
With a high-quality ECG and a corresponding classification result, the system is able to offer actionable insights. If AFIB or another serious cardiac condition is detected, the system generates alerts for further review by medical professionals, ensuring timely intervention.
This integrated, GPU-accelerated approach enhances the overall reliability and depth of our health monitoring system, transforming raw sensor data into critical, actionable medical insights.
Technical Challenges
Throughout the development of the B.E.F., we encountered several significant technical challenges, which led to valuable learning experiences and informed our future directions.
Data Synchronization and Freshness
- Challenge: Ensuring that the health data remained up-to-date was difficult due to reliance on periodic data fetching rather than true continuous streaming.
Real-Time Streaming Difficulties
- Challenge: While Terra offers real-time streaming via WebSocket connections and BLE, implementing a stable, continuous data stream was complex.
User Interface and Experience
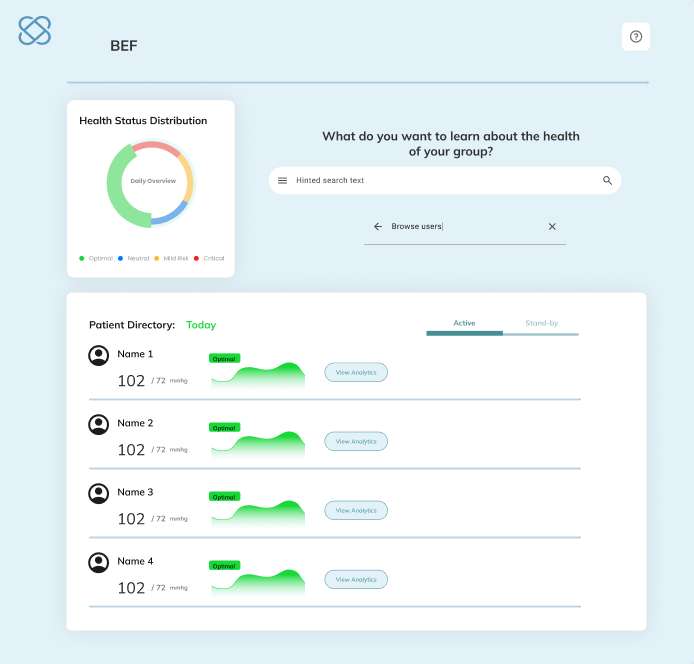
The design of the user interface (UI) aimed to create an intuitive, conversational experience where users could query their health data as if talking to a personal health assistant.
Interaction Flow
- Chat-Style Interface: Users interact via a simple chat window, where they type natural language questions.
- Immediate Feedback: Upon query submission, the system processes the query using the RAG pipeline and responds within a few seconds with a detailed, conversational answer.
Sample Queries and Responses
Query: "What was their average heart rate this week?"
Response: "This week, their average resting heart rate was about 72 bpm. It remained stable throughout the week, ranging from 70 to 74 bpm, which is consistent with their usual readings."Query: "Did they meet my step goals recently?"
Response: "Over the past 7 days, they met or exceeded your daily step goal on 5 days. Their best performance was on Thursday with 12,345 steps, while two days fell slightly short at around 8,000 steps."Query: "How has the teams sleep been in the last month?"
Response: "In the last month, they averaged approximately 6 hours 45 minutes of sleep per night. There were about 10 nights where they achieved the recommended 7–8 hours, though a few nights dropped to around 5 hours. This suggests a trend of slightly below-target sleep on many days."Query: "Give me a summary of the teams workout performance."
Response: "In the past two weeks, they completed 5 workout sessions. They ran a total of 15 miles with an average pace of 9 minutes per mile, burning roughly 2,300 calories. Notably, their longest run was 5 miles on Tuesday, and their pace has improved by about 30 seconds per mile compared to two weeks ago."
Future Enhancements
Enhanced User Interface and Visualizations
- Dynamic Visuals: Future iterations should incorporate interactive charts and graphs that dynamically update as users query different aspects of their health.
- Mobile and Voice-Enabled Interfaces: Developing dedicated mobile apps and voice-controlled interfaces would enhance accessibility and enable seamless integration into daily routines.
- User-Centric Customization: Allowing users to customize their dashboard and the types of alerts or insights they receive would create a more personalized experience.
Built With
- cuda
- python
- pytorch
- react-native
- terraapi
- vercel
- vercelv0


Log in or sign up for Devpost to join the conversation.