-
-
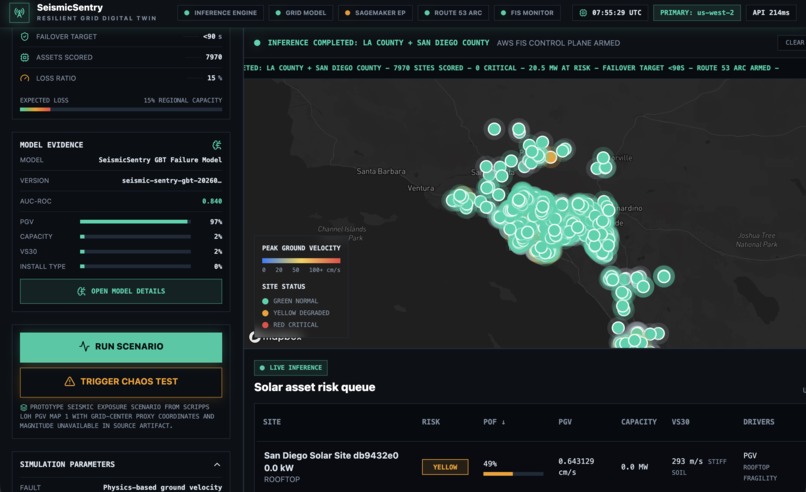
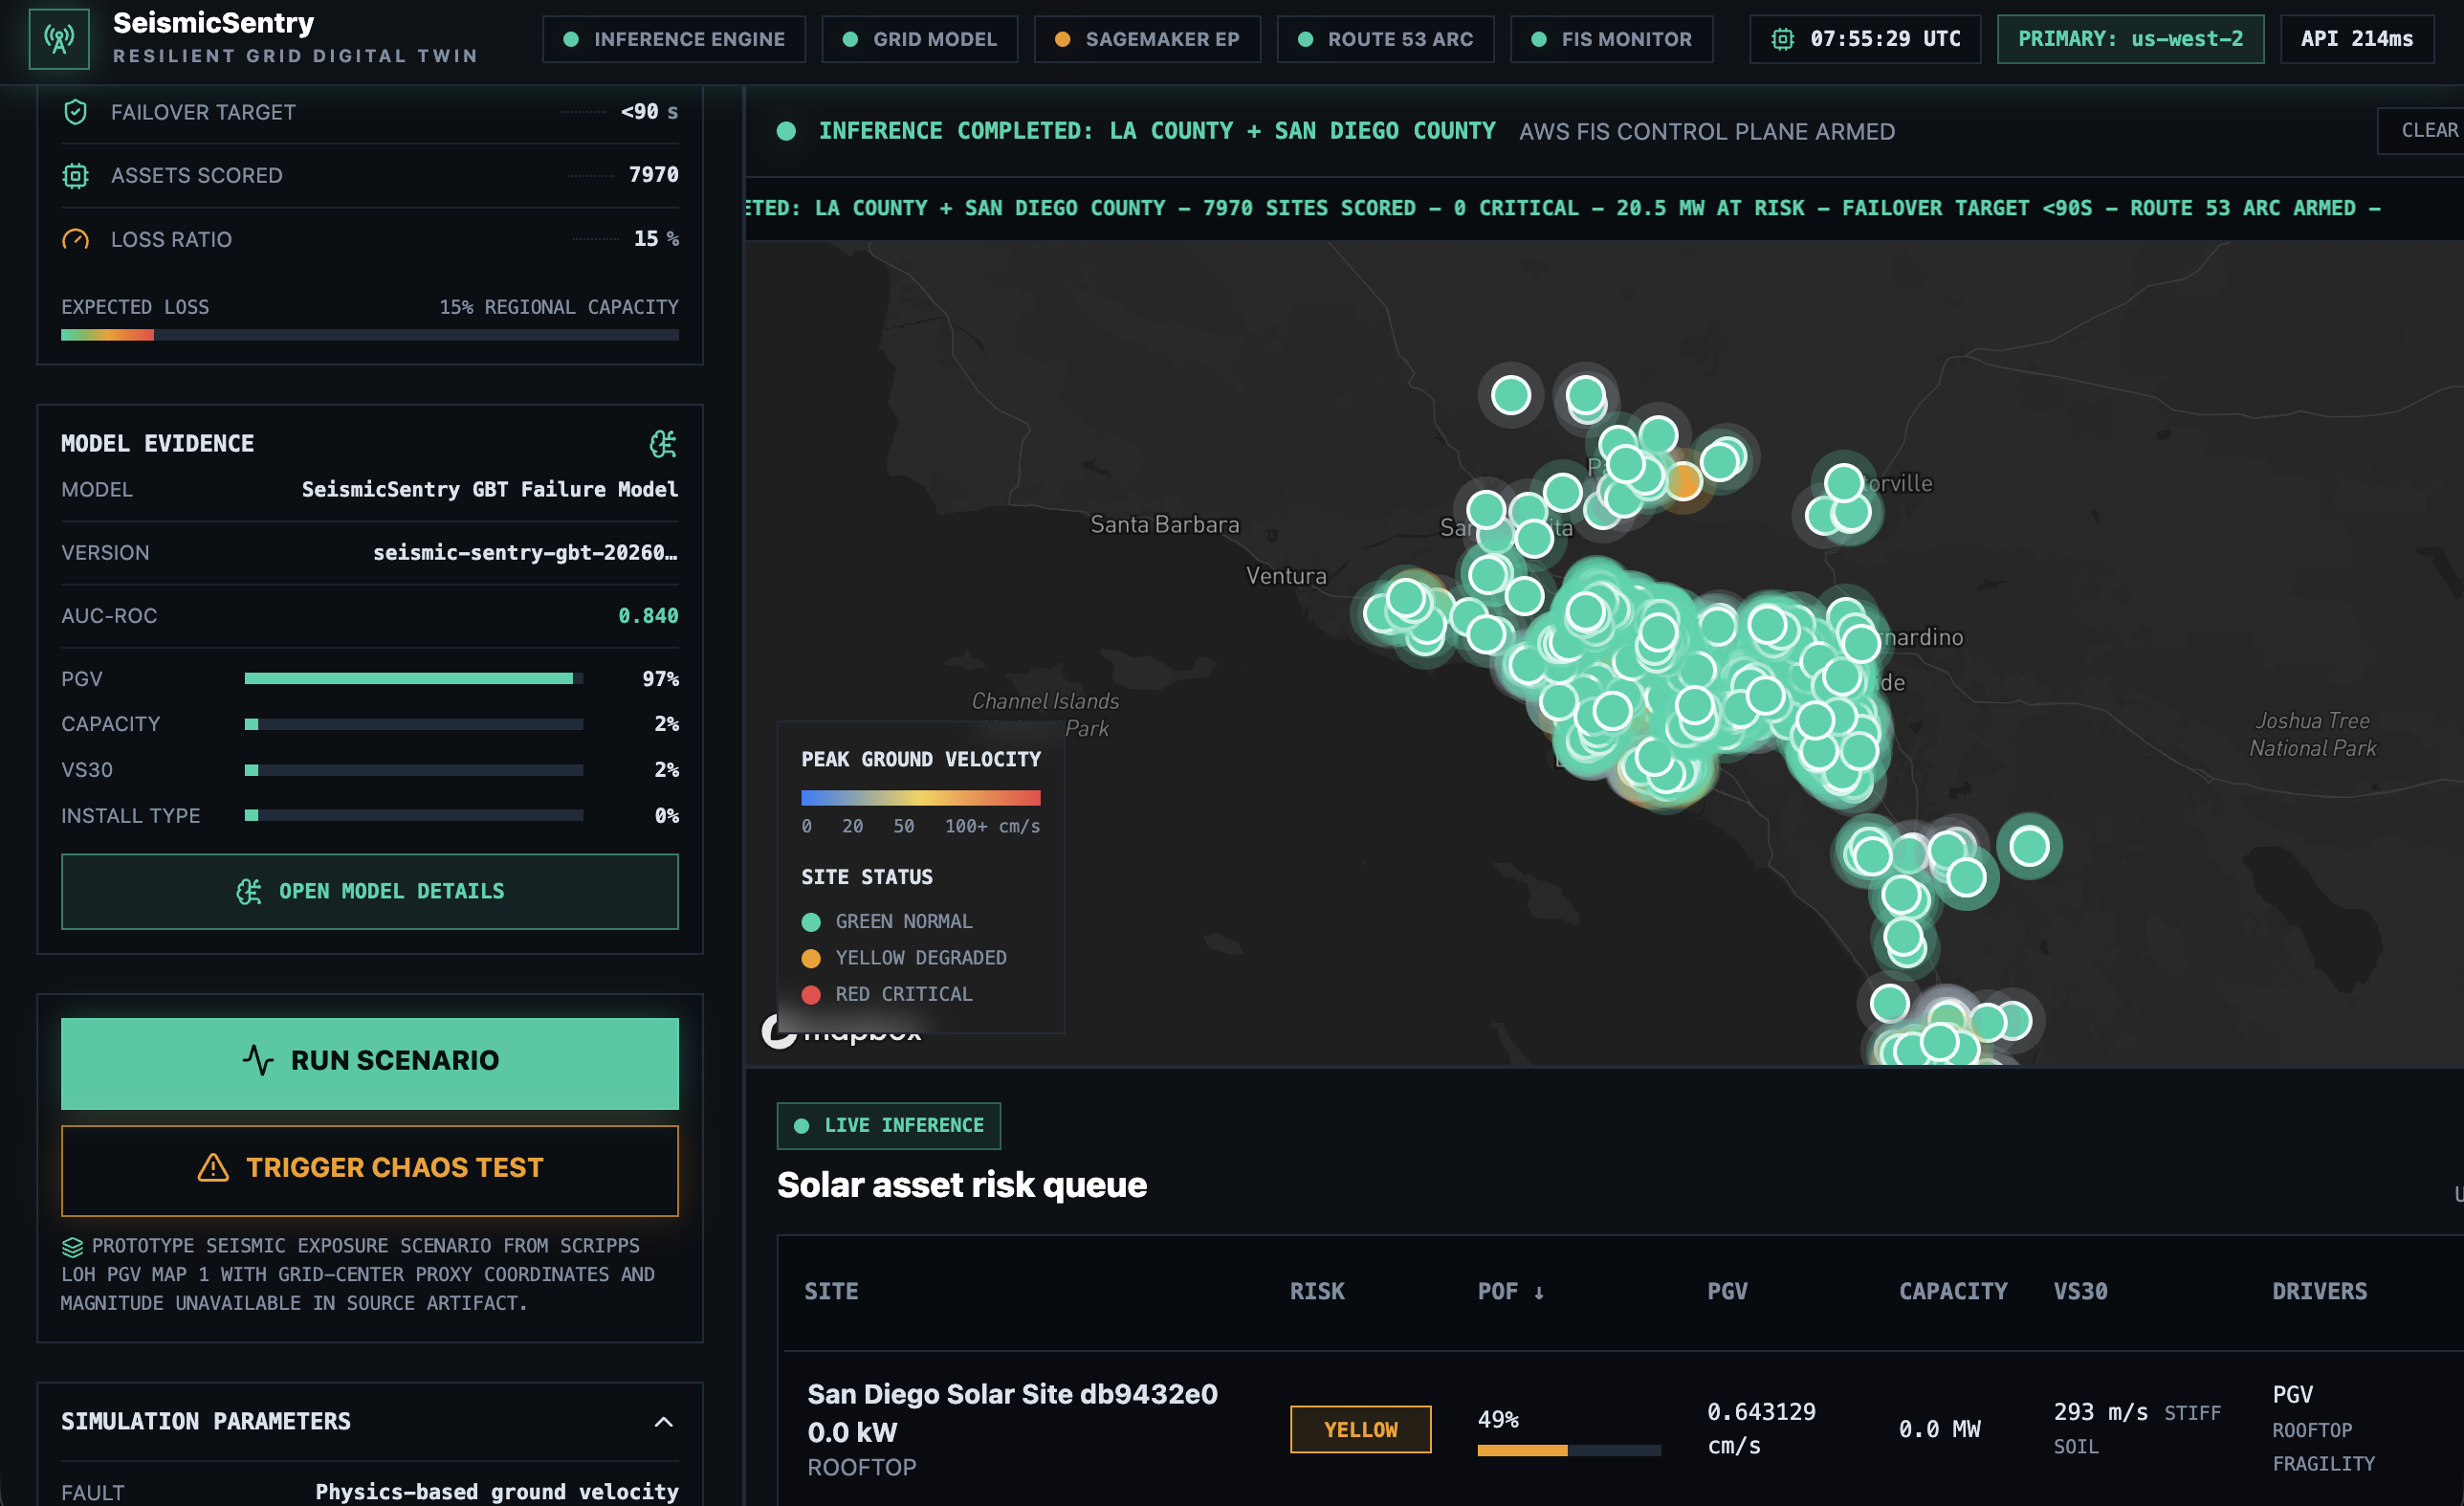
Homescreen of ChudOps
Inspiration
We were browsing the datasets early on and opened the Scripps earthquake simulation data out of curiosity. It produces Peak Ground Velocity maps for Southern California, a spatial grid of shaking intensity for a given earthquake scenario. Then we found the ZenPower solar permit dataset: real GPS coordinates for solar installations across SoCal. We overlaid them and the question wrote itself: which of these sites just failed, and does anyone know in real time? That became the project.
What it does
ChudOps ingests physics-based seismic simulation data and scores every solar installation in Southern California with a Probability of Failure in under two seconds. A React + MapBox dashboard shows each site as Green, Yellow, or Red based on predicted damage. The system also runs a chaos experiment that simulates a regional cloud outage triggered by the same earthquake, then automatically fails over to a secondary AWS region to keep the dashboard live, generating a resilience report when recovery is confirmed.
How we built it
We extract Peak Ground Velocity values from Scripps NetCDF simulation grids and join them to ZenPower installation coordinates with USGS Vs30 soil classification as a third feature. Those feed an XGBoost model outputting Probability of Failure per site:
$$ \text{PoF}_i = f\left(\text{PGV}_i,\ \text{InstallType}_i,\ \text{Vs30}_i\right) $$
Labels were derived from FEMA HAZUS fragility curves since real-world failure records at this resolution don't exist. The stack is React + MapBox on the frontend, SageMaker for inference, Lambda + AppSync on the backend, and AWS CDK for infrastructure. Chaos engineering runs via AWS Fault Injection Service with Route 53 ARC handling automatic failover.
Challenges we ran into
The Scripps data comes in NetCDF format, which neither of us had worked with before. Extracting a clean 2D PGV slice from a 4D spatiotemporal array and getting it into a usable coordinate grid took most of the first few hours. The other challenge was scope — we had to cut a lot and make deliberate calls about what the core demo actually needed to show.
Accomplishments that we're proud of
Getting the chaos experiment to work end-to-end. Watching Route 53 ARC execute a real failover in 72 seconds after FIS injected a fault was the most satisfying moment of the weekend. We're also proud that every data source in this project is real — the seismic simulations are published research, the solar locations are actual permit records, and the damage model is grounded in FEMA engineering standards.
What we learned
The most useful thing was learning that NetCDF and geospatial data pipelines are genuinely hard to work with quickly. We also hadn't used AWS FIS before — chaos engineering went from a concept we'd read about to something we actually ran against our own system in a weekend.
What's next for ChudOps
Replacing the simulated PGV input with a live USGS ShakeMap feed so the system responds to real earthquakes as they happen. We'd also want to expand beyond solar to model other distributed energy resources — wind installations, substations, battery storage sites.
Built With
- amazon
- amazon-web-services
- api
- appsync
- cdk
- cloudformation
- cloudfront
- cloudwatch
- dynamodb
- fault
- framermotion
- gateway
- iam
- injection
- javascript
- lambda
- mapboxgl
- node.js
- npm
- numpy
- pandas
- python
- react
- recharts
- route53
- s3
- sagemaker
- scikit-learn
- service
- sns
- tailwindcss
- typescript
- vite
- xgboost

Log in or sign up for Devpost to join the conversation.