Inspiration
We are a team of a biologist and a modeler/developer both working in an ecology department. Romain is a long time R user and still likes this software for statistics. Quentin on the other hand is a Python advocate, and feels that in particular Python offers better visualization capabilities. Beaker allows the best of both worlds, and this is why we gave it a try!
How it works
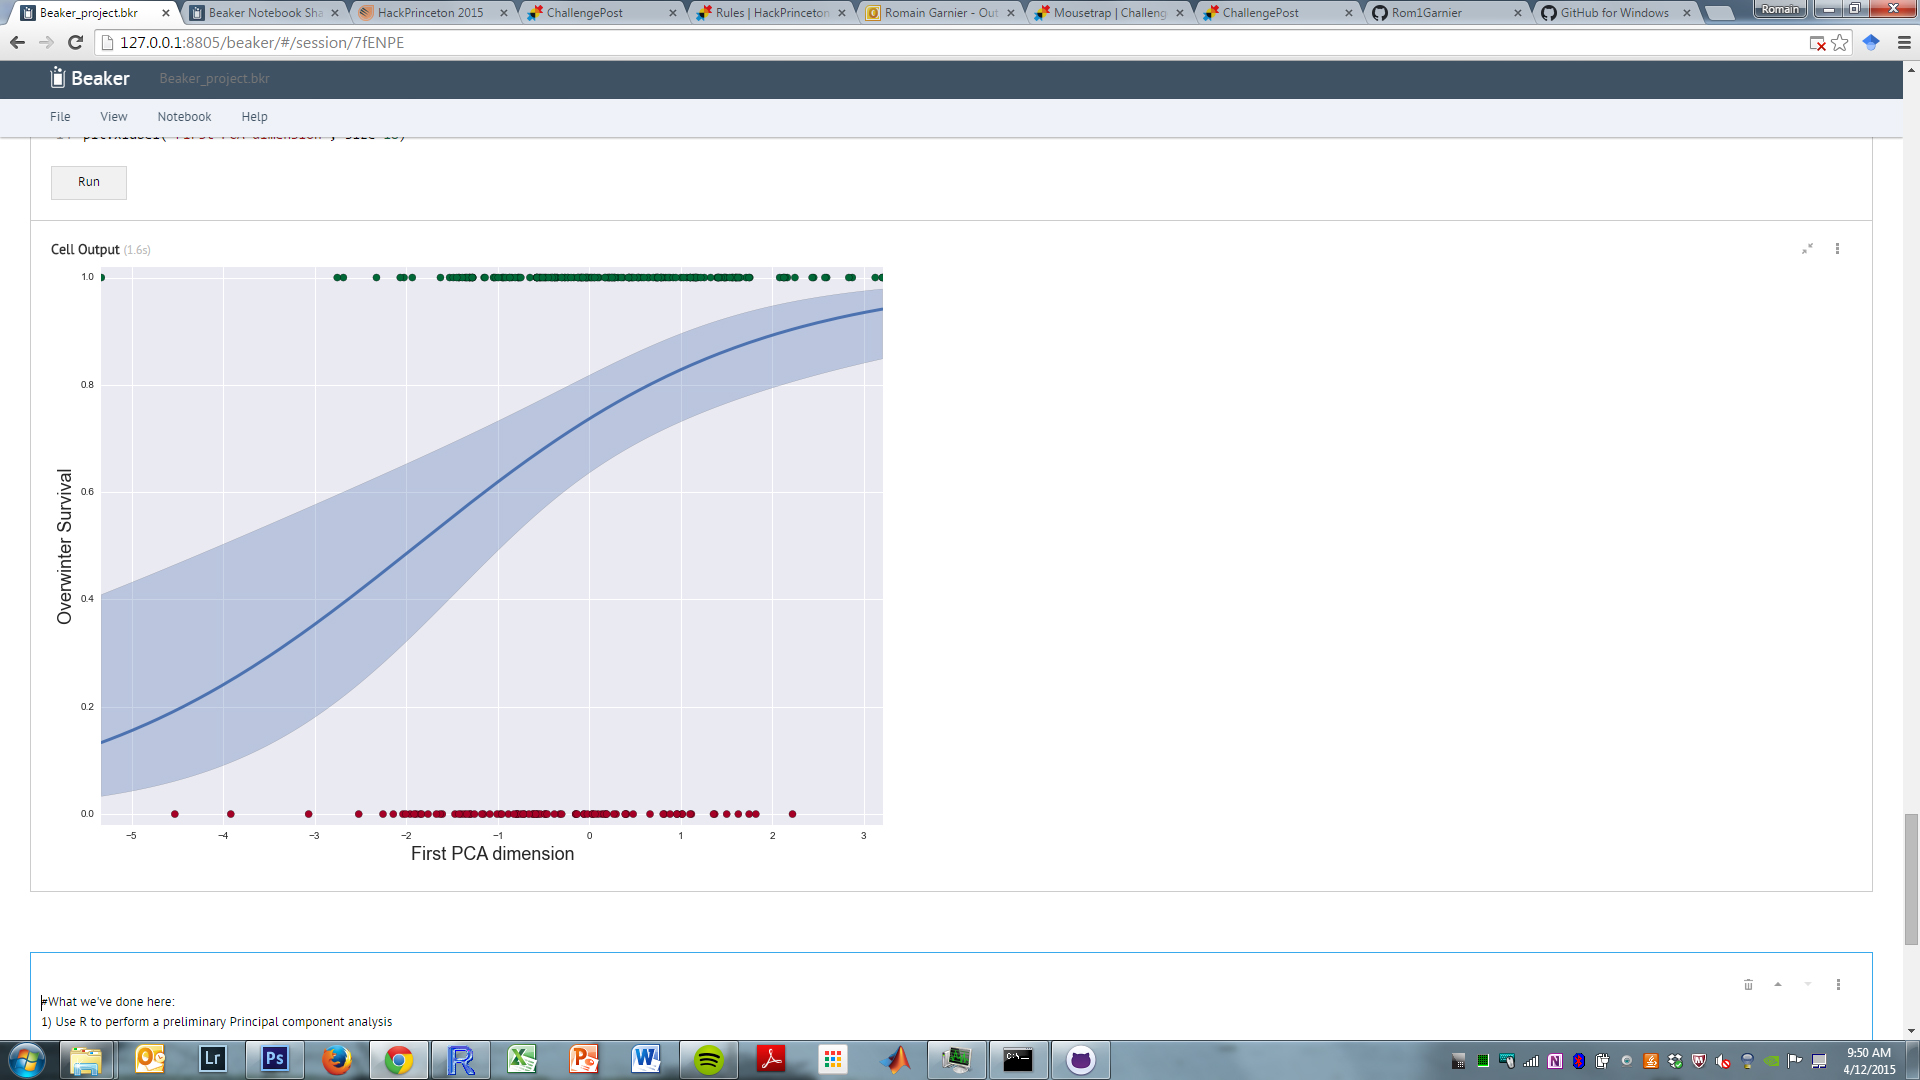
The data used here are biological data obtained from sheep, that we are both working on at this time. Here, we first use some statistics to find relations between our variables, and then use the resulting data to better understand our system.
Challenges I ran into
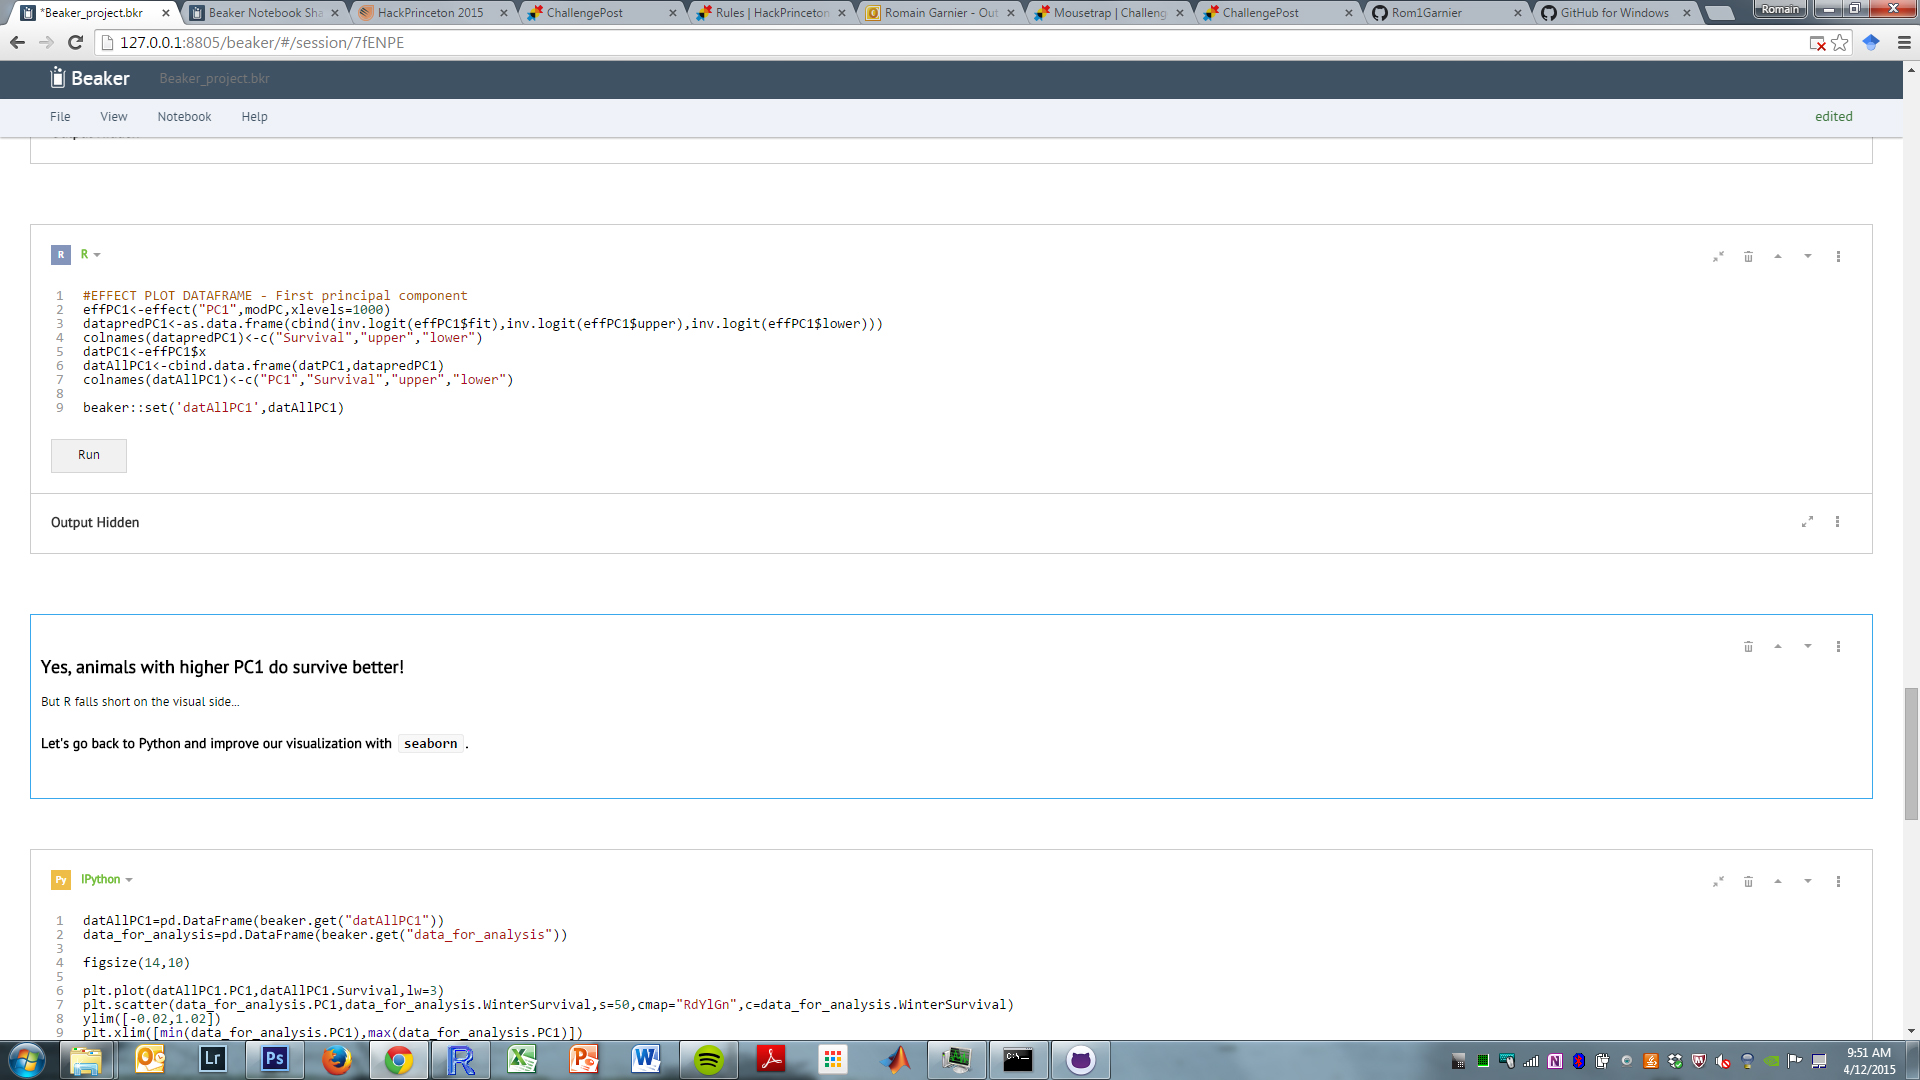
Beaker runs somewhat smoothly, but you still need to get both syntaxes correct. And it's not necessarily easy to switch from to the other. It's definitely a learning curve!
Accomplishments that I'm proud of
Good statistics and pretty figures... at the same time!
What I learned
I guess the main lesson here is that is possible (and relatively easy!) to make nice figures and good statistics in a single notebook.
What's next for Beaker for biological data
We are both scientists... The next obvious step when with good statistics and figures is to write up a publication!

Log in or sign up for Devpost to join the conversation.